. 2023 Sep 13;12(1):228.
doi: 10.1038/s41377-023-01248-6.

DEEP-squared: deep learning powered De-scattering with Excitation Patterning

Affiliations

DEEP-squared: deep learning powered De-scattering with Excitation Patterning

Navodini Wijethilake et al. Light Sci Appl. .

Abstract

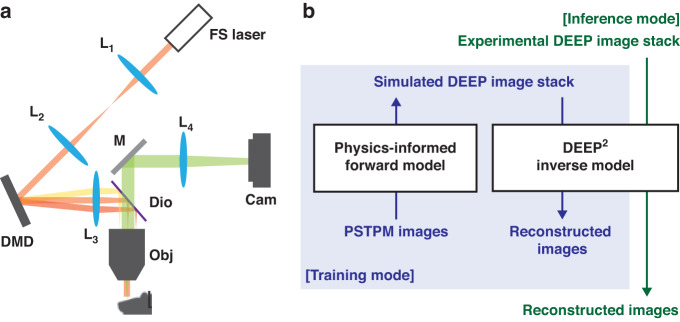
Limited throughput is a key challenge in in vivo deep tissue imaging using nonlinear optical microscopy. Point scanning multiphoton microscopy, the current gold standard, is slow especially compared to the widefield imaging modalities used for optically cleared or thin specimens. We recently introduced "De-scattering with Excitation Patterning" or "DEEP" as a widefield alternative to point-scanning geometries. Using patterned multiphoton excitation, DEEP encodes spatial information inside tissue before scattering. However, to de-scatter at typical depths, hundreds of such patterned excitations were needed. In this work, we present DEEP2, a deep learning-based model that can de-scatter images from just tens of patterned excitations instead of hundreds. Consequently, we improve DEEP's throughput by almost an order of magnitude. We demonstrate our method in multiple numerical and experimental imaging studies, including in vivo cortical vasculature imaging up to 4 scattering lengths deep in live mice.


Conflict of interest statement

The authors declare no competing interests.

Figures

Fig. 1
Fig. 1. The proposed DEEP2 imaging method.
a Optical schematic of the DEEP-TFM microscope: FS laser—amplified femtosecond laser; L1 and L2—optical relay; DMD—digital micro-mirror device; L3—excitation tube lens; Dio—dichroic mirror; Obj—objective lens; M—mirror; L4—emission tube lens; Cam—camera detector. b Schematic of the proposed physics-based forward model and the deep learning-based inverse model. In the training mode, point-scanning-two-photon microscopy (PSTPM) images are input to the physics-informed forward model to simulate their corresponding pixel-matched DEEP images. Then these paired simulated DEEP and PSTPM images are used to train the DEEP2 inverse model. In the inference mode, experimentally acquired DEEP images are input to the trained DEEP2 inverse model. The DEEP2 outputs reconstructions
Fig. 2
Fig. 2. DEEP2 validation results on Synthetic Fluorescent Beads at 4 scattering lengths (SLS) below the surface.
Synthetic beads-objects of the size of 1 and 4 μm, with the intensity of the 1 μm beads 5× higher than the 4 μm beads, were simulated. Their corresponding simulated DEEP-TFM image stacks were generated using the forward model. A subset of the data was used to train the DEEP2 inverse model, and the remaining unseen data were used to validate the model performance. a, d Two representative simulated DEEP-TFM image stacks (averaged over the 32 patterns). b, e Corresponding synthetic ground truths for the (a) and (d) instances. c, f DEEP2 reconstructions corresponding to (a) and (d) instances. The intensity along the lines G, H, and I shown in green, yellow and white on (a) is visualized in (gi). Similarly, the intensity along the lines J, K, and L are shown in (jl) plots
Fig. 3
Fig. 3. DEEP2 validation results on mouse pyramidal neurons with dendritic arbors at 2 and 6 scattering lengths (SLS) below the surface.
PSTPM images of mouse pyramidal neurons were recorded. Their corresponding simulated DEEP-TFM image stacks were generated using the forward model. A subset of the data was used to train the DEEP2 inverse model, and the remaining unseen data were used to validate the model performance. a, d, g, j Four representative simulated DEEP-TFM image stacks (averaged over the 32 patterns) used for validation. b, e, h, k The corresponding PSTPM ground truths for the (a), (d), (g) and (j) instances. c, f, i, l DEEP2 reconstructions corresponding to (a), (d), (g) and (j) instances. The intensity along the yellow lines M, N, O, and P are visualized in (mp) plots
Fig. 4
Fig. 4. DEEP2 validation results on mouse cortical vasculature structures at 2 and 4 scattering lengths (SLS) below the surface.
PSTPM images of mouse cortical vasculature were recorded. Their corresponding simulated DEEP-TFM image stacks were generated using the forward model. A subset of the data was used to train the DEEP2 inverse model, and the remaining unseen data were used to validate the model performance. a, d, g, j Four representative simulated DEEP-TFM image stacks (averaged over the 32 patterns) used for validation. b, e, h, k The corresponding PSTPM ground truths for the (a), (d), (g) and (j) instances. c, f, i, l DEEP2 reconstructions corresponding to (a), (d), (g) and (j) instances. The intensity along the yellow lines M, N, O, and P are visualized in (mp) plots
Fig. 5
Fig. 5. Experimental DEEP2 test results on fluorescent beads at 4 scattering lengths below the surface.
A mixture of 1 and 4 μm beads was prepared and imaged through an intralipid layer using the DEEP-TFM microscope. The DEEP2 inverse model trained on simulated beads data was used in the reconstruction. a DEEP-TFM image stack averaged over the 32 patterns. b DEEP2 reconstruction corresponding to (a). c Ground truth image corresponding to (a), generated by imaging in the absence of intralipid. df The red colored box on (ac) images are enlarged for close visualization. gi. The normalized intensity along the yellow lines G, H, and I in (df) are visualized in (gi) plots. DEEP2 reconstruction and ground truth are registered for visualization purposes
Fig. 6
Fig. 6. Experimental DEEP2 test results on mouse cortical vasculature structures at 2 and 4 scattering lengths (SLS) below the surface.
The cortical vasculature of anesthetized mice with a cranial window was imaged using the DEEP-TFM microscope. The DEEP2 inverse model trained on simulated cortical vasculature data was used in the reconstruction. a, g, m, s Four representative instances of DEEP-TFM image stacks averaged over the 32 patterns. b, h, n, t DEEP2 reconstruction corresponding to (a), (g), (m), and (s)—with 32 patterned excitations. c, i, o, u Conventional DEEP reconstructions with regularization corresponding to (a), (g), (m), and (s)—with 256 patterned excitations. d, j, p, v Conventional DEEP reconstructions with regularization corresponding to (a), (g), (m), and (s)—with 32 patterned excitations. e, k, q, w Conventional DEEP reconstructions without regularization corresponding to (a), (g), (m) and (s)—with 256 patterned excitations. f, l, r, x Conventional DEEP reconstruction without regularization corresponding to (a), (g), (m) and (s)—with 32 patterns
Fig. 7
Fig. 7. Visualization of the physics-informed forward model.
a The forward model equation. b A representative simulation of the forward model for a 3D beads specimen. Note that the different sections of the equation in (a) are shown in color-coded bars on the equation in (b)
Fig. 8
Fig. 8. A simulation from the physics-informed forward model.
a1–2 The xy and xz views of the excitation PSF. b1–2 The xy and xz views of the emission PSF. c1 Illustration of the light scattering process in a scattering tissue used to model the scattering point spread function (sPSF). c2 The scattering point spread function at a two-scattering-length depth. c3 The scattering point spread function at a seven-scattering-length depth. d1 A synthetic beads object (the maximum intensity projection over the z-axis). d2 The simulated DEEP-TFM image of the object in (d1) 7 scattering lengths below the surface (before detection on the camera). Note that the maximum photon count in the image is close to 5 photons. d3 The simulated DEEP-TFM image in (d2) detected on the simulated EMCCD camera. The scale bars in (a2), (b2), (c2), and (c3) are 5 μm. The scale bar in (d3) is 20 μm
Fig. 9
Fig. 9. The deep-learning-based inverse model architecture.
UNet with concurrent channel and spatial attention mechanism employed in the proposed DEEP2 inverse model

Similar articles

Cited by

References

    1. Rocheleau JV, Piston DW. Two-photon excitation microscopy for the study of living cells and tissues. Curr. Protoc. Cell Biol. 2003;20:4.11.1–4.11.15. doi: 10.1002/0471143030.cb0411s20. - DOI - PubMed
    1. Yildirim M, et al. Functional imaging of visual cortical layers and subplate in awake mice with optimized three-photon microscopy. Nat. Commun. 2019;10:77. doi: 10.1038/s41467-018-08179-6. - DOI - PMC - PubMed
    1. Yildirim M, et al. Label-free three-photon imaging of intact human cerebral organoids for tracking early events in brain development and deficits in Rett syndrome. eLife. 2022;11:e78079. doi: 10.7554/eLife.78079. - DOI - PMC - PubMed
    1. Benninger RKP, Piston DW. Two-photon excitation microscopy for the study of living cells and tissues. Curr. Protoc. Cell Biol. 2013;59:4.11.1–4.11.24. doi: 10.1002/0471143030.cb0411s59. - DOI - PMC - PubMed
    1. Oron D, Tal E, Silberberg Y. Scanningless depth-resolved microscopy. Opt. Express. 2005;13:1468–1476. doi: 10.1364/OPEX.13.001468. - DOI - PubMed