. 2023 Sep 13;14(1):5665.
doi: 10.1038/s41467-023-40841-6.

MYC Deregulation and PTEN Loss Model Tumor and Stromal Heterogeneity of Aggressive Triple-Negative Breast Cancer

Affiliations

MYC Deregulation and PTEN Loss Model Tumor and Stromal Heterogeneity of Aggressive Triple-Negative Breast Cancer

Zinab O Doha et al. Nat Commun. .

Abstract

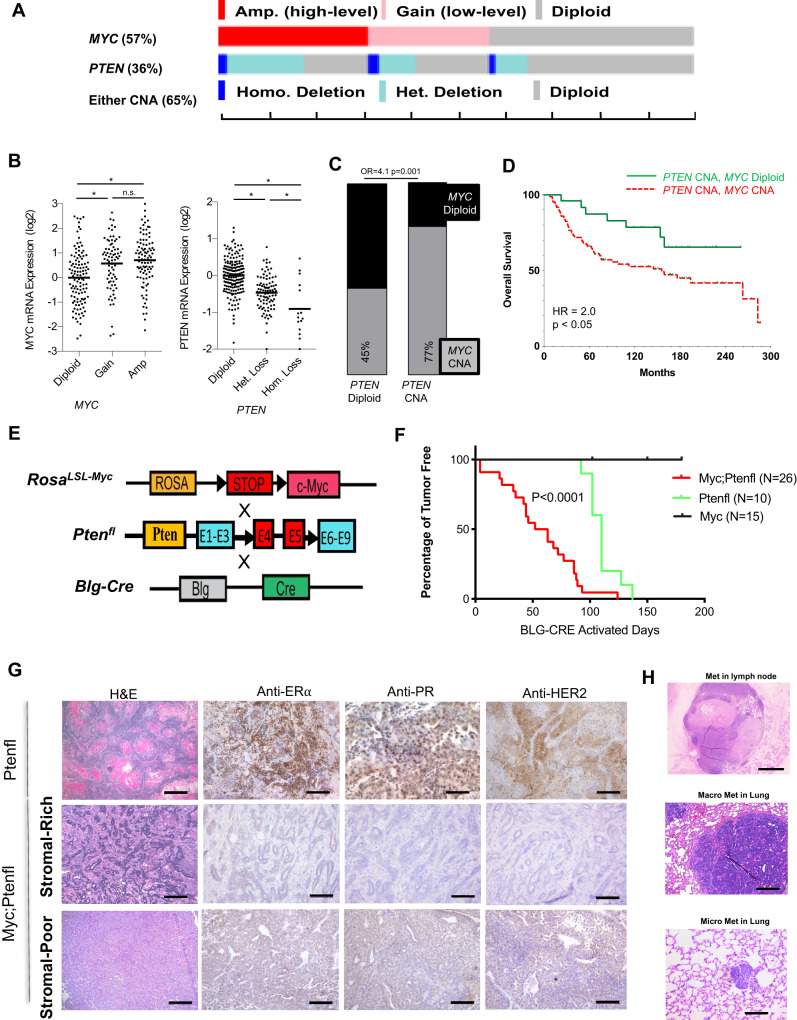
Triple-negative breast cancer (TNBC) patients have a poor prognosis and few treatment options. Mouse models of TNBC are important for development of new therapies, however, few mouse models represent the complexity of TNBC. Here, we develop a female TNBC murine model by mimicking two common TNBC mutations with high co-occurrence: amplification of the oncogene MYC and deletion of the tumor suppressor PTEN. This Myc;Ptenfl model develops heterogeneous triple-negative mammary tumors that display histological and molecular features commonly found in human TNBC. Our research involves deep molecular and spatial analyses on Myc;Ptenfl tumors including bulk and single-cell RNA-sequencing, and multiplex tissue-imaging. Through comparison with human TNBC, we demonstrate that this genetic mouse model develops mammary tumors with differential survival and therapeutic responses that closely resemble the inter- and intra-tumoral and microenvironmental heterogeneity of human TNBC, providing a pre-clinical tool for assessing the spectrum of patient TNBC biology and drug response.


Conflict of interest statement

Declaration of interests: Rosalie C. Sears: Consultant: Novartis Pharmaceutical, Larkspur Biosciences. Scientific Advisory Board: RAPPTA Therapeutics. Sponsored Research Support: Cardiff Oncology, Astra Zeneca Partner of Choice grant award. Gordon Mills: SAB/Consultant: Amphista, Astex, AstraZeneca, BlueDot, Chrysallis Biotechnology, Ellipses Pharma, ImmunoMET, Infinity, Ionis, Leapfrog Bio, Lilly, Medacorp, Nanostring, Nuvectis, PDX Pharmaceuticals, Qureator, Roche, Signalchem Lifesciences, Tarveda, Turbine, Zentalis Pharmaceuticals. Stock/Options/Financial: Bluedot, Catena Pharmaceuticals, ImmunoMet, Nuvectis, SignalChem, Tarveda, Turbine, Licensed Technology, HRD assay to Myriad Genetics, DSP patents with Nanostring. Sponsored research: AstraZeneca, Nanostring Center of Excellence, Ionis (Provision of tool compounds. The title and ID number for patents; Nanostring Simultaneous quantification of gene expression in a user-defined region of 10,640,816 a cross-sectioned tissue, Simultaneous quantification of a plurality of proteins in a user-defined region of 10,501,777 a cross-sectioned tissue, Myriad Methods and materials for assessing loss of heterozygosity 10,612,098. Lisa M. Coussens reports consulting services for Cell Signaling Technologies, AbbVie, the Susan G Komen Foundation, and Shasqi, received reagent and/or research support from Cell Signaling Technologies, Syndax Pharmaceuticals, ZelBio Inc., Hibercell Inc., and Acerta Pharma, and has participated in advisory boards for Pharmacyclics, Syndax, Carisma, Verseau, CytomX, Kineta, Hibercell, Cell Signaling Technologies, Alkermes, Zymeworks, Genenta Sciences, Pio Therapeutics Pty Ltd., PDX Pharmaceuticals, the AstraZeneca Partner of Choice Network, the Lustgarten Foundation, and the NIH/NCI-Frederick National Laboratory Advisory Committee. The remaining authors declare no competing interests.

Figures

Fig. 1
Fig. 1. Deregulated Myc combination with delated Pten in mammary gland accelerates triple-negative mammary tumorigenesis.
A Copy number alteration (CNA) in MYC showing amplification or gain and PTEN showing shallow or deep deletion and B mRNA expression of MYC and PTEN in 309 ER−/HER2− patients from 2500 breast cancer patients—METABRIC Data (* represent significant two-tailed p value < 0.05, n.s represent a non-significant p value). C Total 101 PTEN deletion in 309 ER-/HER2- patients with 77% MYC amplification or gain; the rest, 198 ER-/HER2- PTEN diploid patients, with 45% MYC amplification or gain, (two-tailed p value = 0.001). D Survival in 101 ER−/HER2− patients from METABRIC Data with PTEN loss and with (red dotted line) or without (green line) MYC amplification or gain (p value = 0.0187 using Gehan–Breslow–Wilcoxon test). E Diagram for generation of Myc;Ptenfl (Rosa;LSL-Myc/LSL-MycPten;fl/flBlg-Cre) mice by breeding the RosaLSL-Myc/LSL-Myc conditional knockin and Ptenfl/fl conditional knock-out mice with Blg-Cre transgenic mice. F Mammary gland tumor incidence from Myc (Rosa;LSL-Myc/LSL-MycBlg-Cre), Ptenfl (Pten;fl/flBlg-Cre) and Myc;Ptenfl mice post-breeding and lactation for Blg-Cre activation (p value = 0.00001 using Gehan–Breslow–Wilcoxon test). Myc;Ptenfl (N = 26), Ptenfl (N = 10), and Myc (N = 15). G H&E staining for Myc;Ptenfl tumors, and Immunohistochemistry staining with anti-PR, anti-HER2, and Anti-estrogen receptor a (ERa). Representative images of 27 mammary gland tumors from Myc;Ptenfl mice and 10 tumors from Ptenfl mice. Scale bar = 100 µm. H Representative H&E staining for macro lymph node and lung metastases and micro lung metastasis from 38 Myc;Ptenfl mice and 19 Ptenfl mice. Metastasis rates: Ptenfl: 3/19 = 16%. Myc;Ptenfl stromal-rich: Macro 9/23 = 39%; Micro 3/23 = 13%. Myc;Ptenfl stromal-poor: Macro 5/15 = 33.3%; Micro 4/15 = 26.7%. Scale bars = 1 mm (Top), 200 µm (middle), 100 µm (bottom).
Fig. 2
Fig. 2. Multiple molecular and histologic subtypes are present in Myc;Ptenfl tumors with human TNBC subtype-specific transcriptomic signatures.
A Unsupervised hierarchical clustering of RNA expression from 13 Myc;Ptenfl mammary gland tumors and 3 normal mammary glands. Tumor clusters and histologies indicated. B Histology of tumors from A in cluster 1-solid (reproduce and represent 28 mice bearing tumor) and cluster 2 (reproduce and represent a total of 95 mice bearing tumor; 18 squamous, 3 Metaplastic, and 74 lobular features). Scale bars = 200 µm. C Pie chart of an extended histological analysis of 123 tumors from Myc;Ptenfl mice indicating the frequency of histological subtypes. D Principal Component Analysis of RNAseq from 13 Myc;Ptenfl tumors; SR (blue), SP (red). Axes scaled by the proportion of variance (PC value divided by the proportion of variance for that principal component). E Gene expression heatmap for top 1000 variable genes (genes used for PCA), color-coded to indicate positive or negative weight for PC1. Gene expression is computed as counts with VST normalization and then z-scored across samples. F Days from the end of pregnancy/lactation, when Blg-Cre activated, to detection of mammary gland tumor in Myc;Ptenfl mice. Tumor histology group stromal-rich and stromal-poor indicated. Stromal-Poor (red, N = 15), Stromal-Rich (blue, N = 14), and Myc-Blg (black, N = 15). G Survival after tumor detection for stromal-rich tumor-bearing mice vs. the mice with stromal-poor tumors. Stromal-Poor (SP) (red, N = 6) and Stromal-Rich (SR) (blue, N = 5). H Tumor volume during Paclitaxel treatment (10 mg/kg); Stromal-Poor (red, N = 4) and Stromal-Rich (blue, N = 11), or vehicle-treated controls; Stromal-Poor (dark red, N = 5) and Stromal-Rich (dark blue, N = 14), Data are presented as mean values ± SD. FH using Gehan–Breslow–Wilcoxon test. I Bar plot to visualize the significantly enriched (Adjusted p value < 0.05) MSigDB hallmarks for SR vs. SP differentially expressed genes. The x-axis is the normalized enrichment score, and y-axis shows the enriched hallmark geneset (Source data are provided as a Source Data file). J Spearman correlation of MycPten;fl tumors to human TNBC subtype centroids. Centroid signatures filtered to 60 homologous genes mapped between mouse and human transcriptomes (60/77 = 78%) to identify the similarity of MycPten;fl subtypes to four prognostically-distinct human TNBC subtypes; basal-like immune-activated (BLIA), basal-like immunosuppressed (BLIS), luminal androgen receptor (LAR), and mesenchymal (MES). K Gene expression heatmap for seven chemotactic cytokines associated with prognosis in human breast cancer. Gene expression is computed as counts with VST normalization and then z-scored across samples.
Fig. 3
Fig. 3. Immune contexture across Myc;Ptenfl subtypes.
A Example of multiplex immunohistochemistry (mIHC) images from Myc;Ptenfl Stromal-rich (n = 21) and Stromal-poor tumors (n = 13) with Myeloid markers expression on the expression of the left and lymphoid marker on the right. Scale bars = 100 µm. B Total immune cells by CD45+ density in Stromal-rich tumor (n = 21 biologically independent samples) periphery, border, and core compared to Stromal-poor tumors (n = 13 biologically independent samples). Left graph; box-and-whisker plots show median and interquartile range (* represent significant p value < 0.05 using two-way ANOVA (mixed model)), the centerline of the boxplots represents the median value (50th percentile), and the box encapsulates the range from the 25th to the 75th percentiles of the dataset. The whiskers extend from the minimum to the maximum values, showcasing the full spread of the data. Middle image; Tumor border was determined by CD45 and PANCK expression (supplemental S4A and B. Scale bars = 100,000 µm). On the right, unsupervised clustering; heatmap color computed as the z-score of log10 normalized celltype density (cells/mm2) in each periphery, border, and core of Myc;Ptenfl tumor subtypes. C Sankey diagrams showing the distribution of each immune lineage population in stromal-rich (left) and stromal-poor (right) tumors; periphery, border, and core.
Fig. 4
Fig. 4. Analysis of shared morphologies between human breast cancer and Myc;Ptenfl tumor TMAs.
A Pipeline for generating morphological feature representation using a variational autoencoder (VAE). Tiles from both mice and human TMAs are used to train a VAE, then a latent encoding vector is computed for each tile. Tiles are compared using UMAP embedding and k-means clustering analysis of the latent features. B Density functions for all human and mouse tumor tiles are calculated within the two-dimensional UMAP space to visually compare overlap in embedding space (corresponding histopathological feature image is shown in Supplemental Fig. S5A). C K-means clusters (n = 8) are computed using latent features and projected into UMAP space for visualization. Clusters consisting primarily of edge artifacts were excluded from the analysis. D For every cluster, the nine tiles closest to the cluster center (left) and a single high-resolution tile image within each cluster (right, a representation of the nine tiles clusters. Scale bar = 22 µm) are shown to illustrate each cluster dominant morphology; main histologic features of each center: [a] carcinoma with discohesive growth pattern; [b] carcinoma with thin fibrotic septa and hyperchromatic nuclei; [c] stroma or coagulative necrosis; [d] IDC with high-grade nuclear feature; [e] inflammatory cell infiltration in the stroma; [f] fibrotic stroma, scattered single tumor cells; [g] sarcomatoid change of tumor cells and inflammatory cell infiltration; and [h] tumor with hyperchromatic and coarse chromatin with frequent atypical mitosis (The figure includes 92 mice TMA cores, representative of 80 mice, and 172 human TMA cores, corresponding to 172 patients). E Relative abundance of human and mouse tumor tiles is calculated for each cluster using the ratio of tiles in a cluster to total tiles from the given TMA source.
Fig. 5
Fig. 5. Tumor and microenvironment cell phenotype comparisons between Myc;Ptenfl tumors and human TNBC.
A Cyclic immunofluorescence (CyCIF) staining of representative Myc;Ptenfl tissue microarray (TMA) cores (1.5 mm diameter) of stromal-rich (left, reproduced n = 59) and stromal-poor (right, reproduced n = 10) histology subtypes with the indicated markers. Scale bar = 130 µm. B Cell type calling defined by gating on cores in (A). C Hierarchical clustering of Myc;Ptenfl tumor samples based on cell type frequency in each tumor core. D Hierarchical clustering of human TNBC samples based on cell type frequency in each region of interest in TNBC tumors imaged with multiplex ion-beam imaging (MIBI). E Mean frequency of cell types in cell frequency-based subtypes in Myc;Ptenfl (top) and human TNBC (bottom) samples. CE. Heat map row colors: stromal-poor (SP, orange), stromal-rich-immune-rich (SR_IR, blue), and stromal-rich-immune-poor (SR_IP, green) subtypes. F Kaplan–Meier curves of overall survival in cell frequency-based subtypes in human TNBC MIBI data. Log-rank p = 0.021, n = 38 patients, vertical ticks are censored patients. G Stromal expression of pan-immune (CD45), Treg (FoxP3), dendritic (CD11c), endothelial (CD31), and proliferation (Ki67) markers in mouse 3-class subtypes. H Epithelial expression of mesenchymal (Vim), epithelial (EpCAM, Ecad), proliferation, and nuclear eccentricity markers in mouse subtypes. I Stromal expression of pan-immune, Treg, dendritic, endothelial, and proliferation markers in human subtypes. J Epithelial expression of mesenchymal (Vimentin) and proliferation markers in human subtypes. GJ P-values are determined by the Kruskal–Wallis H test; the centerline of the boxplots represents the median value (50th percentile), and the box encapsulates the interquartile range. The whiskers extend to show the rest of the distribution, except for outliers defined as 1.5 times the interquartile range. Dots overlaid on boxplots show individual cores’ mean; N = 70 mouse TMA cores (G, H, K) and 40 human patients (I, J). K Epithelial expression of basal/myoepithelial markers (CK5, alpha-SMA) and phospho-MYC in mouse histological subtypes. P-values determined by Mann–Whitney U test. the centerline of the boxplots represents the median value (50th percentile), and the box encapsulates the interquartile range. The whiskers extend to show the rest of the distribution, except for outliers defined as 1.5 times the interquartile range. Stromal-rich (n = 59) and stromal-poor (n = 10). L Mean marker intensity in each annotated cell type defined by unsupervised Leiden clustering in Myc;Ptenfl tissues. M Hierarchical clustering of mouse samples based on detailed cell types. Heat map column colors: stromal-poor (SP, orange), stromal-rich-immune-rich (SR_IR, blue), and stromal-rich-immune-poor (SR_IP, green). N Bar plot of the frequency of each cell type in mouse subtypes.
Fig. 6
Fig. 6. Myc;Ptenfl subtypes show distinct cell types and cluster gene enrichments.
A UMAP showing scRNA-seq data from Myc;Ptenfl model. Color-coded by either lineage or unsupervised cluster. UMAP was computed on 50 iNMF factors. Lineage was manually assigned using canonical cell type markers (Source Data) for unsupervised clusters. Unsupervised clusters were identified using the Leiden algorithm to the same 50 iNMF factors (Resolution = 0.45, optimized for silhouette width, Supplemental Fig. S13B). B Bar-plot is showing the relative fraction of each tumor assigned to each cell lineage. Stromal-Rich (SR) and Stromal-Poor (SP) subtypes were based on initial two-class histology assigned by a pathologist and cell type fractions, which were further divided into Stromal-Rich-Immune-Rich (SR-IR) and Stromal-Rich-Immune-Poor (SR-IP). C Relative abundance of cell type clusters for each Myc;Ptenfl tumor subtype. Mean frequency is the arithmetic mean across all tumors within that subtype, and error bars represent SEM. D UMAP visualizations of individual lineages. UMAPs and clustering were computed using the same 50 factors as global analysis (Fig. 6A, Supplemental Fig. S13C). E Heatmap showing the top 10 uniquely upregulated genes for each epithelial cluster (min.pct = 0.1, avg_log2FC > 0.5, Bonferroni corrected p ≦ 0.05). F Enrichment maps showing the top 30 enriched ontologies for each epithelial cluster visualized as a network. The size of the point indicates the number of genes within the ontology that were uniquely upregulated in that cluster. Edges connect any ontologies with a Jaccard similarity greater than 0.2 and edge width scaled to Jaccard similarity. G Heatmap showing the top 10 uniquely upregulated genes for each fibroblast cluster (min.pct = 0.1, avg_log2FC > 0.5, Bonferroni corrected p ≦ 0.05). H Enrichment maps showing the top 30 enriched ontologies for each fibroblast cluster visualized as a network. The size of the point indicates the number of genes within the ontology that were uniquely upregulated in that cluster. Edges connect any ontologies with a Jaccard similarity greater than 0.2 and edge width scaled to Jaccard similarity.
Fig. 7
Fig. 7. Integration of TNBC mouse model with human breast cancer scRNA-seq.
A Schematic showing classifier and UINMF integration. B Heatmap visualizing the relationship between Myc;Ptenfl unsupervised clusters and classifier assignment from a mixture discriminant analysis-based classifier built with scPred from human primary breast cancer scRNA-seq. Counts were row-normalized to represent the fraction of each unsupervised cluster assigned to each human cell type class. C Mean UINMF embedding for each cell type found in the Myc;Ptenfl or human scRNA-seq as assigned by Wu et al. D Original cell type identity versus integrated unsupervised cluster assignment. Counts were row normalized and represented the proportion of each species-specific cell state that was assigned to each cross-species unsupervised cluster. E UMAP of UINMF integrated Myc;Ptenfl, and human scRNA-seq data. UMAP was computed from 50 UINMF factors. Lineage was assigned during the initial analysis of Myc;Ptenfl data (Supplemental Fig. 13C) (Source Data) or based on Wu et al. celltype_major classification. F Unsupervised clusters of cross-species integrated data computed with the Louvain algorithm from 50 UINMF factors (Supplemental Fig. S15A–C) Note: Point size is increased for mouse umap.

References

    1. Fallahpour S, et al. Breast cancer survival by molecular subtype: a population-based analysis of cancer registry data. CMAJ Open. 2017;5:E734–E739. - PMC - PubMed
    1. Dent R, et al. Triple-negative breast cancer: clinical features and patterns of recurrence. Clin. Cancer Res. 2007;13:4429. doi: 10.1158/1078-0432.CCR-06-3045. - DOI - PubMed
    1. Tan, A. R. & Swain, S. M. Therapeutic strategies for triple-negative breast cancer. Cancer J.14, 343–351 (2008). - PubMed
    1. Kaplan HG, Malmgren JA, Atwood M. T1N0 triple negative breast cancer: risk of recurrence and adjuvant chemotherapy. Breast J. 2009;15:454–460. - PubMed
    1. Won KA, Spruck C. Triple‑negative breast cancer therapy: current and future perspectives (Review) Int. J. Oncol. 2020;57:1245–1261. - PMC - PubMed

Publication types