. 2023 Sep;621(7979):550-557.
doi: 10.1038/s41586-023-06418-5. Epub 2023 Sep 13.

Early-childhood linear growth faltering in low- and middle-income countries

Collaborators, Affiliations

Early-childhood linear growth faltering in low- and middle-income countries

Jade Benjamin-Chung et al. Nature. 2023 Sep.

Erratum in

  • Author Correction: Early-childhood linear growth faltering in low- and middle-income countries.
    Benjamin-Chung J, Mertens A, Colford JM Jr, Hubbard AE, van der Laan MJ, Coyle J, Sofrygin O, Cai W, Nguyen A, Pokpongkiat NN, Djajadi S, Seth A, Jilek W, Jung E, Chung EO, Rosete S, Hejazi N, Malenica I, Li H, Hafen R, Subramoney V, Häggström J, Norman T, Brown KH, Christian P, Arnold BF; Ki Child Growth Consortium. Benjamin-Chung J, et al. Nature. 2023 Nov;623(7985):E2. doi: 10.1038/s41586-023-06703-3. Nature. 2023. PMID: 37833392 Free PMC article. No abstract available.
  • Author Correction: Early-childhood linear growth faltering in low- and middle-income countries.
    Benjamin-Chung J, Mertens A, Colford JM Jr, Hubbard AE, van der Laan MJ, Coyle J, Sofrygin O, Cai W, Nguyen A, Pokpongkiat NN, Djajadi S, Seth A, Jilek W, Jung E, Chung EO, Rosete S, Hejazi N, Malenica I, Li H, Hafen R, Subramoney V, Häggström J, Norman T, Brown KH, Christian P, Arnold BF; Ki Child Growth Consortium. Benjamin-Chung J, et al. Nature. 2025 Jan;637(8045):E18. doi: 10.1038/s41586-024-08344-6. Nature. 2025. PMID: 39668242 Free PMC article. No abstract available.

Abstract

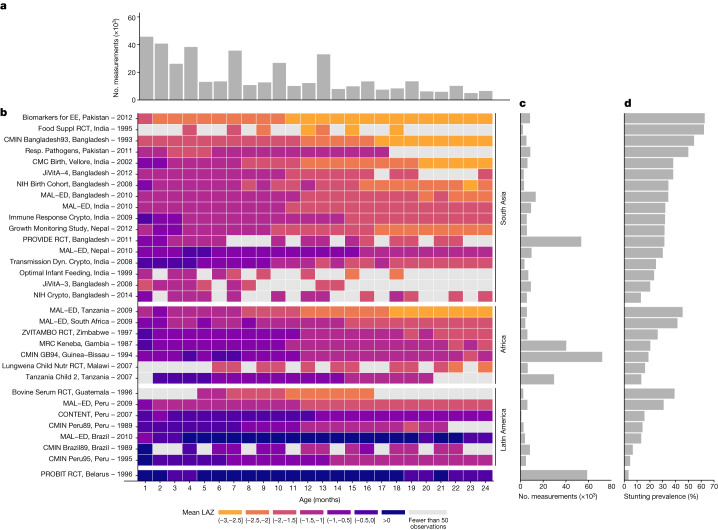
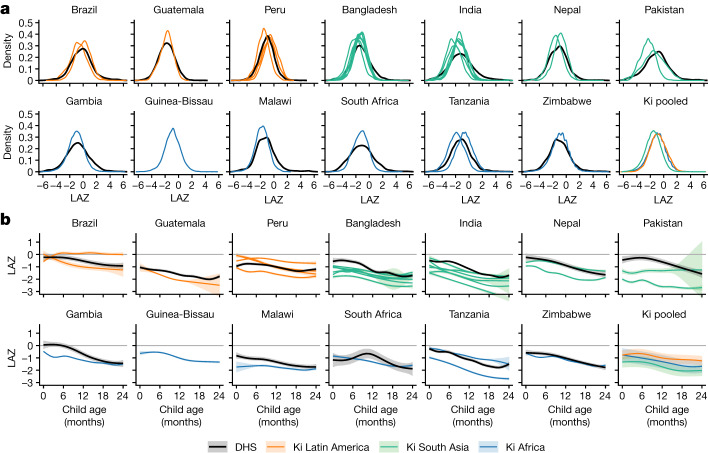
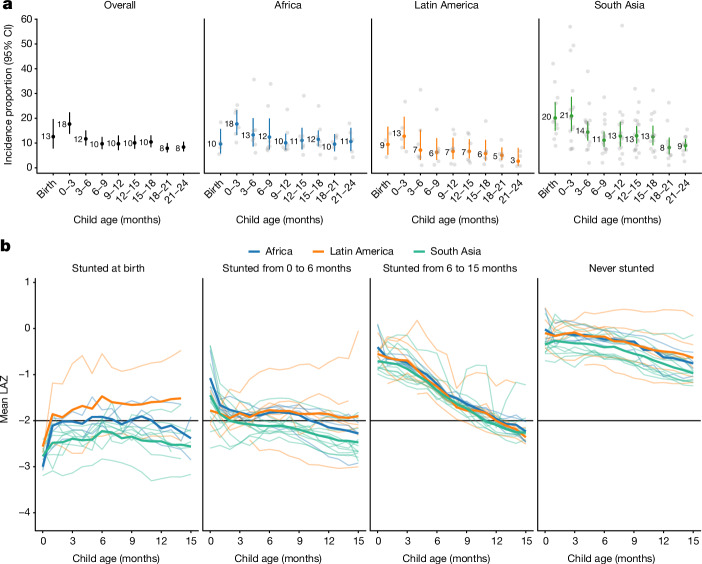
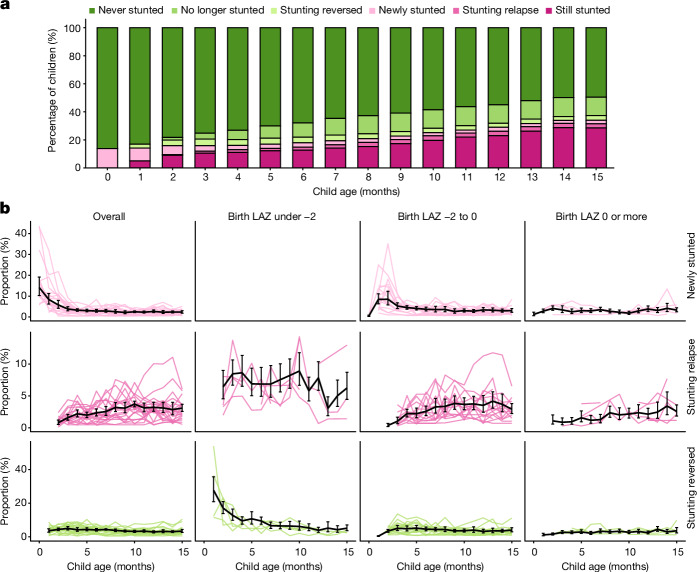
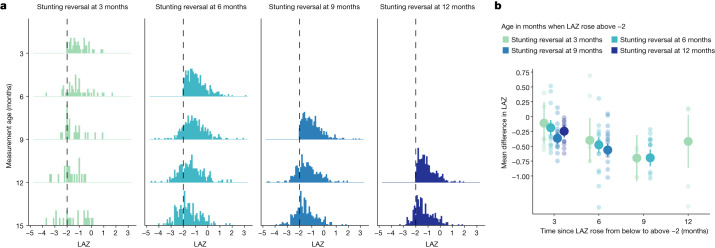
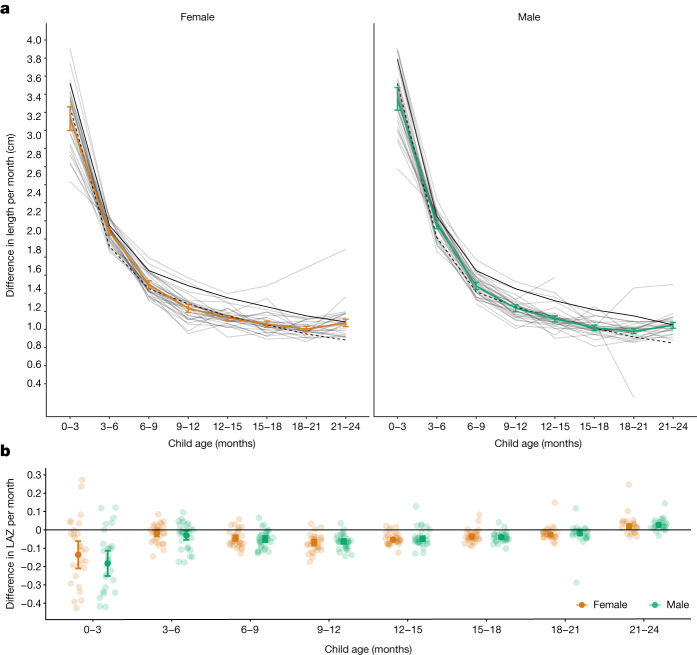
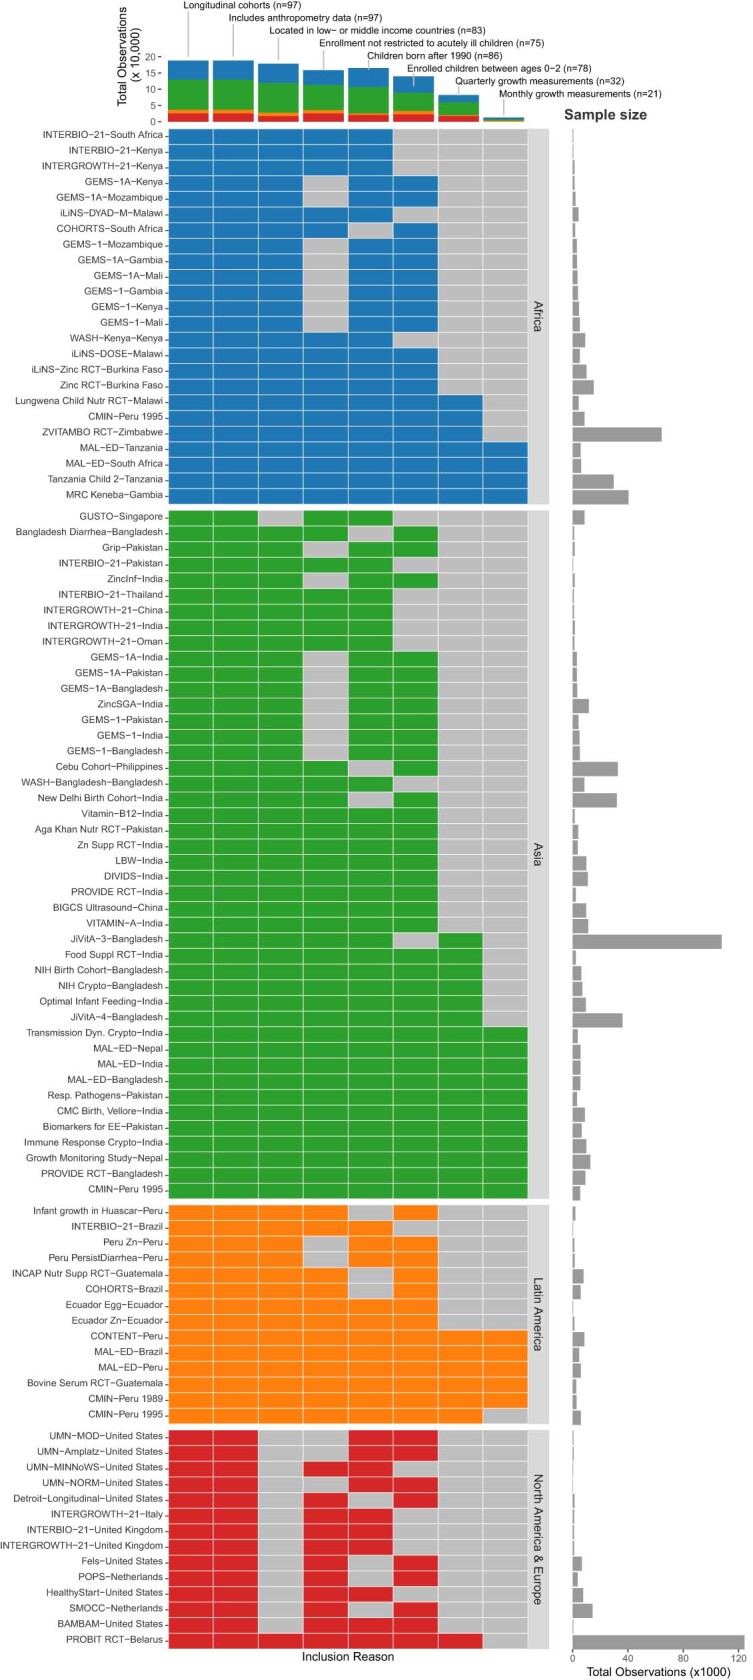
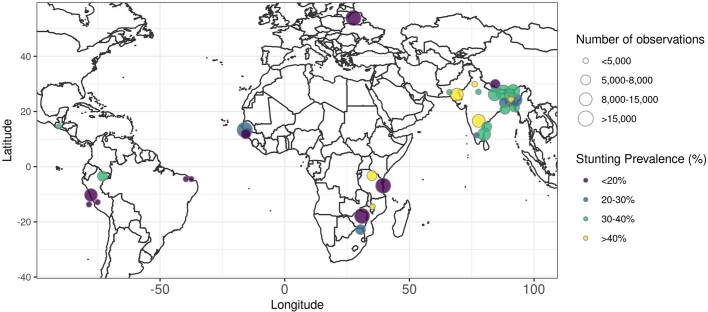
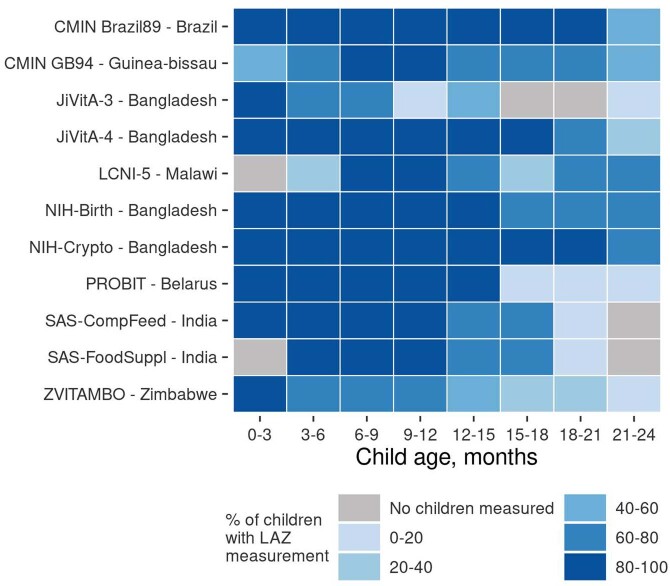
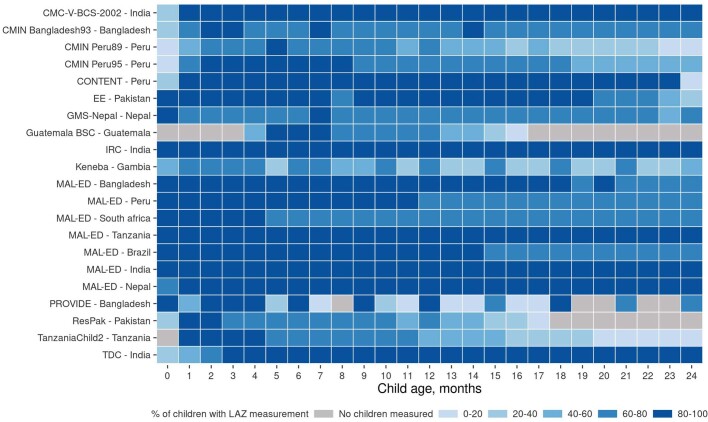
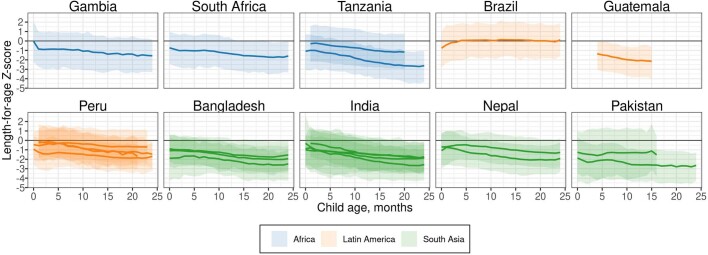
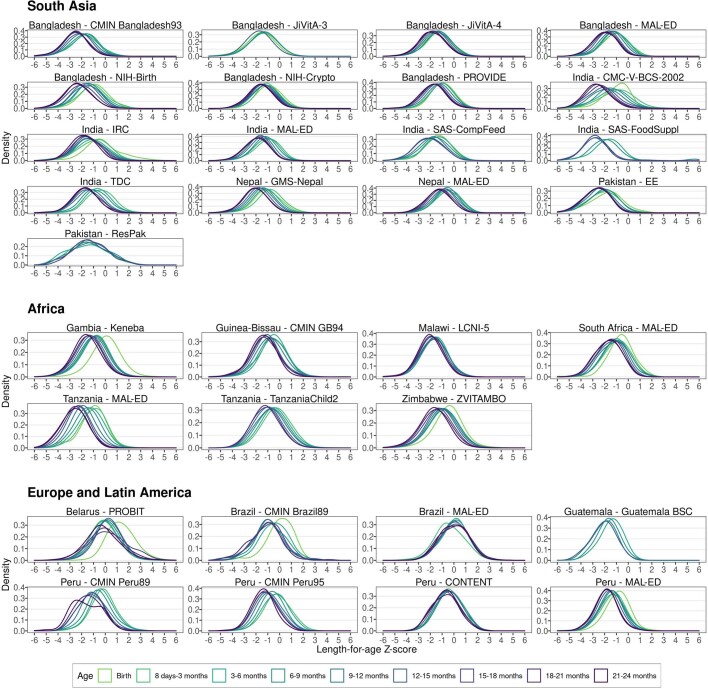
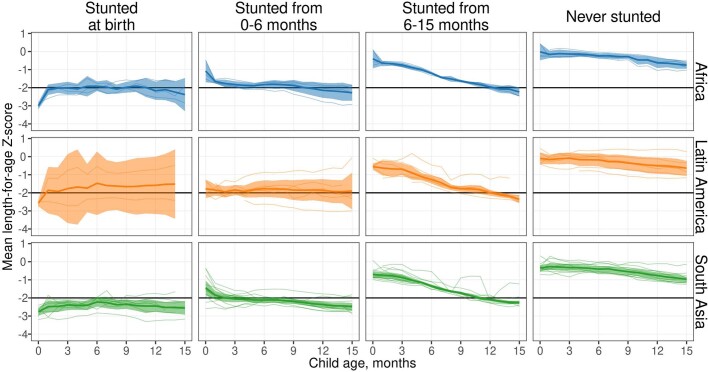
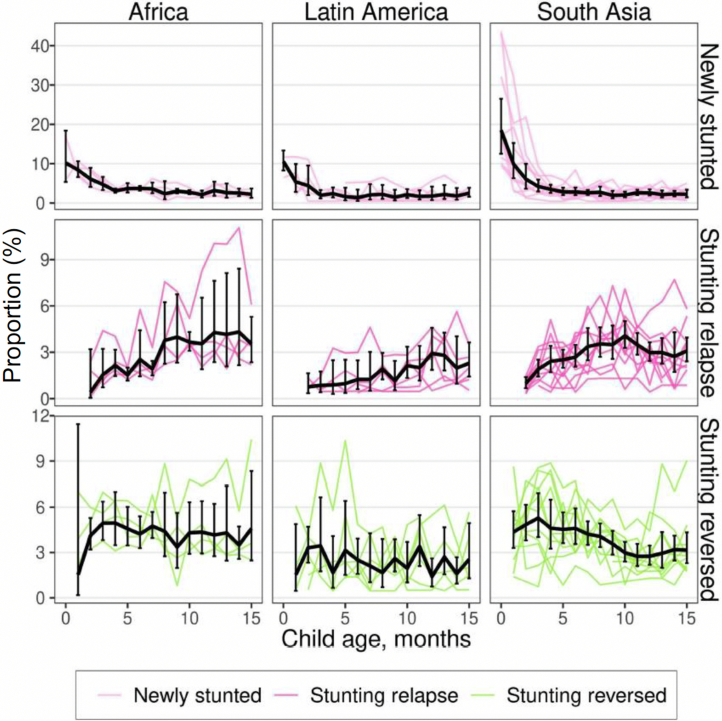
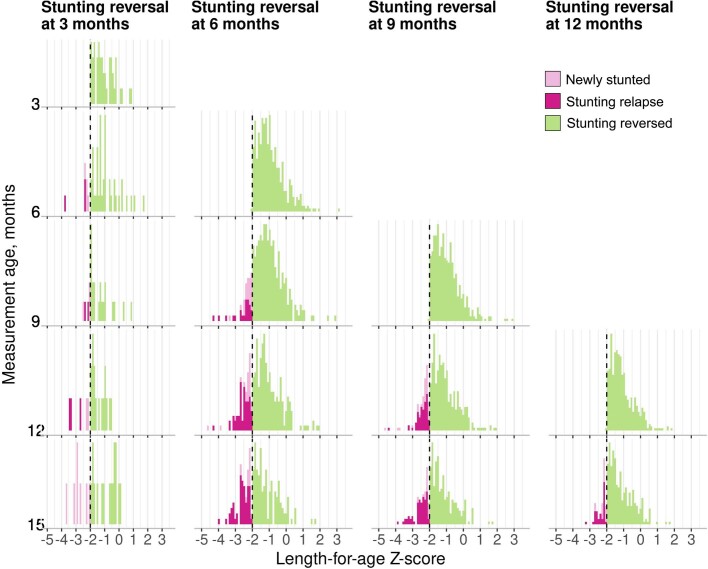
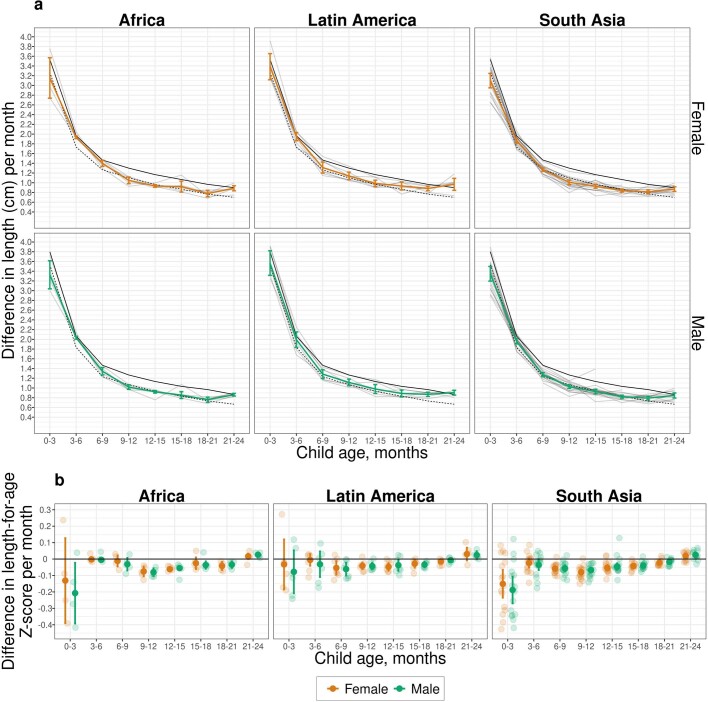
Globally, 149 million children under 5 years of age are estimated to be stunted (length more than 2 standard deviations below international growth standards)1,2. Stunting, a form of linear growth faltering, increases the risk of illness, impaired cognitive development and mortality. Global stunting estimates rely on cross-sectional surveys, which cannot provide direct information about the timing of onset or persistence of growth faltering-a key consideration for defining critical windows to deliver preventive interventions. Here we completed a pooled analysis of longitudinal studies in low- and middle-income countries (n = 32 cohorts, 52,640 children, ages 0-24 months), allowing us to identify the typical age of onset of linear growth faltering and to investigate recurrent faltering in early life. The highest incidence of stunting onset occurred from birth to the age of 3 months, with substantially higher stunting at birth in South Asia. From 0 to 15 months, stunting reversal was rare; children who reversed their stunting status frequently relapsed, and relapse rates were substantially higher among children born stunted. Early onset and low reversal rates suggest that improving children's linear growth will require life course interventions for women of childbearing age and a greater emphasis on interventions for children under 6 months of age.


Conflict of interest statement

T.N. is an employee of the Bill & Melinda Gates Foundation. P.C. is a former employee of the Bill & Melinda Gates Foundation, and K.H.B. is a former employee of and occasional consultant to the Bill & Melinda Gates Foundation. J.C., V.S., R. Hafen and J.H. work as research contractors financially supported by the Bill & Melinda Gates Foundation.

Figures

Fig. 1
Fig. 1. Summaries of included Ki cohorts.
a, Number of observations (thousands) by age in months. b, Mean LAZ by age in months for each cohort. Cohorts are sorted by geographic region and mean LAZ. c, Number of observations contributed by each cohort. d, Overall stunting prevalence in each cohort, defined as proportion of measurements with LAZ < –2.
Fig. 2
Fig. 2. LAZs by age and region.
a, Kernel density distributions of LAZ in DHS countries that overlap with Ki cohorts (black lines) and in each Ki cohort (coloured lines). b, Mean LAZs by age for DHS countries overlapping with Ki cohorts (black lines) and pooled across Ki longitudinal cohorts with at least quarterly measurement (coloured lines) estimated with cubic splines. Shaded bands are approximate 95% simultaneous confidence intervals. The DHS survey was not conducted in Guinea-Bissau during the study period. Each panel includes n = 125,046 children from DHS data and n = 52,640 children from Ki cohorts.
Fig. 3
Fig. 3. Incidence of stunting and mean LAZ by age and region.
a, Proportion of children experiencing incident stunting onset overall (n = 19–32 studies; n = 11,929–42,902 children) and stratified by region (Africa: n = 4–8 studies, n = 5,529–15,837 children; Latin America: n = 3–7 studies, n = 413–1,528 children; South Asia n = 11–17 studies, n = 4,514–17,802 children). ‘0–3’ includes the age of 2 days up to 3 months. Analyses include cohorts with at least quarterly measurements; vertical bars indicate 95% confidence intervals. Grey points indicate cohort-specific estimates. The median I2 statistic measuring heterogeneity in each meta-analysis was 95 (interquartile range (IQR) = 77–98) overall, 85 (IQR = 83–97) in Africa, 67 (IQR = 45–87) in Latin America and 91 (IQR = 79–96) in South Asia. b, Mean LAZ stratified by age of incident stunting from birth to the age of 15 months (n = 21 cohorts that measured children at least monthly between birth and the age of 15 months, n = 11,243 children). Horizontal black lines indicate stunting the cutoff of −2 LAZ. ‘Never stunted’ includes children who did not become stunted by the age of 15 months. Pooled results were derived from random-effects models with restricted maximum-likelihood estimation. Thinner lines indicate cohort-specific estimates. The median I2 statistic measuring heterogeneity in each meta-analysis was 91 (IQR = 83–96) overall, 85 (IQR = 63–94) in Africa, 94 (IQR = 88–96) in Latin America and 85 (IQR = 78–92) in South Asia. Extended Data Fig. 11 contains pooled means from b with 95% confidence intervals.
Fig. 4
Fig. 4. Stunting reversal and relapse.
a, Percentage of children with stunting reversal and relapse by age. b, Proportion of new stunting, stunting relapse and stunting reversal by age and birth LAZ, defined as the first LAZ measurement before the age of 30 days. The black line presents estimates pooled using random effects with restricted maximum-likelihood estimation (n = 168 models); in 11 models, alternative pooling methods were used because the restricted maximum-likelihood estimator did not converge (fixed-effects n = 8 models; maximum-likelihood n = 3 models). Coloured lines indicate cohort-specific estimates. In the panel for birth LAZ under −2 and newly stunted children, no data are shown because all children were stunted at birth by definition. Vertical black error bars indicate 95% confidence intervals. The number of children ranged from 1,831 to 9,965 in the panels for birth LAZ under −2, 34,427 to 43,753 in the panels for birth LAZ = −2 to 0, and 10,450 to 14,862 in the panels for birth LAZ 0 or more. The median I2 statistic measuring heterogeneity in each meta-analysis was 55 (IQR = 47–70). Extended Data Fig. 12 presents similar estimates stratified by geographic region. Both panels include data from 21 cohorts in 10 countries with at least monthly measurement (n = 11,435). Both panels contain data up to the age of 15 months because in most cohorts, measurements were less frequent above the age of 15 months.
Fig. 5
Fig. 5. Subsequent LAZ among children with stunting reversal at different ages.
a, Distribution of LAZ at subsequent measurements among children who experienced stunting reversal at the ages of 3, 6, 9 and 12 months. Vertical black dashed lines indicate stunting the cutoff of −2 LAZ. b, Mean difference in LAZ following stunting reversal at each subsequent age of measurement by age of reversal. Smaller, partially transparent points indicate cohort-specific estimates. Estimates include data from 21 cohorts in 10 countries with at least monthly measurement (n = 11,271). Vertical bars indicate 95% confidence intervals. All panels contain data up to the age of 15 months because in most cohorts, measurements were less frequent above the age of 15 months.
Fig. 6
Fig. 6. Linear growth velocity by age and sex.
a, Within-child difference in length in centimetres per month stratified by age among male (green line) and female (orange line) children; 25th percentile of the WHO growth velocity standards (dashed black lines); and the 50th percentile (solid black line). Light grey lines indicate cohort-specific linear growth velocity curves. The median I2 statistic measuring heterogeneity in each meta-analysis was 90 (IQR = 83–94). b, Within-child difference in LAZ per month by age and sex. Smaller partially transparent points indicate cohort-specific estimates. The median I2 statistic measuring heterogeneity in each meta-analysis was 89 (IQR = 78–92). Both panels include 32 Ki cohorts in 14 countries that measured children at least quarterly (n = 52,640 children) pooled using random-effects models fitted with restricted maximum-likelihood estimation. Vertical bars indicate 95% confidence intervals.
Extended Data Fig. 1
Extended Data Fig. 1. ki cohort selection.
Analyses focused on longitudinal cohorts to enable the estimation of prospective incidence rates and growth velocity. In April 2018, there were 97 longitudinal studies on GHAP. From this set, we applied five inclusion criteria to select cohorts for analysis. Our rationale for each criterion follows. (1) Studies were conducted in lower income or middle-income countries. (2) Studies had a median year of birth in 1990 or later. (3) Studies measured length and weight between birth and age 24 months. (4) Studies did not restrict enrollment to acutely ill children. (5) Studies collected anthropometry measurements at least every 3 months. Each colored cell indicates a criterion that was met. For studies that met all inclusion criteria, all cells in their row are colored. The bars at the top of the plot show the number of observations in each study that met each inclusion criterion by region.
Extended Data Fig. 2
Extended Data Fig. 2. Stunting prevalence by geographic location of ki cohorts.
Locations are approximate, represented as nation-level centroids and jittered slightly for display. The size of each centroid indicates the number of observations contributing to each estimate. The color of each centroid indicates the level of stunting prevalence.
Extended Data Fig. 3
Extended Data Fig. 3. Percentage of enrolled children measured in each ki cohort with quarterly measurements.
Each colored cell indicates the percentage of children with a length-for-age Z-score measurement for a given cohort at a particular child age range. Gray cells indicate that no children had a length-for-age Z-score measurement for that age.
Extended Data Fig. 4
Extended Data Fig. 4. Percentage of enrolled children measured in each ki cohort with monthly measurements.
Each colored cell indicates the percentage of children with a length-for-age Z-score measurement for a given cohort at a particular child age. Gray cells indicate that no children had a length-for-age Z-score measurement for that age.
Extended Data Fig. 5
Extended Data Fig. 5. Distribution of length-for-age Z-score by age.
Mean, 5th and 95th percentile of length-for-age Z-score by age in ki longitudinal cohorts estimated with cubic splines in cohorts with at least monthly measurement. The shaded bands span the 5th to the 95th percentile of length-for-age Z-score in each cohort. The solid line indicates the mean in each cohort at each age (N = 21 cohorts that measured children at least monthly, N = 11,424 children).
Extended Data Fig. 6
Extended Data Fig. 6. Kernel density of length-for-age Z-score by age and cohort.
In South Asia, includes data from 17 cohorts, 21,223 children, and 159,884 measurements. In Africa, includes 7 cohorts, 21,671 children, and 164,431 measurements. In Europe and Latin America, includes 8 cohorts, 9,746 children, and 88,143 measurements.
Extended Data Fig. 7
Extended Data Fig. 7. Parametric mean, standard deviation, and Pearson’s index of skewness estimates by age and cohort.
Estimates were obtained from linear models with skew-elliptical error terms fit using maximum likelihood estimation. Includes 412,458 measurements from 52,640 children in 32 cohorts.
Extended Data Fig. 8
Extended Data Fig. 8. Incidence of stunting by age and national health expenditures as a percentage of gross domestic product.
Proportion of children experiencing incident stunting onset by national health expenditures as a percentage of gross domestic product (1–3%: N = 6–9 studies, N = 2,039–12,076 children; 3–5%: N = 11–19 studies, N = 4,467–16,030 children; 5–42%: N = 5–8 studies, N = 5,423–15,578 children). “0–3” includes age 2 days up to 3 months. Analyses include cohorts with at least quarterly measurements; vertical bars indicate 95% confidence intervals. Gray points indicate cohort-specific estimates. Pooled results were derived from random effects models with restricted maximum likelihood estimation.
Extended Data Fig. 9
Extended Data Fig. 9. Incidence of stunting by age and national percentage of individuals living on less than $1.90 US per day.
Proportion of children experiencing incident stunting onset by national percentage of individuals living on less than $1.90 US per day (0–18%: N = 9–14 studies, N = 6,156–23,493 children; 18–28%: N = 7–10 studies, N = 1,602–14,639 children; 28–100%: N = 5–11 studies, N = 2,333–7,622 children). “0–3” includes age 2 days up to 3 months. Analyses include cohorts with at least quarterly measurements; vertical bars indicate 95% confidence intervals. Gray points indicate cohort-specific estimates. Pooled results were derived from random effects models with restricted maximum likelihood estimation.
Extended Data Fig. 10
Extended Data Fig. 10. Incidence of stunting by age and national under-5 mortality rate.
Proportion of children experiencing incident stunting onset by national under-5 mortality rate (<50 per 100,000: N = 10–13 studies, N = 4,170–17,997 children; 50–95 per 100,000: N = 9–18 studies, N = 3,244–12,296 children; >95 per 100,000: N = 3–7 studies, N = 4,450–15,177 children). “0–3” includes age 2 days up to 3 months. Analyses include cohorts with at least quarterly measurements; vertical bars indicate 95% confidence intervals. Gray points indicate cohort-specific estimates. Pooled results were derived from random effects models with restricted maximum likelihood estimation.
Extended Data Fig. 11
Extended Data Fig. 11. Mean LAZ by age and region with 95% confidence intervals.
Mean length-for-age Z-score (LAZ) stratified by age from birth to age 15 months (N = 21 cohorts that measured children at least monthly between birth and age 15 months, N = 11,243 children). “Never stunted” includes children who did not become stunted by age 15 months. Shaded ribbons indicate 95% confidence intervals. Pooled results were derived from random effects models with restricted maximum likelihood estimation. Thinner lines indicate cohort-specific estimates.
Extended Data Fig. 12
Extended Data Fig. 12. Stunting reversal and relapse by region.
Proportion of new stunting, stunting relapse, and stunting reversal by age. The black line presents estimates pooled using random effects with restricted maximum likelihood estimation. Colored lines indicate cohort-specific estimates. Vertical black error bars indicate 95% confidence intervals. Estimates include data from 21 cohorts in 10 countries with at least monthly measurement (N = 11,435) and are presented through age 15 months because in most cohorts, measurements were less frequent above 15 months.
Extended Data Fig. 13
Extended Data Fig. 13. Distribution of LAZ at subsequent measurements after stunting reversal.
Includes data from 21 cohorts in 10 countries with at least monthly measurement (N = 11,271 children). All panels contain data up to age 15 months because in most cohorts, measurements were less frequent above 15 months. The underlying data is equivalent to that displayed in Fig. 5a; this figure uses a different color palette to emphasize observations in which children experienced new stunting, stunting relapse, or stunting reversal.
Extended Data Fig. 14
Extended Data Fig. 14. Linear growth velocity by age and sex stratified by region.
a) Within-child difference in length in centimeters per month stratified by age, sex, and region. Dashed black line indicates 25th percentile of the WHO Growth Velocity Standards; solid black line indicates the 50th percentile. Colored lines indicate and vertical bars indicate 95% confidence intervals for ki cohorts. Light gray lines indicate cohort-specific linear growth velocity curves. (b) Within-child difference in length-for-age Z-score per month by age, sex, and region. Smaller partially transparent points indicate cohort-specific estimates. Results shown in all panels were derived from 32 ki cohorts in 14 countries that measured children at least quarterly (n = 52,640 children).
Extended Data Fig. 15
Extended Data Fig. 15. Comparison of stunting prevalence at birth with and without gestational age correction.
This figure includes the results from correcting at-birth Z-scores in the ki cohorts that measured gestational age (GA) for 37,218 measurements in 5 cohorts. The number in the parentheses following each cohort name indicates the prevalence of pre-term birth in each cohort. The corrections are using the Intergrowth standards and are implemented using the R growthstandards package (https://ki-tools.github.io/growthstandards/). Overall, the stunting prevalence at birth decreased slightly after correcting for gestational age, but the cohort-specific results are inconsistent. Observations with GA outside of the Intergrowth standards range (<168 or > 300 days) were dropped for both the corrected and uncorrected data. Prevalence increased after GA correction in some cohorts due to high rates of late-term births based on reported GA. Gestational age was estimated based on mother’s recall of the last menstrual period in the Jivita-3, IRC, and CMC-V-BCS-2002 cohorts, was based on the Dubowitz method (newborn exam) in the Keneba cohort and was based on ultrasound measurements in the PROBIT trial.

References

    1. Levels and Trends in Child Malnutrition: Key Findings of the 2019 Editionof the Joint Child Malnutrition Estimates (UNICEF, WHO & World Bank, 2019); https://www.unicef.org/media/60626/file/Joint-malnutrition-estimates-201....
    1. Kinyoki, D. K. et al. Mapping child growth failure across low- and middle-income countries. Nature577, 231–234 (2020). - PMC - PubMed
    1. McDonald, C. M. et al. The effect of multiple anthropometric deficits on child mortality: meta-analysis of individual data in 10 prospective studies from developing countries. Am. J. Clin. Nutr.97, 896–901 (2013). - PubMed
    1. Black, R. E. et al. Maternal and child undernutrition and overweight in low-income and middle-income countries. Lancet382, 427–451 (2013). - PubMed
    1. Olofin, I. et al. Associations of suboptimal growth with all-cause and cause-specific mortality in children under five years: a pooled analysis of ten prospective studies. PLoS One8, e64636 (2013). - PMC - PubMed

Publication types