. 2023 Sep;621(7979):558-567.
doi: 10.1038/s41586-023-06480-z. Epub 2023 Sep 13.

Child wasting and concurrent stunting in low- and middle-income countries

Collaborators, Affiliations

Child wasting and concurrent stunting in low- and middle-income countries

Andrew Mertens et al. Nature. 2023 Sep.

Erratum in

  • Author Correction: Child wasting and concurrent stunting in low- and middle-income countries.
    Mertens A, Benjamin-Chung J, Colford JM Jr, Hubbard AE, van der Laan MJ, Coyle J, Sofrygin O, Cai W, Jilek W, Rosete S, Nguyen A, Pokpongkiat NN, Djajadi S, Seth A, Jung E, Chung EO, Malenica I, Hejazi N, Li H, Hafen R, Subramoney V, Häggström J, Norman T, Christian P, Brown KH, Arnold BF; Ki Child Growth Consortium. Mertens A, et al. Nature. 2023 Nov;623(7985):E1. doi: 10.1038/s41586-023-06695-0. Nature. 2023. PMID: 37833391 Free PMC article. No abstract available.

Abstract

Sustainable Development Goal 2.2-to end malnutrition by 2030-includes the elimination of child wasting, defined as a weight-for-length z-score that is more than two standard deviations below the median of the World Health Organization standards for child growth1. Prevailing methods to measure wasting rely on cross-sectional surveys that cannot measure onset, recovery and persistence-key features that inform preventive interventions and estimates of disease burden. Here we analyse 21 longitudinal cohorts and show that wasting is a highly dynamic process of onset and recovery, with incidence peaking between birth and 3 months. Many more children experience an episode of wasting at some point during their first 24 months than prevalent cases at a single point in time suggest. For example, at the age of 24 months, 5.6% of children were wasted, but by the same age (24 months), 29.2% of children had experienced at least one wasting episode and 10.0% had experienced two or more episodes. Children who were wasted before the age of 6 months had a faster recovery and shorter episodes than did children who were wasted at older ages; however, early wasting increased the risk of later growth faltering, including concurrent wasting and stunting (low length-for-age z-score), and thus increased the risk of mortality. In diverse populations with high seasonal rainfall, the population average weight-for-length z-score varied substantially (more than 0.5 z in some cohorts), with the lowest mean z-scores occurring during the rainiest months; this indicates that seasonally targeted interventions could be considered. Our results show the importance of establishing interventions to prevent wasting from birth to the age of 6 months, probably through improved maternal nutrition, to complement current programmes that focus on children aged 6-59 months.


Conflict of interest statement

T.N. is an employee of the Bill & Melinda Gates Foundation. K.H.B. and P.C. are former employees of the Bill & Melinda Gates Foundation. J.C., V.S., R. Hafen and J.H. work as research contractors funded by the Bill & Melinda Gates Foundation.

Figures

Fig. 1
Fig. 1. Summaries of included cohorts.
a, Number of observations (in thousands) across cohorts by age in months. b, Mean WLZ by age in months for each included cohort. Cohorts are sorted by geographical region and overall mean WLZ. The country and the start date of each cohort are included. GMS, Growth Monitoring Study; IRC, Immune Response Crypto. c, Number of observations included in each cohort. d, Overall wasting prevalence by cohort, defined as the proportion of measurements with WLZ < –2.
Fig. 2
Fig. 2. WLZ, prevalence and incidence of wasting by age and region.
a, Mean WLZ by age in 21 longitudinal cohorts, overall (n = 21 studies; n = 4,165–10,886 observations per month) and stratified by region (Africa: n = 4 studies, n = 1,067–5,428 observations; Latin America: n = 6 studies, n = 569–1,718 observations; South Asia: n = 11 studies, n = 2,382–4,286 observations). b, Age-specific wasting prevalence, defined as WLZ < –2, overall (n = 3,985–9,906 children) and stratified by region (Africa: n = 1,701–5,017 children; Latin America: n = 290–1,397 children; South Asia: n = 1,994–3,751 children). The median I2 statistic measuring heterogeneity in each meta-analysis was 97 (interquartile range (IQR) = 96–97) overall, 96 (IQR = 90–97) in Africa, 2 (IQR = 0–54) in Latin America and 92 (IQR = 88–94) in South Asia. c, Age-specific wasting incidence overall (n = 6,199–10,377 children) and stratified by region (Africa: n = 2,249–5,259 children; Latin America: n = 763–1,437 children; South Asia: n = 3,076–3,966 children). Cumulative incidence measures the proportion of children who have ever experienced wasting since birth, and the new incident cases represent the proportion of children at risk who had an episode of wasting that began during the age period. The median I2 statistic measuring heterogeneity in each meta-analysis was 99 (IQR = 92–99) overall, 98 (IQR = 92–99) in Africa, 56 (IQR = 50–78) in Latin America and 95 (IQR = 82–96) in South Asia. Error bars in b,c are 95% CI for pooled estimates. In each panel, grey curves or points show cohort-specific estimates.
Fig. 3
Fig. 3. Wasting incidence rate and recovery.
a, Example child WLZ trajectory and wasting-episode classifications. The age of wasting onset was assumed to occur halfway between a measurement of WLZ < –2 and the previous measurement of WLZ ≥ –2. Recovery from an episode of wasting or severe wasting occurred when a child had measurements of WLZ ≥ –2 for at least 60 days, with the age of recovery assumed to be halfway between the last measurement of WLZ < –2 and the first measurement of WLZ ≥ –2. The dashed horizontal line marks the cutoff used for moderate wasting, –2 WLZ. b, Wasting incidence rate per 1,000 days at risk, stratified by age and region (overall: n = 510,070–822,802 person-days per estimate, Africa: n = 245,046–407,940 person-days; Latin America: n = 65,058–142,318 person-days; South Asia: n = 182,694–315,057 person-days). Insets are histograms of the number of wasting episodes per child by region, with the distribution mean (s.d.) printed within the plot. The median I2 statistic measuring heterogeneity in each meta-analysis was 97 (IQR = 96–98) overall, 92 (IQR = 90–94) in Africa, 27 (IQR = 2–68) in Latin America and 91 (IQR = 87–94) in South Asia. c, Percentage of children who recovered from wasting within 30, 60 and 90 days of episode onset (n = 21 cohorts, 5,549 wasting episodes). The median I2 statistic measuring heterogeneity in each meta-analysis was 78 (IQR = 66–80) overall, 82 (IQR = 76–87) in Africa, 1 (IQR = 0–31) in Latin America and 77 (IQR = 45–81) in South Asia. d, The distribution of children’s mean WLZ in the three months after recovery from wasting, with the IQR marked. The median WLZ is annotated, and grey points mark cohort-specific medians. Children wasted before the age of 6 months experienced larger improvements in WLZ compared with children who were wasted at older ages (P < 0.001). The analysis uses 3,686 observations of 2,301 children who recovered from wasting episodes, with 1,264 observations at birth, 628 observations from 0–6 months, 824 observations from 6–12 months and 970 observations from 12–18 months. The dashed horizontal line marks the cutoff used for moderate wasting, –2 WLZ. e, Mean WLZ by age, stratified by wasting status at birth (which includes the first measure of a child within seven days of birth), shows that children born wasted (n = 814 children, 14,351 observations) did not catch up with children who were not born wasted (n = 3,355 children, 62,568 observations). f, Increased risk of multiple types of wasting after the age of 6 months among children born wasted (n = 814), with the relative risk (RR) for born wasted versus not and 95% CI printed at the bottom (n = 3,355). The median I2 statistic measuring heterogeneity in each meta-analysis was 73 (IQR = 67–81) overall, 98 (IQR = 92–99) in Africa, 56 (IQR = 50–78) in Latin America and 95 (IQR = 82–96) in South Asia. In b,c,f, vertical lines mark 95% CI for pooled means of study-specific estimates (light points).
Fig. 4
Fig. 4. Mean WLZ by age and season.
a, Mean WLZ by day of the year, superimposed over histograms of monthly mean rainfall over study periods, with the seasonality index included in parentheses beside the cohort name. The mean (lines) was estimated with cubic splines and the shaded regions indicate pointwise 95% CI. Panels are sorted by country and the mean WLZ is coloured by seasonality index categories: high (≥0.9), orange; medium (<0.9 and ≥0.7), blue; low (<0.7), green. Sample sizes range from 160 children (2,545 measurements) in TDC to 2,545 (40,115 measurements) in the Keneba cohort. b, Mean differences in child WLZ between quarters of the year defined around the adjacent three-month periods with the highest mean rainfall, pooled across cohorts in a, overall (n = 21 cohorts, 2,545–40,115 observations) and by seasonality index (high: n = 7 cohorts, 3,164–40,115 observations; medium: n = 8 cohorts, 2,545–9,202 observations; low: n = 6 cohorts, 2,741–29,518 observations). Points represent mean differences compared to the reference level (Ref.) of the dry season and error bars represent 95% CI. The median I2 statistic measuring heterogeneity in each meta-analysis was 91 (IQR = 87–94). c, Mean WLZ at birth by month of birth estimated with a cubic spline among 1,821 children with WLZ measured at birth in 10 South Asian cohorts. The mean (line) was estimated with cubic splines and the shaded region is its pointwise 95% CI. The inset plot summarizes mean differences in birth WLZ by month of birth (points), with January as the reference level (Ref.), and error bars represent 95% CI. The median I2 statistic measuring heterogeneity in each meta-analysis was 18 (IQR = 0–41).
Fig. 5
Fig. 5. Co-occurrence of wasting, stunting and being underweight.
a, Age-specific prevalence of concurrent wasting and stunting overall (n = 3,984–9,899 children) and stratified by region (Africa: n = 1,799–5,014 children; Latin America: n = 290–1,397 children; South Asia: n = 1,994–3,747 children). Vertical lines mark 95% CI for pooled means across study-specific estimates (grey points). The median I2 statistic measuring heterogeneity in each meta-analysis was 91 (IQR = 79–94) overall, 84 (IQR = 72–90) in Africa, 31 (IQR = 0–42) in Latin America and 86 (IQR = 73–86) in South Asia. b, Percentage of children classified by different measures of growth faltering, alone or combined. Children classified as ‘never faltered’ had not previously been wasted, stunted or underweight. Children in the ‘recovered’ category were not wasted, stunted or underweight but had experienced at least one of these conditions previously. All children who were wasted and stunted were also underweight. Proportions in each category were calculated within cohorts, pooled using random effects and scaled so that the percentages added up to 100%. The number of children contributing to each age ranged from 3,920 to 9,077, with 11,409 children in total.
Extended Data Fig. 1
Extended Data Fig. 1. Ki cohort selection.
Analyses focused on longitudinal cohorts to enable the estimation of prospective incidence rates and growth velocity. On 15 July 2018, there were 97 longitudinal studies with data collected and made available by Ki. From this set, we applied five inclusion criteria to select cohorts for analysis. Our rationale for each criterion is as follows. (1) Studies were conducted in LMICs. Our target of inference for analyses was children in LMICs, which remains a key target population for preventive interventions. (2) Studies measured length and weight between birth and age 24 months. We were principally interested in growth faltering during the first two years of life including at birth, thought to be the key window for linear growth faltering. (3) Studies did not restrict enrolment to acutely ill children. Our focus on descriptive analyses led us to target, to the extent possible, the general population. We thus excluded some studies that exclusively enrolled acutely ill children, such as children who presented to hospital with acute diarrhoea or who were severely malnourished. (4) Studies enrolled at least 200 children. Age-stratified incident episodes of stunting and wasting were sufficiently rare that we wanted to ensure each cohort would have enough information to estimate rates before contributing to pooled estimates. (5) Studies collected anthropometry measurements at least every three months. We limited studies to those with higher temporal resolution to ensure that we adequately captured incident episodes and recovery. We further restricted analyses of wasting incidence and recovery to cohorts with monthly measurements because of high temporal variation in WHZ within individuals.
Extended Data Fig. 2
Extended Data Fig. 2. Geographical location of Ki cohorts.
Locations are approximate and jittered slightly for display.
Extended Data Fig. 3
Extended Data Fig. 3. Percentage of enrolled children measured in each Ki cohort with monthly measurements.
Each coloured cell indicates the percentage of children with a WLZ measurement for a given cohort at a particular child age. Grey cells indicate that no children had a WLZ measurement for that age.
Extended Data Fig. 4
Extended Data Fig. 4. Comparison of cohort anthropometry to population-based samples.
a, Kernel density distributions of LAZ, WAZ and WLZ from measurements among children under 24 months old in 21 Ki longitudinal cohorts (coloured line) and among children measured in the most recent population-based DHS for each country (black). Sub-Saharan African countries are coloured blue, Latin American countries are coloured green and south Asian countries are coloured orange. Median z-scores are denoted with points under the density curves, with open circles for Ki cohorts and solid points for DHSs. b, Mean LAZ, WAZ and WLZ by age and country among 21 Ki longitudinal cohorts (dashed lines) and in DHSs (solid). Means estimated with cubic splines and shaded regions show approximate, simultaneous 95% CI. Each panel includes n = 117,664 children with LAZ, 117,783 children with WAZ, and 117,619 children with WHZ measured from DHS data and n = 11,442 children with LAZ, 11,443 children with WAZ, 11,407 children with WLZ measured from Ki cohorts.
Extended Data Fig. 5
Extended Data Fig. 5. Prevalence of persistent wasting, severe wasting and being underweight, wasting measurement frequency, and concurrent wasting and stunting by region.
a, Prevalence of severe wasting (WLZ < –3) by age and region. b, Histograms of the proportions of visits at which children have wasted measurements, overall and stratified by region (20 bins at 5% bin-width). c, Proportion of children persistently wasted (≥50% of measurements from birth to 24 months of age, overall and stratified by region. d, Incidence proportion of concurrent wasting and stunting by age and region. Across all ages before 24 months, 10.6% of children experienced at least one concurrent wasted and stunted measurement. e, Prevalence of being underweight (WAZ < –2) by age and region.
Extended Data Fig. 6
Extended Data Fig. 6. Incidence of wasting by age and country characteristics.
Proportion of children at different ages in months who experienced the onset of wasting episodes (a) by national health expenditures as a percentage of gross domestic product (0–4.4%: n = 5 studies, n = 3,305 children; 4.5–5.5%: n = 5 studies, n = 2,697 children; >5.5%: n = 3 studies, n = 3,325 children); (b) by national percentage of individuals living on less than $1.90 US per day (0–18%: n = 5 studies, n = 2,818 children; 18–51%: n = 6 studies, n = 3,584 children; 51–100%: n = 2 studies, n = 3,381 children); (c) and by national under-5 mortality rate (<50 per 100,000: n = 6 studies, n = 2,743 children; 50–80 per 100,000: n = 3 studies, n = 3,952 children; >80 per 100,000: n = 3 studies, n = 3,611 children). The ‘Birth’ age category includes measurements in the first 7 days of life and the ‘0–3’ age category includes ages from 8 days up to 3 months. Vertical bars indicate 95% CI from random-effects meta-analysis models with restricted maximum likelihood estimation, and grey points indicate cohort-specific estimates.
Extended Data Fig. 7
Extended Data Fig. 7. Comparison of the prevalence of being underweight and stunting at birth, with and without correction for gestational age.
This figure includes the results from correcting at-birth z-scores in the Ki cohorts that measured gestational age (GA). The corrections are using the Intergrowth standards and are implemented using the R growthstandards package (https://ki-tools.github.io/growthstandards/). Overall, the prevalence at birth decreased slightly after correcting for gestational age, but the cohort-specific results are inconsistent. Observations with GA outside of the Intergrowth standards range (<168 or >300 days) were dropped for both the corrected and uncorrected data. Prevalence increased after GA correction in some cohorts owing to high rates of late-term births based on reported GA. There were no length measurements at birth in the Tanzania Child 2 cohort, so they do not have stunting estimates. There were 4,449 measurements used in the underweight analysis and 1,931 measurements used in the stunting analysis. Gestational age was estimates based on mother’s recall of the last menstrual period in the IRC, CMC-V-BCS-2002 and Tanzania Child cohorts, and was based on the Dubowitz method (newborn exam) in the MRC Keneba cohort.
Extended Data Fig. 8
Extended Data Fig. 8. RTM effects in wasted children.
a, Expected mean z-scores based on the RTM effect (orange) and observed mean z-scores (blue) three months after wasted children are measured. The lines connecting cohort-specific observed and expected WLZ at each age are coloured orange if the expected estimate under RTM was higher than the observed mean (indicating lower than expected change in WLZ under RTM alone), and blue if the observed mean was higher than the expected estimate under RTM (indicating higher than expected change in WLZ under RTM alone). For examples, most cohorts experienced larger increases in WLZ than expected in the three-month period beginning in their first month of life (blue lines) and most cohorts experienced smaller increases in WLZ than expected in the three-month periods beginning at ages 6–9 months (orange lines). b, Difference between observed means and expected means under a pure RTM effect by cohort, with the median differences by age indicated with horizontal lines. Details on estimation of the RTM effects are in the Methods.
Extended Data Fig. 9
Extended Data Fig. 9. Duration of wasting episodes by child age and region.
Duration of wasting episodes that began in each age category, overall (n = 787–1,940 episodes per age category) and stratified by region (Africa: 377–916 episodes, Latin America: n = 11–25 episodes, South Asia: n = 410–1,146 episodes). The ‘Birth’ age category includes measurements in the first 7 days of life and the ‘0–3’ age category includes ages from 8 days up to 3 months. Estimates were pooled across cohorts using the median of medians method. Vertical bars indicate 95% CI around the pooled estimates, and grey points indicate cohort-specific estimates. Episodes are assumed to start halfway between non-wasted and wasted measurements, and end halfway between the last wasted measurement and first recovered estimate. Birth episodes start at birth, so episodes at birth are generally shorter that post-birth episodes with the same number of wasted measurements.
Extended Data Fig. 10
Extended Data Fig. 10. Risk of growth faltering in the subsequent three months by whether a child was wasted or stunted at each age.
Relative risk of wasting and stunting in the next three-month period among children who were wasted (right) or stunted (left) at each age. For example, children who were wasted at birth had an approximately twofold increased risk of wasting during the subsequent 0–3 month period, and children who were stunted at birth had an approximately fourfold increased risk of being stunted during the subsequent 0–3 month period. Points indicate relative risks and vertical lines mark 95% CI.
Extended Data Fig. 11
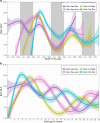
Extended Data Fig. 11. Month of birth affects seasonal patterns in WLZ.
a, Mean WLZ by calendar month among South Asian cohorts, with children stratified by birth month. The x axis begins at 1 January of the year of the first January birthday in each cohort. Grey backgrounds indicate the approximate timing of seasonal monsoons in South Asia (June–September) Lines represent mean WLZ estimated using semiparametric cubic splines, and shaded regions around the means indicate simultaneous 95% CI. Eleven cohorts, 4,040 children and 78,573 measurements were used to estimate the splines. South Asian children born in July–September had the lowest mean WLZ overall and children born in April–September had larger seasonal declines in WLZ during their second year of life than children born October–March. b, Mean WLZ from birth to age 24 months among children from South Asian cohorts stratified by birth month. Lines represent mean WLZ estimated using semiparametric cubic splines, and shaded regions around the means indicate simultaneous 95% CI. Estimates were fit using the same data as in a.

References

    1. Goal 2: End Hunger, Achieve Food Security and Improved Nutrition and Promote Sustainable Agriculture (United Nations, accessed 17 August 2023); https://sustainabledevelopment.un.org/sdg2.
    1. UNICEF, WHO & The World Bank Joint Child Malnutrition Estimates—Levels and Trends (UNICEF & WHO, 2023); https://data.unicef.org/resources/jme-report-2023/.
    1. de Onis M. WHO Child Growth Standards based on length/height, weight and age. Acta Paediatr. 2006;95:76–85. doi: 10.1111/j.1651-2227.2006.tb02378.x. - DOI - PubMed
    1. Rytter MJH, Kolte L, Briend A, Friis H, Christensen VB. The immune system in children with malnutrition—a systematic review. PLoS One. 2014;9:e105017. doi: 10.1371/journal.pone.0105017. - DOI - PMC - PubMed
    1. Chang CY, et al. Children successfully treated for moderate acute malnutrition remain at risk for malnutrition and death in the subsequent year after recovery. J. Nutr. 2013;143:215–220. doi: 10.3945/jn.112.168047. - DOI - PMC - PubMed

Publication types