Comparative Study
. 2023 Oct;622(7981):112-119.
doi: 10.1038/s41586-023-06542-2. Epub 2023 Sep 13.

A cross-species proteomic map reveals neoteny of human synapse development

Affiliations
Comparative Study

A cross-species proteomic map reveals neoteny of human synapse development

Li Wang et al. Nature. 2023 Oct.

Abstract

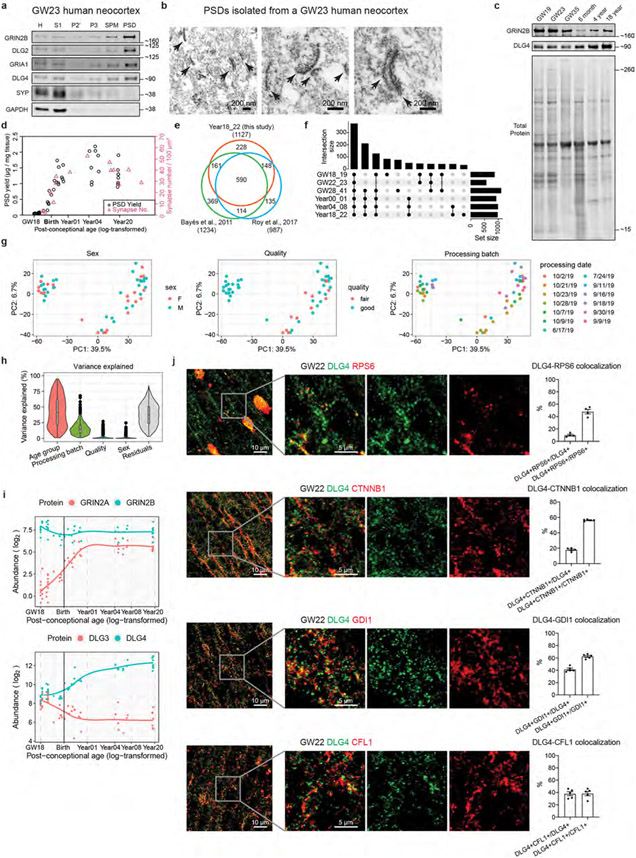
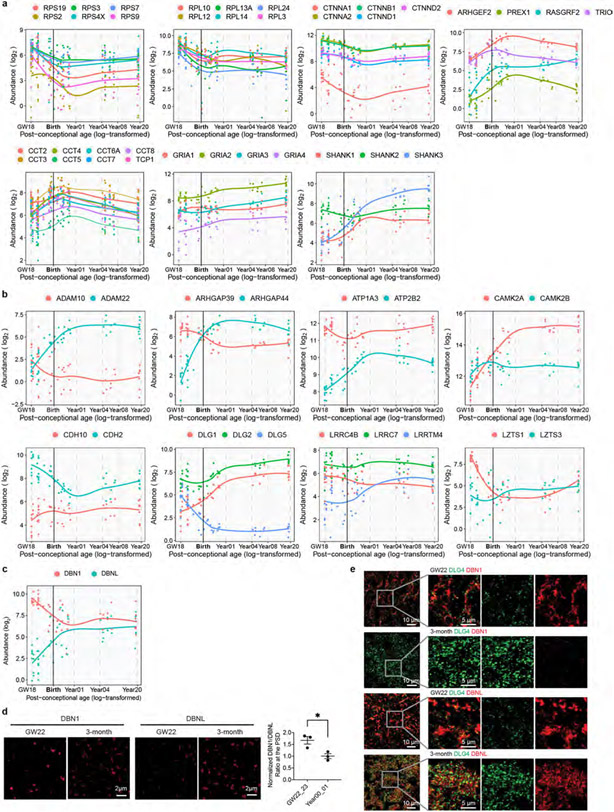
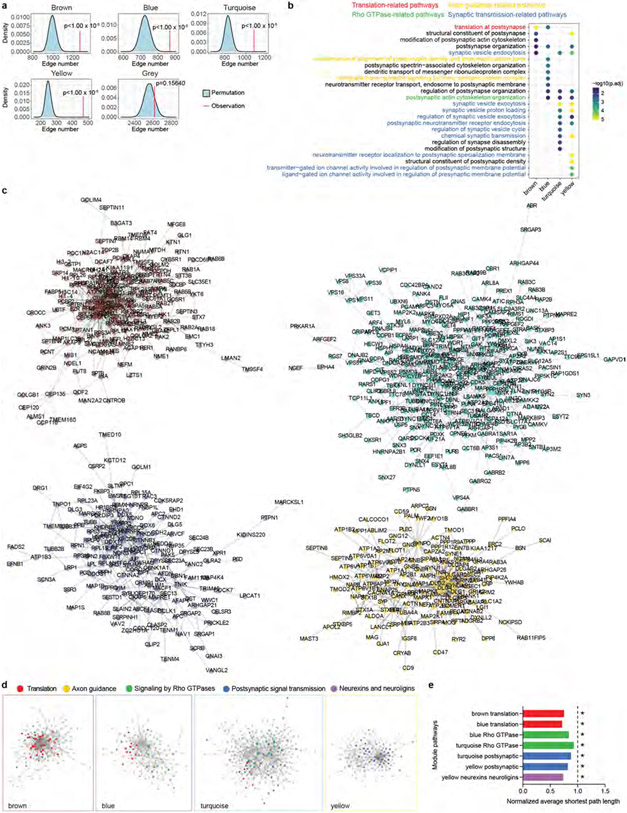
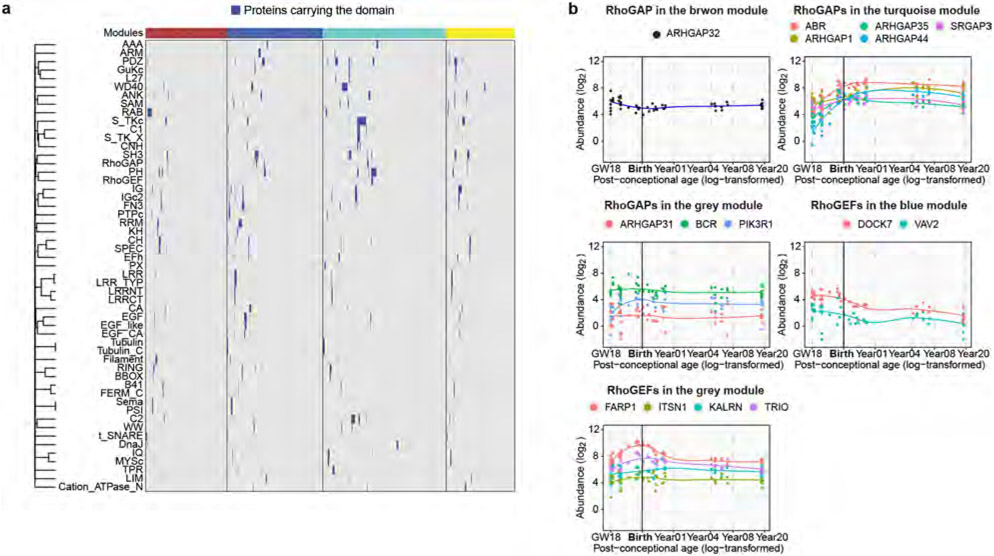
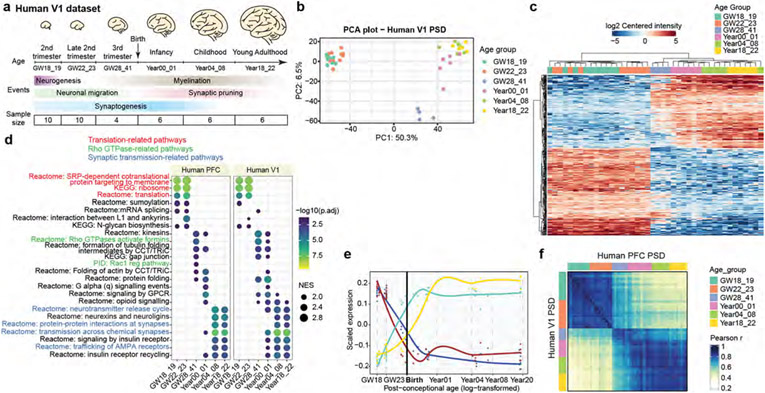
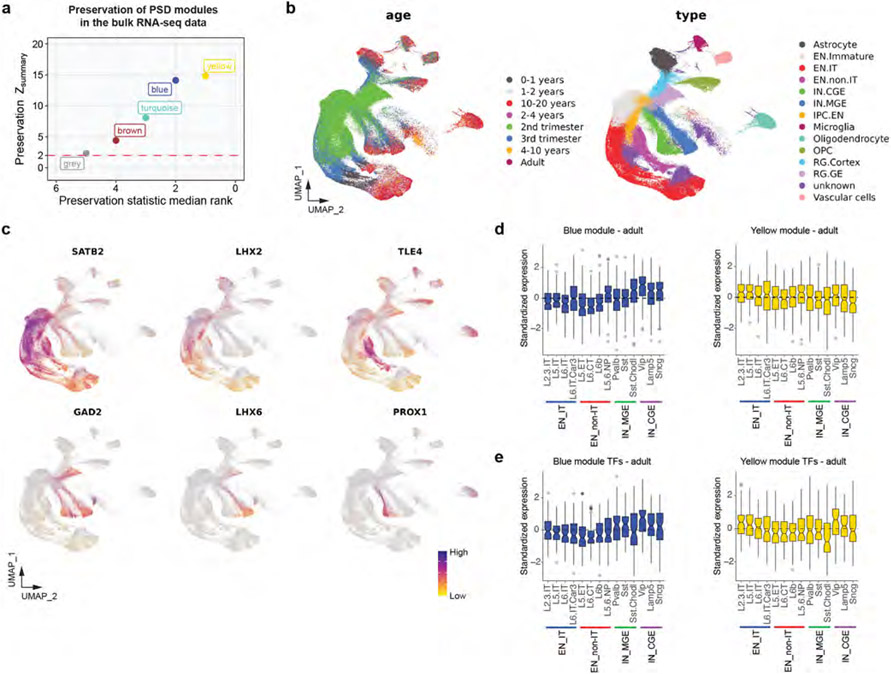
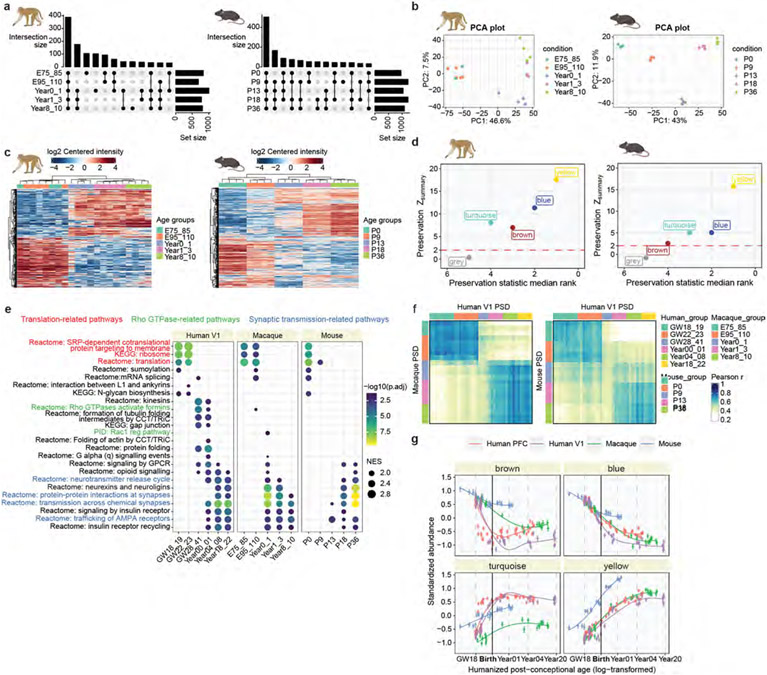
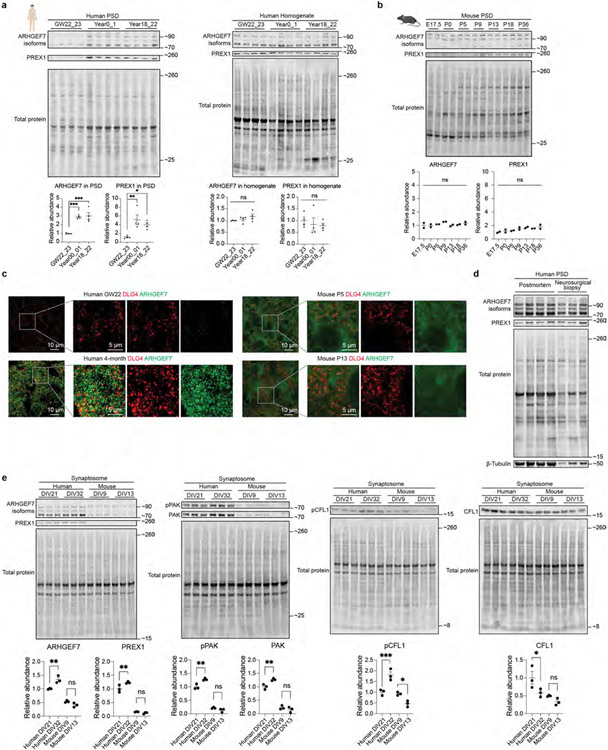
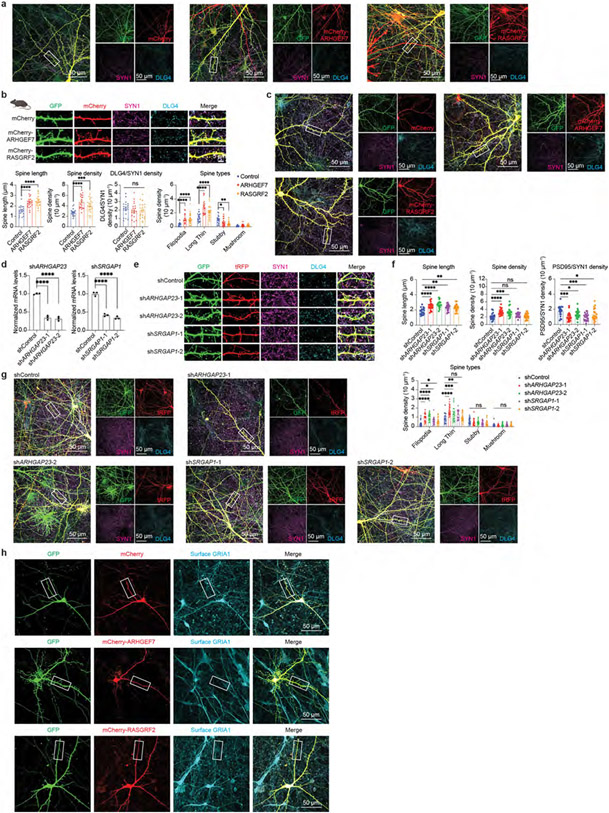
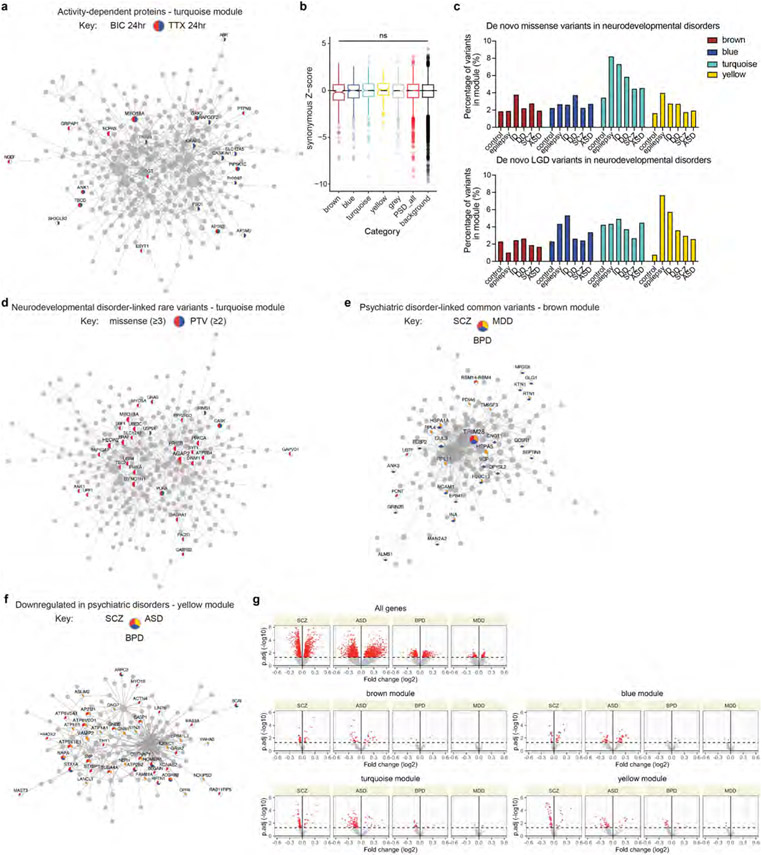
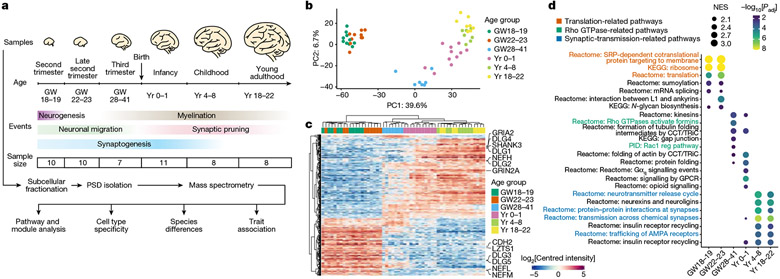
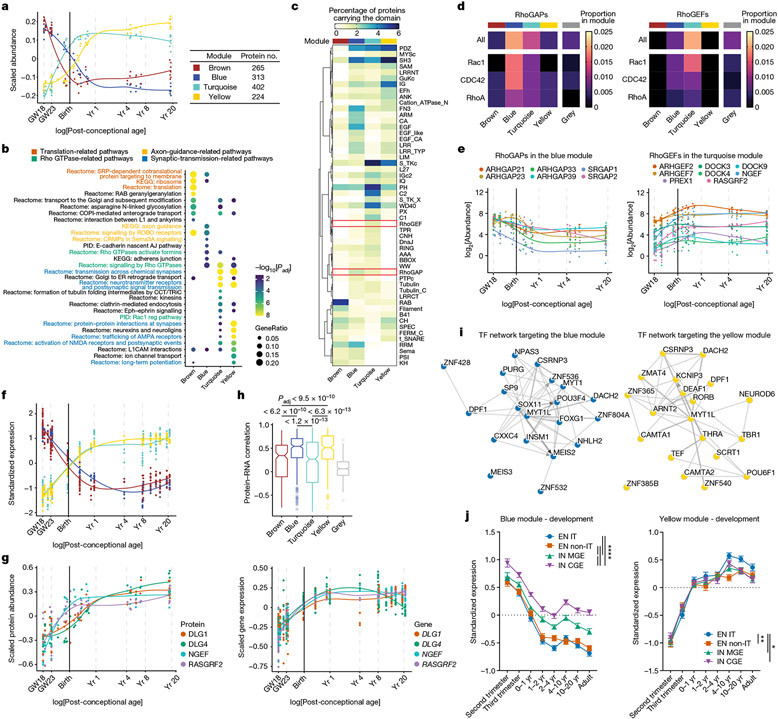
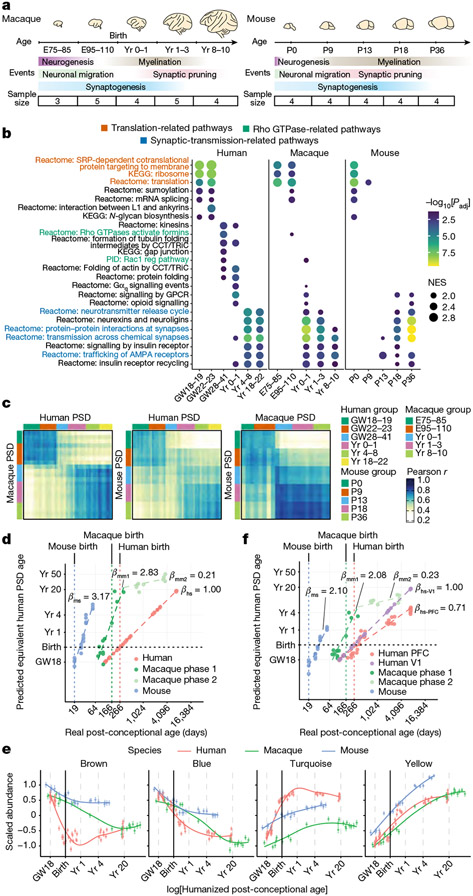
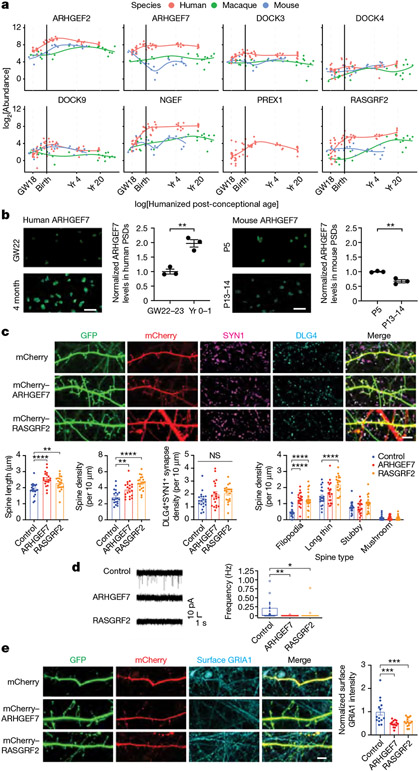
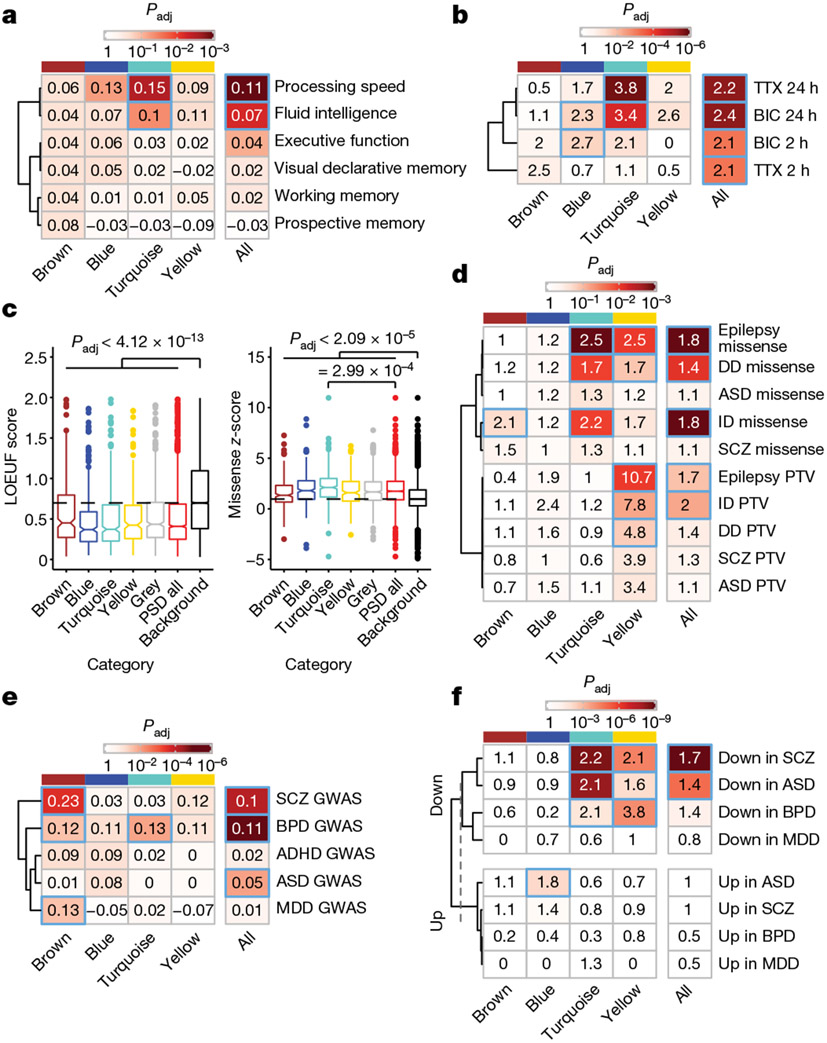
The molecular mechanisms and evolutionary changes accompanying synapse development are still poorly understood1,2. Here we generate a cross-species proteomic map of synapse development in the human, macaque and mouse neocortex. By tracking the changes of more than 1,000 postsynaptic density (PSD) proteins from midgestation to young adulthood, we find that PSD maturation in humans separates into three major phases that are dominated by distinct pathways. Cross-species comparisons reveal that human PSDs mature about two to three times slower than those of other species and contain higher levels of Rho guanine nucleotide exchange factors (RhoGEFs) in the perinatal period. Enhancement of RhoGEF signalling in human neurons delays morphological maturation of dendritic spines and functional maturation of synapses, potentially contributing to the neotenic traits of human brain development. In addition, PSD proteins can be divided into four modules that exert stage- and cell-type-specific functions, possibly explaining their differential associations with cognitive functions and diseases. Our proteomic map of synapse development provides a blueprint for studying the molecular basis and evolutionary changes of synapse maturation.


Figures

Extended Data Fig. 1 ∣
Extended Data Fig. 1 ∣. Isolation of PSDs from immature and mature human cortices.
a, Western blot analysis of different subcellular fractions of a GW23 sample demonstrating enrichment of PSD proteins and depletion of presynaptic SYP and cytoplasmic GAPDH in the PSD fraction. Enrichment of PSD proteins after fractionation was validated for all samples subjected to mass spectrometry analysis. b, Electron micrographs of the PSD fraction isolated from a GW23 sample (scale bar: 200 nm). Arrows denote structures resembling the PSD. The experiment was performed on one sample. c, Western blot analysis of purified PSDs from different age groups demonstrating changes in GRIN2B and DLG4 during development. The experiment was performed once. d, Correlation between PSD yield and synapse number of developing human prefrontal cortex. e, Venn diagram showing the overlap between Year18_22 samples in this study and the human PSD proteomes published in Roy et al., 2017 and Bayés et al., 2011. f, UpSet plot describing the number of identified proteins and their overlaps at each age group. g, PCA plots of the samples colored by various covariates. h, Variance explained by individual covariates (n = 1765 proteins). Boxplot center: median; hinges: the 25th and 75th percentiles; whiskers: 1.5 × inter-quartile range. i, Abundance patterns of GRIN2A, GRIN2B, DLG3, and DLG4. j, Colocalization of RPS6, CTNNB1, GDI1, or CFL1 with DLG4 in second-trimester human neocortex (n = 5, 5, 5 and 5 samples, scale bar: 10 μm or 5 μm as indicated in the figure). Data are presented as mean values ± s.e.m.
Extended Data Fig. 2 ∣
Extended Data Fig. 2 ∣. Examples of PSD protein abundance patterns in human cortical development.
a, Abundance patterns of representative PSD proteins. b, Examples of PSD protein paralogs that undergo reciprocal developmental changes. c, Abundance patterns of DBN1 and DBNL. d, Immunofluorescent intensity of DBN1 and DBNL at DLG4 loci in human neocortex (n = 3 and 3 samples, scale bar: 2 μm). Data are presented as mean values ± s.e.m. The P value was obtained from unpaired two-tailed t test; *P < 0.05. e, Original large field of view images for producing processed images in panel d (scale bar: 10 μm or 5 μm as indicated in the figure).
Extended Data Fig. 3 ∣
Extended Data Fig. 3 ∣. Protein modules of the developing human PSD.
a, Kernel density estimation of the null distributions of protein-protein interaction (PPI) numbers assuming no enrichment of PPI in individual modules; the vertical red lines indicate the observed PPI numbers in each module. The exact P value was derived from the one-tailed permutation test. b, SynGO biological pathway enrichment analysis of each module. Nominal P values from Fisher’s exact test were adjusted by the Benjamini and Hochberg method. c, PPI-co-abundance network of the four PSD modules. d, PPI-co-abundance network of each module highlighting proteins in enriched pathways. e, The normalized average shortest path lengths of pathways in individual modules. The asterisks denote that the average shortest path length is significantly shorter within pathway proteins than between pathway and non-pathway proteins. The P values were obtained from one-tailed Wilcoxon rank sum test; *P < 0.01.
Extended Data Fig. 4 ∣
Extended Data Fig. 4 ∣. Protein domains in PSD proteins.
a, Protein domains in individual PSD proteins. The rows are clustered based on the Jaccard distance. b, Abundance patterns of RhoGAPs and RhoGEFs not listed in Fig. 2e.
Extended Data Fig. 5 ∣
Extended Data Fig. 5 ∣. Changes in PSD composition during human V1 development.
a, Schematic illustrating the developmental stages of samples in the human V1 dataset. b, PCA plots of samples in the human V1 dataset colored by their age groups. c, Hierarchical clustering of the samples in the human V1 dataset based on proteins with differential abundance. d, Gene set enrichment analysis (GSEA) for individual age groups across species. NES, normalized enrichment score. Nominal P values were adjusted by the Benjamini and Hochberg method. e, Scaled abundance patterns (module eigengene values) of four protein modules in the human V1 dataset. f, Similarity matrices representing pairwise Pearson correlations between human PFC and human V1 samples.
Extended Data Fig. 6 ∣
Extended Data Fig. 6 ∣. Transcription of PSD proteins.
a, Preservation of human PSD modules in the bulk RNA-seq data. b, Uniform manifold approximation and projection (UMAP) plots showing the distribution of age groups and cell types in the single-nucleus RNA-seq data from developing human neocortex. c, UMAP plots showing the expression patterns of neuronal subtype-specific markers in the single-nucleus RNA-seq data from developing human neocortex. d, Standardized expression values of genes in the blue (n = 301 genes) and yellow (n = 218 genes) modules in individual neuronal subtypes of the adult human neocortex. Boxplot center: median; hinges: the 25th and 75th percentiles; whiskers: 1.5 × inter-quartile range. e, Standardized expression values of top TFs predicted to regulate the blue (95 genes) and yellow (97 genes) modules in individual neuronal subtypes of the adult human neocortex. Boxplot center: median; hinges: the 25th and 75th percentiles; whiskers: 1.5 × inter-quartile range. EN_IT, excitatory intratelencephalic neuron; EN_non-IT, excitatory non-intratelencephalic neuron; IN_MGE, inhibitory neuron derived from the medial ganglionic eminence; IN_CGE, inhibitory neuron derived from the caudal ganglionic eminence.
Extended Data Fig. 7 ∣
Extended Data Fig. 7 ∣. Changes in PSD composition during macaque and mouse neocortical development.
a, UpSet plot describing the number of identified proteins and their overlaps at each age group of macaque and mouse datasets. b, PCA plots of the macaque and mouse samples colored by their age groups. c, Hierarchical clustering of macaque and mouse samples based on proteins with differential abundance. d, Preservation of Human PSD modules in macaque and mouse PSD proteomic data. e, Gene set enrichment analysis (GSEA) for individual age groups across human V1, macaque, and mouse samples. NES, normalized enrichment score. Nominal P values were adjusted by the Benjamini and Hochberg method. f, Similarity matrices representing pairwise Pearson correlations between human V1, macaque, and mouse samples. g, Standardized abundance patterns of proteins in the four PSD modules (n = 127, 169, 159 and 178 proteins) across regions and species along the humanized age based on the human V1 dataset. Data are presented as mean values ± s.e.m. The macaque and mouse illustrations were created with BioRender.com.
Extended Data Fig. 8 ∣
Extended Data Fig. 8 ∣. RhoGEF levels and activities during synapse development.
a, Immunoblots and quantification of ARHGEF7 and PREX1 in the PSD and homogenate of developing human cortex (n = 4, 4 and 4 samples). Data are presented as mean values ± s.e.m. The P values were obtained from one-way ANOVA with Holm-Sidak’s multiple comparisons test; *P < 0.05, **P < 0.01, ***P < 0.001. b, Immunoblots and quantification of ARHGEF7 and PREX1 in the PSD of developing mouse cortex (n = 2, 2, 2, 2, 2, 2 and 2 samples). Data are presented as mean values ± s.e.m. The P values were obtained from one-way ANOVA; ns, not significant. c, Original large field of view images for producing processed images in Fig. 4b (scale bar: 10 μm or 5 μm as indicated in the figure). d, Comparison of adult human PSD samples from postmortem brain tissues and neurosurgical biopsy tissues by western blot analysis (n = 4 and 3 samples). e, Immunoblots and quantification of ARHGEF7, PREX1, phospho-PAK, PAK, phospho-CFL1, and CFL1 in the synaptosomes of cultured primary human (n = 3 and 3 samples) and mouse cortical neurons (n = 3 and 3 samples) at indicated days in vitro (DIV). Data are presented as mean values ± s.e.m. The P values were obtained from one-way ANOVA with Holm-Sidak’s multiple comparisons test; *P < 0.05, **P < 0.01, ***P < 0.001, ns, not significant. The human and mouse illustrations were created with BioRender.com.
Extended Data Fig. 9 ∣
Extended Data Fig. 9 ∣. Manipulation of Rho GTPase regulators alters synapse development in human and mouse cortical neurons.
a, Original large field of view images for producing processed images in Fig. 4c (scale bar: 50 μm). b, Immunostaining of dendrites from primary mouse cortical neurons cultured 8 days in vitro. Neurons were transfected with mEGFP-C1 and vectors expressing mCherry, mCherry-ARHGEF7, or mCherry-RASGRF2 (n = 20, 20 and 20 neurons from 4 cultures, scale bar: 5 μm). Data are presented as mean values ± s.e.m. The P values were obtained from one-way ANOVA with Holm-Sidak’s multiple comparisons test; *P < 0.05, **P < 0.01, ***P < 0.001, ****P < 0.0001. c, Original large field of view images for producing processed images in panel b (scale bar: 50 μm). d, Quantification of mRNA levels of ARHGAP23 and SRGAP1 in HEK293T cells transfected with control shRNAs (shControl), two shRNAs targeting ARHGAP23 (shARGGAP23–1 and shARGGAP23–2), or two shRNAs targeting SRGAP1 (shSRGAP1–1 and shSRGAP1–2) (n = 3 cultures for all conditions). Data are presented as mean values ± s.e.m. The P values were obtained from one-way ANOVA with Holm-Sidak’s multiple comparisons test; ****P < 0.0001. e,f, Immunostaining of dendrites from primary human cortical neurons cultured six weeks in vitro. Neurons were transfected with mEGFP-C1 and vectors co-expressing turbo-RFP (tRGP) and shControl, shARGGAP23–1, shARGGAP23–2, shSRGAP1–1 or shSRGAP1–2 (n = 20, 22, 20, 20 and 20 neurons from 4 cultures, scale bar: 5 μm). Data are presented as mean values ± s.e.m. The P values were obtained from one-way ANOVA with Holm-Sidak’s multiple comparisons test; *P< 0.05, **P < 0.01, ***P < 0.001, ****P< 0.0001. g, Original large field of view images for producing processed images in panel e (scale bar: 50 μm). h, Original large field of view images for producing processed images in Fig. 4e (scale bar: 50 μm).
Extended Data Fig. 10 ∣
Extended Data Fig. 10 ∣. Association of PSD modules with cognitive functions and brain disorders.
a, PPI-co-abundance network of the turquoise module with activity-dependent proteins highlighted. b, Distribution of gnomAD synonymous Z-scores of genes in each category (n = 265, 313, 402, 224, 561, 1765 and 12892 genes). Boxplot center: median; hinges: the 25th and 75th percentiles; whiskers: 1.5 × inter-quartile range. The P values were obtained from Kruskal–Wallis test with Dunn’s multiple comparisons test; ns, not significant. c, Percentage of rare variants located at PSD module genes in subjects with or without neurodevelopmental disorders. d, PPI-co-abundance network of the turquoise module with genes carrying neurodevelopmental disorder-linked (at least 3) de novo missense variants or (at least 2) PTVs highlighted. e, PPI-co-abundance network of the brown module with genes carrying psychiatric disorder-linked common variants highlighted. f, PPI-co-abundance network of the yellow module with genes downregulated in psychiatric disorders highlighted. g, Volcano plots for misexpressed genes after the onset of psychiatric disorders in PSD modules. Red dots indicate differentially expressed genes with the Benjamini–Hochberg adjusted P values < 0.05.
Fig. 1 ∣
Fig. 1 ∣. Changes in PSD composition during human neocortical development.
a, Flow chart of the overall approach. GW, gestational week. b, Principal component (PC) analysis plots of samples coloured by their age groups. c, Hierarchical clustering of samples based on proteins with differential abundance. d, GSEA for individual age groups. NES, normalized enrichment score; KEGG, Kyoto Encyclopedia of Genes and Genomes; PID, Pathway Interaction Database; reg, regulatory; GPCR, G-protein-coupled receptor. Nominal P values were adjusted (adj) by the Benjamini–Hochberg method.
Fig. 2 ∣
Fig. 2 ∣. Protein modules of the developing human PSD.
a, Scaled abundance patterns (module eigengene values) of four protein modules of the human PSD identified by WGCNA. b, Pathway enrichment analysis of each module. GeneRatio, proportion of genes in the pathway that are present in the module; AJ, adhesion junction. Nominal P values from hypergeometric test were adjusted by the Benjamini–Hochberg method. c, Distribution of protein domains in each module. d, Proportions of RhoGAPs (left) and RhoGEFs (right) and their subtypes in each module. e, Abundance patterns of RhoGAPs in the blue module (left) and RhoGEFs in the turquoise module (right). f, Standardized median expression values of genes encoding proteins of the four PSD modules in the BrainSpan data. g, Scaled protein abundance (left) and gene expression (right) patterns of DLG1, DLG4, NGEF and RASGRF2. h, Spearman correlation coefficients between protein abundance and gene expression of PSD proteins in each module (left to right: n = 236, 283, 371, 212 and 504 proteins). Box plot centre, median; hinges, the 25th and 75th percentiles; whiskers, 1.5 × interquartile range. The P values were obtained from Kruskal–Wallis test with Dunn’s multiple comparisons test. i, Transcription factor (TF) networks that regulate genes in the blue (left) and yellow (right) modules. j, Standardized expression values of genes in the blue (n = 298 genes; left) and yellow (n = 217 genes; right) modules in individual neuronal subtypes of developing human neocortex. EN IT, excitatory intratelencephalic neuron; EN non-IT, excitatory non-intratelencephalic neuron; IN MGE, inhibitory neuron derived from the medial ganglionic eminence; IN CGE, inhibitory neuron derived from the caudal ganglionic eminence. Data are presented as mean values s.e.m. Nominal P values from two-way analysis of variance (ANOVA) were adjusted by the Benjamini–Hochberg method; *P < 0.05, **P < 0.01, ****P < 0.0001.
Fig. 3 ∣
Fig. 3 ∣. Comparison of PSD development across humans, macaques and mice.
a, Schematic of developmental stages of macaque (left) and mouse (right) samples. E, embryonic day; P, postnatal day. b, GSEA for individual age groups across species. Nominal P values were adjusted by the Benjamini–Hochberg method. c, Similarity matrices representing pairwise Pearson correlations between human, macaque and mouse samples. d, Predicted equivalent human PSD ages. β indicates the slope coefficients of the linear regression models in each species. ms, mouse; mm1, macaque phase 1; mm2, macaque phase 2; hs, human, e, Standardized abundance patterns of proteins in the four PSD modules (left to right: n = 127, 169, 159 and 178 proteins) across species. Data are presented as mean values ± s.e.m. f, Predicted equivalent human PSD ages based on the human V1 dataset. β indicates the slope coefficients of the linear regression models in each region and species; hs-V1, human V1; hs-PFC, human PFC.
Fig. 4 ∣
Fig. 4 ∣. Increase in RhoGEF proteins promotes neoteny of human synapses.
a, Abundance patterns of RhoGEFs in the turquoise module across species. b, Immunofluorescence intensity of ARHGEF7 at DLG4 loci in developing human and mouse neocortex (n = 3, 3, 3 and 3 samples; scale bars, 2 μm). Data are presented as mean values. The P values were obtained from unpaired two-tailed t-test; **P < 0.01. c, Immunostaining of dendrites from primary human cortical neurons cultured 6 weeks in vitro. Neurons were transfected with mEGFP-C1 and vectors expressing mCherry, mCherry–ARHGEF7 or mCherry–RASGRF2 (n = 20, 20 or 20 neurons, respectively, from 4 cultures; scale bars, 5 μm). Data are presented as mean values ± s.e.m. The P values were obtained from one-way ANOVA with Holm–Sidak’s multiple comparisons test; **P < 0.01, ****P < 0.0001; NS, not significant. d, Miniature excitatory postsynaptic current recording of primary human cortical neurons cultured 6 weeks in vitro. Neurons were transfected with mEGFP-C1 and vectors expressing mCherry, mCherry–ARHGEF7 or mCherry–RASGRF2 (n = 20, 17 or 18 neurons, respectively, from 8 cultures). Box plot centre, median; hinges, the 25th and 75th percentiles; whiskers, 1.5 × interquartile range. The P values were obtained from Kruskal–Wallis test with Dunn’s multiple comparisons test; *P < 0.05, **P < 0.01. e, Immunostaining against surface GRIA1 of dendrites from primary human cortical neurons cultured 6 weeks in vitro. Neurons were transfected with mEGFP-C1 and vectors expressing mCherry, mCherry–ARHGEF7 or mCherry-RASGRF2 (n = 14, 15 or 15 neurons, respectively, from 3 cultures; scale bar, 5 μm). Data are presented as mean values ± s.e.m. The P values were obtained from one-way ANOVA with Holm–Sidak’s multiple comparisons test; ***P < 0.001.
Fig. 5 ∣
Fig. 5 ∣. Association of human PSD modules with cognitive functions and brain disorders.
a, Enrichment of common variants associated with human cognitive functions in PSD modules. The numbers indicate the MAGMA linear regression coefficient β. The P values were obtained from MAGMA analysis on genome-wide association study (GWAS) summary statistics; the blue borders denote that the Benjamini–Hochberg-adjusted P value is <0.05. b, Enrichment of neuronal activity-dependent proteins in PSD modules. The numbers indicate the odds ratio. TTX, tetrodotoxin; BIC, bicuculine. The P values were obtained from hypergeometric test; the blue borders denote that the Benjamini–Hochberg-adjusted P value is <0.05. c, Distribution of gnomAD LOEUF scores and missense z-scores of genes in each category (n = 265, 313, 402, 224, 561, 1,765 and 12,892 genes). Box plot centre, median; hinges, the 25th and 75th percentiles; whiskers, 1.5 × interquartile range. The P values were obtained from Kruskal–Wallis test with Dunn’s multiple comparisons test. d, Enrichment of de novo variants associated with neurodevelopmental disorders in PSD modules. The numbers indicate the odds ratio. PTV, protein-truncating variant. The P values were obtained from hypergeometric test; the blue borders denote that the Benjamini–Hochberg-adjusted P value is <0.05. e, Enrichment of common variants associated with psychiatric disorders in PSD modules. The numbers indicate the MAGMA linear regression coefficient β. The P values were obtained from MAGMA analysis on GWAS summary statistics; the blue borders denote that the Benjamini–Hochberg-adjusted P value is <0.05. f, Enrichment of misexpressed genes after the onset of psychiatric disorders in PSD modules. The numbers indicate the odds ratio. The P values were obtained from hypergeometric test; the blue borders denote that the Benjamini–Hochberg-adjusted P value is <0.05. DD, developmental delay; ASD, autism spectrum disorder; ID, intellectual disability; SCZ, schizophrenia; BPD, bipolar disorder; ADHD, attention-deficit hyperactivity disorder; MDD, major depressive disorder.

References

    1. Südhof TC Towards an understanding of synapse formation. Neuron 100, 276–293 (2018). - PMC - PubMed
    1. Schmidt ERE & Polleux F Genetic mechanisms underlying the evolution of connectivity in the human cortex. Front. Neural Circuits 15, 787164 (2022). - PMC - PubMed
    1. Zoghbi HY & Bear MF Synaptic dysfunction in neurodevelopmental disorders associated with autism and intellectual disabilities. Cold Spring Harb. Perspect. Biol 4, a009886 (2012). - PMC - PubMed
    1. Frankle WG, Lerma J & Laruelle M The synaptic hypothesis of schizophrenia. Neuron 39, 205–216 (2003). - PubMed
    1. Shankar GM & Walsh DM Alzheimer’s disease: synaptic dysfunction and Aβ. Mol. Neurodegener 4, 964075 (2009). - PMC - PubMed

Publication types

MeSH terms

Substances