. 2023 Oct;622(7981):156-163.
doi: 10.1038/s41586-023-06555-x. Epub 2023 Sep 13.

A foundation model for generalizable disease detection from retinal images

Collaborators, Affiliations

A foundation model for generalizable disease detection from retinal images

Yukun Zhou et al. Nature. 2023 Oct.

Abstract

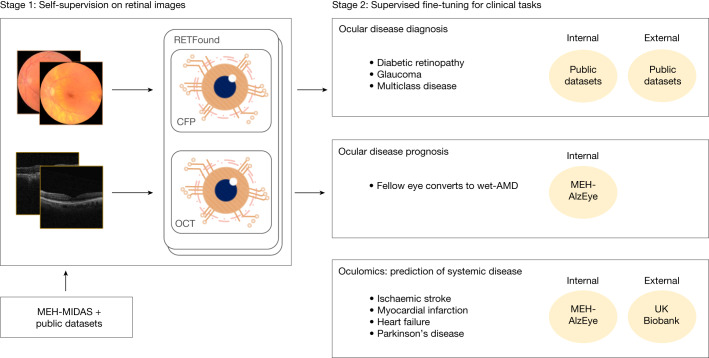
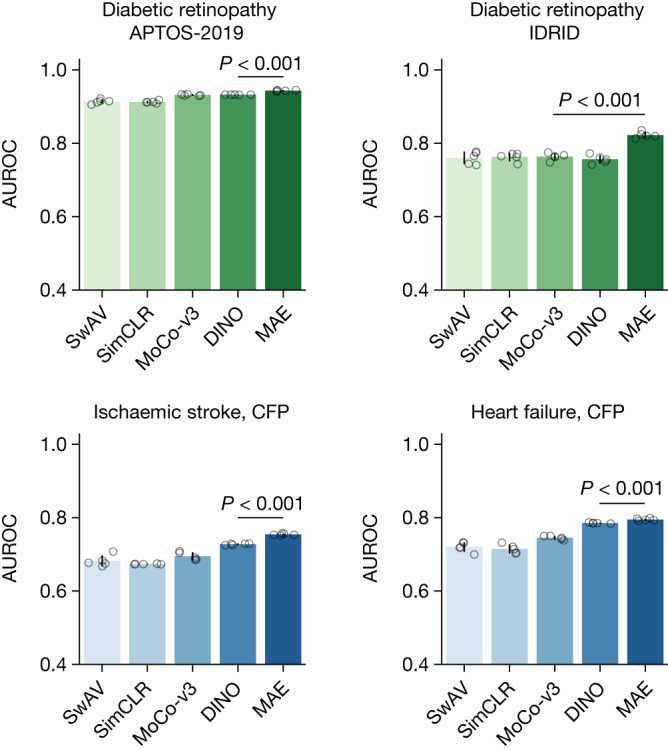
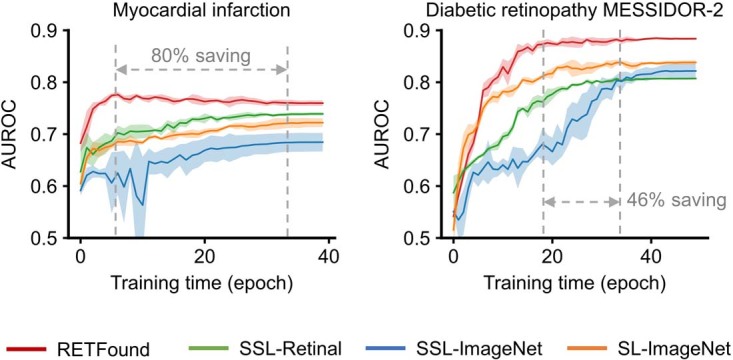
Medical artificial intelligence (AI) offers great potential for recognizing signs of health conditions in retinal images and expediting the diagnosis of eye diseases and systemic disorders1. However, the development of AI models requires substantial annotation and models are usually task-specific with limited generalizability to different clinical applications2. Here, we present RETFound, a foundation model for retinal images that learns generalizable representations from unlabelled retinal images and provides a basis for label-efficient model adaptation in several applications. Specifically, RETFound is trained on 1.6 million unlabelled retinal images by means of self-supervised learning and then adapted to disease detection tasks with explicit labels. We show that adapted RETFound consistently outperforms several comparison models in the diagnosis and prognosis of sight-threatening eye diseases, as well as incident prediction of complex systemic disorders such as heart failure and myocardial infarction with fewer labelled data. RETFound provides a generalizable solution to improve model performance and alleviate the annotation workload of experts to enable broad clinical AI applications from retinal imaging.


Conflict of interest statement

P.A.K. has acted as a consultant for DeepMind, Roche, Novartis, Apellis and BitFount, and is an equity owner in Big Picture Medical. He has received speaker fees from Heidelberg Engineering, Topcon, Allergan and Bayer.

Figures

Fig. 1
Fig. 1. Schematic of development and evaluation of the foundation models (RETFound).
Stage one constructs RETFound by means of SSL, using CFP and OCT from MEH-MIDAS and public datasets. Stage two adapts RETFound to downstream tasks by means of supervised learning for internal and external evaluation.
Fig. 2
Fig. 2. Performance on ocular disease diagnostic classification.
a, Internal evaluation. Models are adapted to each dataset by fine-tuning and internally evaluated on hold-out test data in the tasks of diagnosing ocular diseases, such as diabetic retinopathy and glaucoma. The disease category and dataset characteristics are listed in Supplementary Table 1. b, External evaluation. Models are fine-tuned on one diabetic retinopathy dataset and externally evaluated on the others. c, Performance on ocular disease prognosis. The models are fine-tuned to predict the conversion of fellow eye to wet-AMD in 1 year and evaluated internally. RETFound performs best in all tasks. For each task, we trained the model with five different random seeds, determining the shuffling of training data, and evaluated the models on the test set to get five replicas. We derived the statistics with the five replicas. The error bars show 95% CI and the bar centre represents the mean value of the AUROC. We compare the performance of RETFound with the most competitive comparison model to check whether statistically significant differences exist. P value is calculated with the two-sided t-test and listed in the figure.
Fig. 3
Fig. 3. Performance on 3-year incidence prediction of systemic diseases with retinal images.
a, Internal evaluation. Models are adapted to curated datasets from MEH-AlzEye by fine-tuning and internally evaluated on hold-out test data. b, External evaluation. Models are fine-tuned on MEH-AlzEye and externally evaluated on the UK Biobank. Data for internal and external evaluation are described in Supplementary Table 2. Although the overall performances are not high due to the difficulty of tasks, RETFound achieved significantly higher AUROC in all internal evaluations and most external evaluations. For each task, we trained the model with five different random seeds, determining the shuffling of training data, and evaluated the models on the test set to get five replicas. We derived the statistics with the five replicas. The error bars show 95% CI and the bar centre represents the mean value of the AUROC. We compare the performance of RETFound with the most competitive comparison model to check whether statistically significant differences exist. P value is calculated with the two-sided t-test and listed in the figure.
Fig. 4
Fig. 4. Label efficiency in exemplary applications.
Label efficiency measures the performance with different fractions of training data to understand the amount of data required to achieve a target performance level. The dashed grey lines highlight the difference in training data between RETFound and the most competitive comparison model. RETFound performs better than the comparison groups with 10% of training data in 3-year incidence prediction of heart failure and myocardial infarction with modality of CFP and comparable to other groups with 45% of data in diabetic retinopathy MESSIDOR-2 and 50% of data on IDRID. The 95% CI of AUROC are plotted in colour bands and the centre points of the bands indicate the mean value of AUROC.
Fig. 5
Fig. 5. Comparison of different SSL strategies in RETFound framework on exemplar applications.
We show AUROC of predicting diabetic retinopathy, ischaemic stroke and heart failure by the models pretrained with different SSL strategies, including the masked autoencoder (MAE), SwAV, SimCLR, MoCo-v3 and DINO. The data for systemic disease tasks come from the MEH-AlzEye dataset. RETFound with MAE achieved significantly higher AUROC in most tasks. The corresponding quantitative results for the contrastive SSL approaches are listed in Supplementary Table 4. For each task, we trained the model with five different random seeds, determining the shuffling of training data, and evaluated the models on the test set to get five replicas. We derived the statistics with the five replicas. The error bars show 95% CI and the bar centre represents the mean value of the AUPR. We compare the performance of RETFound with the most competitive comparison model to check whether statistically significant differences exist. P value is calculated with the two-sided t-test and listed in the figure.
Extended Data Fig. 1
Extended Data Fig. 1. Illustration of training pipeline of RETFound and comparison baselines.
The compared baselines include SL-ImageNet, SSL-ImageNet, and SSL-Retinal. SL-ImageNet trains the model via supervised learning on ImageNet-21k (14 million images and categorical labels); SSL-ImageNet trains the model on ImageNet-1k (1.4 million images) via SSL; SSL-Retinal trains the model on retinal images via SSL from scratch; RETFound trains the model on retinal images via SSL from the weights of SSL-ImageNet. *kayak picture is used to illustrate the method pipeline.
Extended Data Fig. 2
Extended Data Fig. 2. Performance (AUPR) on ocular disease diagnostic classification.
a, internal evaluation, models are adapted to each dataset via fine-tuning and internally evaluated on hold-out test data. The dataset details are listed in Supplementary Table 1. b, external evaluation, models are fine-tuned on one diabetic retinopathy dataset and externally evaluated on the others. c, performance on ocular disease prognosis. The models are fine-tuned to predict the conversion of fellow eye to wet-AMD in 1 year and evaluated internally. For each task, we trained the model with 5 different random seeds, determining the shuffling of training data, and evaluated the models on the test set to get 5 replicas. We derived the statistics with the 5 replicas. The error bars show 95% confidence intervals and the bars’ centre represents the mean value of the AUPR. We compare the performance of RETFound with the most competitive comparison model to check if statistically significant differences exist. p-value is calculated with the two-sided t-test and listed in the figure.
Extended Data Fig. 3
Extended Data Fig. 3. Performance (AUPR) on 3-year incidence prediction of systemic diseases with retinal images.
a, internal evaluation, models are adapted to curated datasets from MEH-AlzEye via fine-tuning and internally evaluated on hold-out test data. b, external evaluation, models are fine-tuned on MEH-AlzEye and externally evaluated on UK Biobank. Data for internal and external evaluation is described in Supplementary Table 2. For each task, we trained the model with 5 different random seeds, determining the shuffling of training data, and evaluated the models on the test set to get 5 replicas. We derived the statistics with the 5 replicas. The error bars show 95% confidence intervals and the bars’ centre represents the mean value of the AUPR. We compare the performance of RETFound with the most competitive comparison model to check if statistically significant differences exist. p-value is calculated with the two-sided t-test and listed in the figure.
Extended Data Fig. 4
Extended Data Fig. 4. Adaptation efficiency in exemplar applications.
Adaptation efficiency refers to the time required to achieve training convergence. We show the performance on validation sets with the same hyperparameters such as learning rate. The gray dash lines highlight the time point when the model checkpoint is saved and the time difference between RETFound and the most competitive comparison model is calculated. RETFound saves 80% of training time in adapting to 3-year incidence prediction of myocardial infarction and 46% in diabetic retinopathy MESSIDOR-2. 95% confidence intervals of AUROC are plotted in colour bands and the mean values are shown as centre lines.
Extended Data Fig. 5
Extended Data Fig. 5. Comparison of different SSL strategies in RETFound framework.
We show AUROC of predicting ocular diseases and systemic diseases by the models pretrained with different SSL strategies, including the masked autoencoder (MAE), SwAV, SimCLR, MoCo-v3, and DINO. The corresponding quantitative results for the contrastive SSL approaches are listed in Supplementary Table 4. For each task, we trained the model with 5 different random seeds, determining the shuffling of training data, and evaluated the models on the test set to get 5 replicas. We derived the statistics with the 5 replicas. The error bars show 95% confidence intervals and the bars’ centre represents the mean value of the AUPR. We compare the performance of RETFound with the most competitive comparison model to check if statistically significant differences exist. p-value is calculated with the two-sided t-test and listed in the figure.
Extended Data Fig. 6
Extended Data Fig. 6. Qualitative results of RETFound.
a, Reconstructed colour fundus photographs and optical coherent tomography scans from highly masked images in pretext task. Although with few patches visible, RETFound infers the retina-specific anatomical structures (e.g. optic nerve and retinal nerve fibre layer) and disease lesions, which are markers for multiple diseases. b, Heatmaps highlighting the areas that contribute to the classification of the models in various downstream tasks. Red colour indicates high contribution. The well-defined pathologies of ocular diseases are identified and used for classification. For the prediction of systemic diseases, some anatomical structures associated with systemic conditions, e.g. optic nerve and vasculature on CFP and ganglion cell layer and macular area on OCT, are highlighted.
Extended Data Fig. 7
Extended Data Fig. 7. Performance on various age distributions in predicting myocardial infarction.
The disease group remains unchanged (mean value of age is 72.1) while the four control groups are sampled with various age distributions (mean values of age are respectively 66.8, 68.5, 70.4, and 71.9). The X axis shows the age difference between disease group and control groups. With each control group, we evaluate the performance of predicting myocardial infarction. The performance of RETFound remains robust to age difference while that of compared models drops when the age difference decreases. Logistic regression uses age as input. The logistic regression performs well when age difference is large (about 6) but clearly worse than SSL models when the difference becomes smaller. 95% confidence intervals are plotted in colour bands and the mean value of performances are shown as the band centres.
Extended Data Fig. 8
Extended Data Fig. 8. Reliability diagrams and expected calibration error (ECE) for prediction models.
Reliability diagrams measure the consistency between the prediction probabilities of an event (e.g. myocardial infarction) with the actual chance of observing the event. The dashed line (diagonal line) indicates a perfectly calibrated model and the deviation represents the miscalibration. RETFound is closest to diagonal lines and the ECE is lowest among all models.
Extended Data Fig. 9
Extended Data Fig. 9. Performance in predicting heart failure across ethnicities.
We show AUROC of predicting 3-year heart failure in subsets with different ethnicity, including White, Asian or Asian British, and Black or Black British subgroups, the three largest major categories of ethnicity as described by the UK Government’s Office for National Statistics. Data is from MEH-AlzEye test set. The first column shows the performance on all test data, followed by results on three subgroups. The cohort quantity is listed in titles. We trained the model with 5 different random seeds, determining the shuffling of training data, and evaluated the models on the test set to get 5 replicas. We derived the statistics with the 5 replicas. The error bars show 95% confidence intervals and the bars’ centre represents the mean value of the AUPR. We compare the performance of RETFound with the most competitive comparison model to check if statistically significant differences exist. p-value is calculated with the two-sided t-test and listed in the figure.
Extended Data Fig. 10
Extended Data Fig. 10. Performance in predicting myocardial infarction across ethnicities.
We show AUROC of predicting 3-year myocardial infarction in subsets with different ethnicity. Data is from MEH-AlzEye test set. The first column shows the performance on all test data, followed by results on White, Asian or Asian British, and Black or Black British cohorts. The cohort quantity is listed in titles. We trained the model with 5 different random seeds, determining the shuffling of training data, and evaluated the models on the test set to get 5 replicas. We derived the statistics with the 5 replicas. The error bars show 95% confidence intervals and the bars’ centre represents the mean value of the AUPR. We compare the performance of RETFound with the most competitive comparison model to check if statistically significant differences exist. p-value is calculated with the two-sided t-test and listed in the figure.
Extended Data Fig. 11
Extended Data Fig. 11. Performance in predicting ischaemic stroke across ethnicities.
We show AUROC of predicting 3-year ischaemic stroke in subsets with different ethnicity. Data is from MEH-AlzEye test set. The first column shows the performance on all test data, followed by results on White, Asian or Asian British, and Black or Black British cohorts. The cohort quantity is listed in titles. We trained the model with 5 different random seeds, determining the shuffling of training data, and evaluated the models on the test set to get 5 replicas. We derived the statistics with the 5 replicas. The error bars show 95% confidence intervals and the bars’ centre represents the mean value of the AUPR. We compare the performance of RETFound with the most competitive comparison model to check if statistically significant differences exist. p-value is calculated with the two-sided t-test and listed in the figure.

References

    1. Rajpurkar, P., Chen, E., Banerjee, O. & Topol, E. J. AI in health and medicine. Nat. Med.10.1038/s41591-021-01614-0 (2022). - PubMed
    1. Willemink MJ, et al. Preparing medical imaging data for machine learning. Radiology. 2020;295:4–15. doi: 10.1148/radiol.2020192224. - DOI - PMC - PubMed
    1. Topol EJ. High-performance medicine: the convergence of human and artificial intelligence. Nat. Med. 2019;25:44–56. doi: 10.1038/s41591-018-0300-7. - DOI - PubMed
    1. Yu K-H, Beam AL, Kohane IS. Artificial intelligence in healthcare. Nat. Biomed. Eng. 2018;2:719–731. doi: 10.1038/s41551-018-0305-z. - DOI - PubMed
    1. Liu X, et al. A comparison of deep learning performance against health-care professionals in detecting diseases from medical imaging: a systematic review and meta-analysis. Lancet Digit. Health. 2019;1:e271–e297. doi: 10.1016/S2589-7500(19)30123-2. - DOI - PubMed

Publication types

MeSH terms