. 2023 Sep;621(7979):602-609.
doi: 10.1038/s41586-023-06519-1. Epub 2023 Sep 13.

A vertebral skeletal stem cell lineage driving metastasis

Affiliations

A vertebral skeletal stem cell lineage driving metastasis

Jun Sun et al. Nature. 2023 Sep.

Abstract

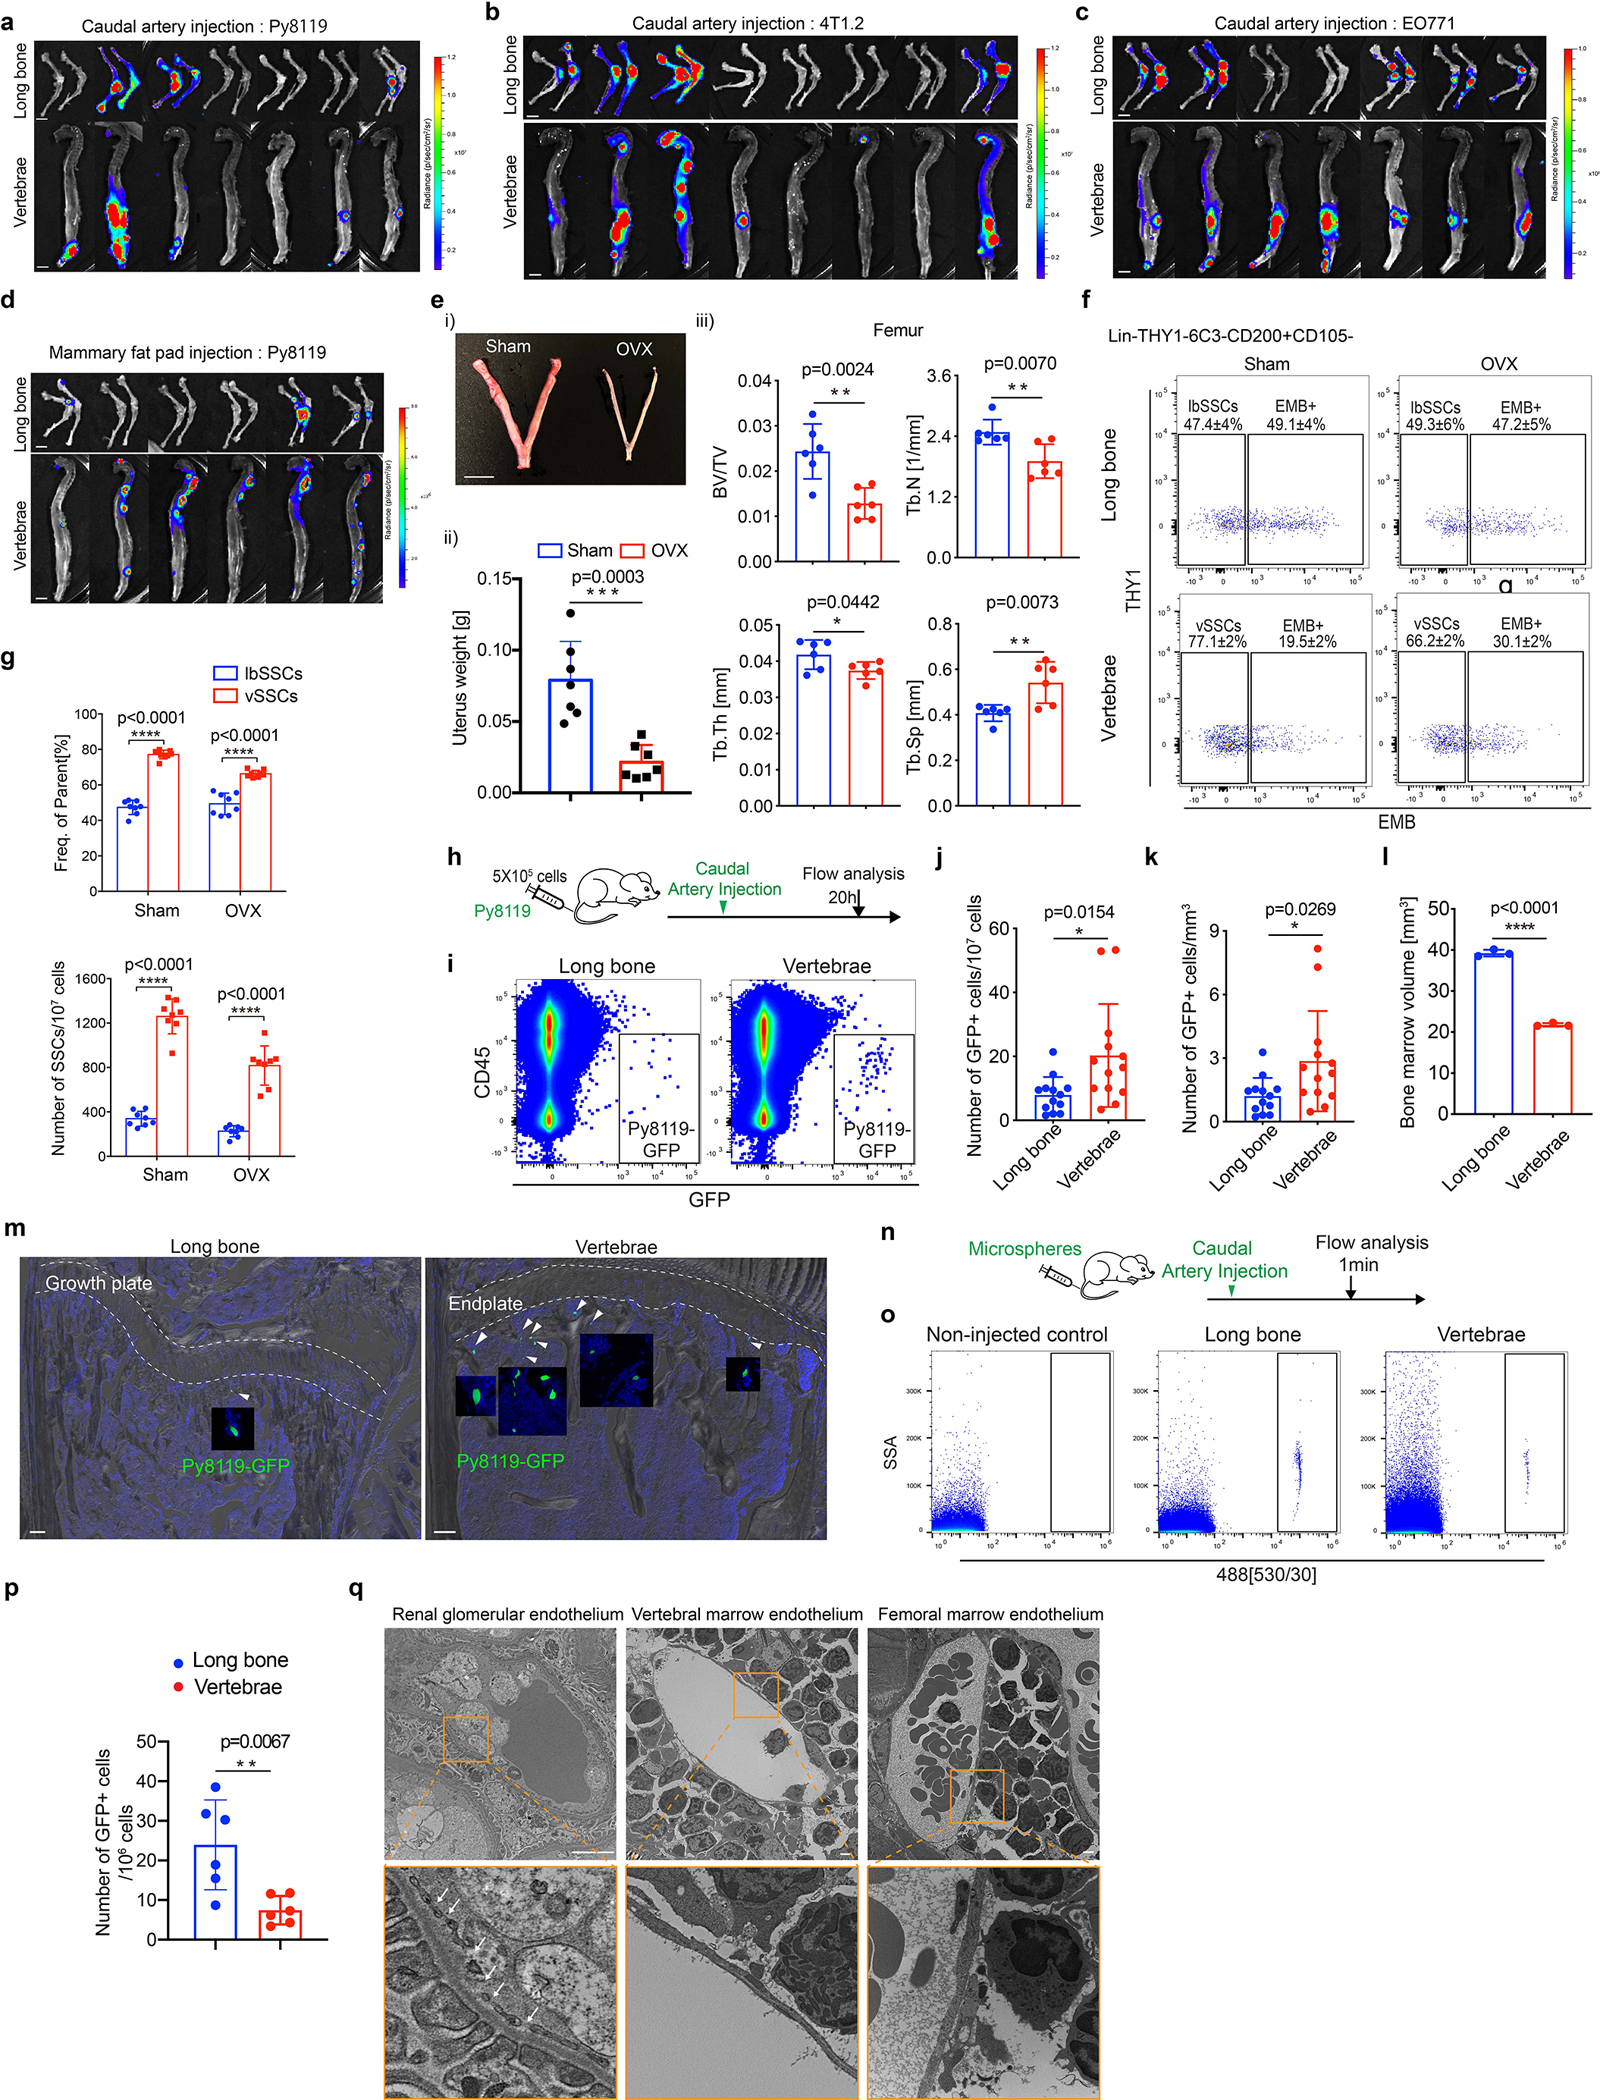
Vertebral bone is subject to a distinct set of disease processes from long bones, including a much higher rate of solid tumour metastases1-4. The basis for this distinct biology of vertebral bone has so far remained unknown. Here we identify a vertebral skeletal stem cell (vSSC) that co-expresses ZIC1 and PAX1 together with additional cell surface markers. vSSCs display formal evidence of stemness, including self-renewal, label retention and sitting at the apex of their differentiation hierarchy. vSSCs are physiologic mediators of vertebral bone formation, as genetic blockade of the ability of vSSCs to generate osteoblasts results in defects in the vertebral neural arch and body. Human counterparts of vSSCs can be identified in vertebral endplate specimens and display a conserved differentiation hierarchy and stemness features. Multiple lines of evidence indicate that vSSCs contribute to the high rates of vertebral metastatic tropism observed in breast cancer, owing in part to increased secretion of the novel metastatic trophic factor MFGE8. Together, our results indicate that vSSCs are distinct from other skeletal stem cells and mediate the unique physiology and pathology of vertebrae, including contributing to the high rate of vertebral metastasis.


Figures

Extended Data Fig. 1 |
Extended Data Fig. 1 |. Evaluation of potential vertebral lineage markers and screening of SSC cell surface markers.
a, Representative fluorescence images of vertebrae and long bone from Prrx1-cre mTmG, Pax7-cre mTmG, Mpz-cre mTmG and Shh-cre ai9 male mice at P1. NP, nucleus pulposus. n=2 for each mouse line. Scale bar, 100 μm. b, Gating strategy for FACS of SSCs in long bones (lbSSCs) and candidate SSCs in vertebrae (candidate vSSCs). c, Representative flow cytometry plots of SSCs from P1 or P7 mice showing that most SSCs are Tie2-CD51+. Plots are representative of 3 independent experiments. d, Flow cytometry for the contribution of different cre lineage cells from P1 male mice to lbSSCs or candidate vSSCs. n=2 for Mpz-cre mTmG and Shh-cre lines, n=3 for Prrx1-cre mTmG, Pax7-cre lines. e, Clustering heatmap showing the differentially expressed genes in candidate vSSCs (Lin-THY1–6C3-CD200+CD105-) versus lbSSCs (Lin-THY1–6C3-CD200+CD105-). Each column represents one gene, and each row represents one sample. f, Principal component analysis (PCA) of RNA-Seq following FACS of Lin-THY1–6C3-CD200+CD105- populations from the vertebrae (candidate vSSCs) and long bone(lbSSCs) of P10 mice. g, Representative flow cytometry plots showing the expression of different surface makers in lbSSCs and candidate vSSCs from WT mice (i, 3-week-old male; ii, 4-week-old male; iii, 2.5-week-old male; iv, 5-week-old male). n=3.
Extended Data Fig. 2 |
Extended Data Fig. 2 |. Identification of vSSC markers.
a, Representative flow cytometry plots showing EMB expression in SSCs (Lin-THY1–6C3-CD200+CD105-CD51+) at E16.5 (n=4), P1 (n=5), P7 (n=5), 1-month-old (n=8), 4-month-old (n=5), 6-month-old (n=3) or 1-year-old (n=6) male mice. Data are presented as mean±s.d. b, Principal component analysis (PCA) of RNA-seq following FACS of Lin-THY1–6C3-CD200+CD105-EMB+ and Lin-THY1–6C3-CD200+CD105-EMB- populations from the vertebrae and long bones of P10 mice. c, RNA-seq analysis using a Violin plot showing the expression of Alpl, Spp1, Col10a1, Ihh, Sp7, Runx2 and Col2a1 in EMB- candidate vSSCs and EMB+ candidate vSSCs. n=4, data are presented as mean±s.d., two-tailed unpaired t test. d, Immunostaining for EMB and COL10A1 on thoracic vertebrae (T10) from Ocn-cre mTmG male mice at 1-month of age. Data are representative of two independent experiments. Scale bar, 100 μm. e, f, Immunofluorescence staining for COL10A1, EMB and OPN on P10 mouse vertebrae (e) and tibia (f) sections, showing the expression of EMB in osteoblasts and hypertrophic chondrocytes. Images are representative of two independent experiments. Scale bar, 50 μm. g, Flow cytometry of 4-week-old male Ocn-cre mTmG vertebral cells. n=5 mice. Data are presented as mean±s.d. In the histogram pictures, grey peaks represent FMO control cells for EMB staining and red peaks represent GFP+lbSSCs or GFP+ Candidate vSSCs. h, Heatmap showing the top differentially expressed transcription factors in candidate vSSCs and lbSSCs. i, Violin plot showing the expression of Pax1, Zic1, Pax9, Prdm6 and Meox2 by RNA-seq in candidate vSSCs and lbSSCs isolated from P10 male mice. n=4, data are presented as mean±s.d., two-tailed unpaired t test. j, Violin plot showing the expression of Dpt, Ramp2, Avpr1a and Ropo3 by RNA-seq in candidate vSSCs and lbSSCs isolated from P10 male mice. n=4, data are presented as mean±s.d., two-tailed unpaired t test. k, Diagram of the approach (left) and RT-PCR analysis (right) to screen for the ability of vertebral-specific transcription factors to activate expression of vertebral reporter genes in lbSSCs. n=4, data are presented as mean±s.d., two-tailed unpaired t test.
Extended Data Fig. 3 |
Extended Data Fig. 3 |. Zic1-cre and Pax1-creERT2 label vertebrae.
a, Generation of the Zic1-cre line using CRISPR-Cas9. Structure of Zic1 locus (top), targeting vector (middle) and knock-in allele (bottom). b, DNA sequencing of the Zic1-cre knock-in region. The sequence of the knock-in element is labeled in red. c, Generation of Pax1-creERT2 line using CRISPR-Cas9. Structure of Pax1 locus (top), targeting vector (middle) and knock-in allele (bottom). d, DNA sequencing of the Pax1-creERT2 knock-in region. The sequence of knock-in element is labeled as red. e, Flow cytometry of Zic1-cre cells with mTmG reporter in vertebrae at P10. n=5. f, Immunofluorescence staining of 6-week-old male Zic1-cre mTmG mouse caudal vertebrae for Perilipin, showing the contribution of Zic1-lineage cells to marrow adipocytes. Data are representative of two independent experiments. Scale bar, 50 μm. g, Immunofluorescence staining of 6-week-old male Zic1-cre mTmG mouse lumbar vertebrae with anti-OPN antibody, showing the contribution of Zic1-cre cells to osteoblasts. Data are representative of two independent experiments. Scale bar, 50 μm. h, i, Immunofluorescence staining of 9-week-old male Zic1-cre mTmG mouse lumbar vertebrae for LEPR (h) and NESTIN (i) at day 6 post-irradiation. Mice were sublethally irradiated with 6 Gy using a Rad Source Technologies RS 2000 Biological Research X-ray Irradiator. Data are representative of three independent experiments. Scale bar, 20 μm. j, Immunofluorescence staining of P4 female Zic1-cre mTmG mouse lumbar vertebrae for COL2A1. Data are representative of two independent experiments. Scale bar, 20 μm. k, Representative fluorescence images of the cervical, thoracic, lumbar and sacral vertebrae from female Zic1-cre mTmG mice at 6-weeks of age. n=2 biological replicates. Scale bar, 100 μm. l, Immunofluorescence images of 6-month-old Pax1-creERT2 mTmG mouse lumbar vertebral section (Tamoxifen induction at P8 and P9), showing the contribution of Pax1-creERT2 cells to osteoblasts with anti-OPN antibody staining (top), and osteocyte in trabecular bone. Data are representative of three independent experiments. Scale bars, 20 μm. m, Representative fluorescence images of femurs from male Pax1-creERT2 mTmG mice after a tamoxifen pulse on P8 and P9. n=4 biological replicates. Scale bar, 100 μm. n, Representative fluorescence images of femur (left) and thymus (right) from female Pax1-creERT2 mTmG mice 2 months after 12 rounds of Tamoxifen injection beginning at 1-month of age. Data are representative of three independent experiments. Scale bars, 100 μm. o, Immunostaining of Perilipin+ adipocytes in Pax1-lineage derived bone organoids 8 weeks after intramuscular transplantation of FACS isolated Pax1-creERT2 GFP+ cells (24 hours after Tamoxifen induction at P0). n=2. Scale bars, 100 μm. p, RT-PCR analysis of Pax1, Zic1, and Emb genes in FACS isolated Zic1-lineage vSSCs, lbSSCs and vertebral CD45+ cells. n=4, data are presented as mean±s.d., one-way ANOVA followed by Tukey’s multiple comparison test. q, RT-PCR analysis of Pax1, Zic1, and Alpl genes in FACS isolated Zic1-lineage vSSCs at different stages of osteoblast differentiation in vitro, n=4, data are presented as mean±s.d., one-way ANOVA followed by Tukey’s multiple comparison test.
Extended Data Fig. 4 |
Extended Data Fig. 4 |. vSSCs are label retaining cells.
a, In vivo clonal analysis of Pax1-creERT2 cells at the vertebral endplate region in 3-month-old male mice after tamoxifen induction at 1 month. Representative of 4 biologic replicates. Scale bar, 50 μm. b, Summary diagram of label retention studies: doxycycline chow was administrated to H2B-GFP/rtTA mice to suppress de novo H2B-GFP expression starting at 8-weeks of age. Label retaining cells were analyzed 6 months after initial doxycycline treatment. c, d, Flow cytometry of H2B-GFPhi label retaining cells in the vertebrae of H2B-GFP/rtTA 8-month-old male mice before and after 6 months of doxycycline treatment. e, Diagram of label retention experiment: doxycycline food was administrated to the H2B-GFP/tTA male mice to turn on GFP expression from 4-week-old to 9-week-old and replaced with chow diet after 9-week-old to turn off GFP expression, label retaining cells were analyzed 2 months or 14 months after doxycycline treatment. f, Representative flow cytometry plots showing the total GFP+ cells in vertebrae of H2B-GFP/tTA mice at indicated time points. g-i, Flow cytometry of H2B-GFPhi label retaining cells in vertebrae of H2B-GFP/tTA mice before and after 2-month or 14-month doxycycline treatment.
Extended Data Fig. 5 |
Extended Data Fig. 5 |. Determination of vSSC stemness.
a, Schematic diagram (top) and representative flow cytometry plots (bottom) showing co-transplantation of Zic1-lineage vSSCs and lbSSCs in vivo. b, qPCR analysis of the expression levels of indicated genes in re-isolated vSSC-lineage and lbSSC-lineage cells 4 weeks after intramuscular co-transplantation. Data are presented as mean±s.d., two-tailed unpaired t test. n=6 per group. c, Representative H&E staining showing marrow recruitment in Zic1-lineage EMB+ cell-derived bone organoids 4 month after intramuscular transplantation. n=2. Scale bars, 500 μm. d, Representative Von Kossa staining for mineralized bone in Zic1-lineage EMB+ cells and Zic1-lineage vSSC-derived bone organoids 8 weeks after intramuscular transplantation. n=4. Scale bars, 500 μm. e, Immunostaining of Perilipin+ adipocytes in Zic1-lineage EMB+ cell-derived bone organoids 4 months after intramuscular transplantation. n=2. Scale bars, 500 μm. f, Representative Safranin O staining for cartilage in Zic1-lineage EMB+ cells and Zic1-lineage vSSC-derived bone organoids 2 weeks or 4 months after intramuscular transplantation. n=3. Scale bars, 200 μm. g, Immunostaining of COL2A1+ chondrocytes in Zic1-lineage EMB+ cells and Zic1-lineage vSSC-derived bone organoids 2 weeks or 4 months after intramuscular transplantation. n=2. Scale bars, 200 μm. h, Flow cytometry of the cell populations derived from Zic1-lineage/Lin-THY1–6C3-CD200+CD105-EMB+ cells after the first round (top panels) and second round (bottom panels) of intramuscular transplantation. Plots are representative of 3 independent experiments.
Extended Data Fig. 6 |
Extended Data Fig. 6 |. Deletion of key osteoblast factors in Zic1-lineage cells resulted in vertebral bone formation defects and hindlimb paralysis.
a, Representative images showing the hindlimb paralysis phenotype observed in 4-week-old male Osxzic1 mice. b, Splay reflex test showing that 4-week-old male Osxf/f mice have a normal limb splaying reflex while Osxzic1 mice display spasticity due to paraplegia. c, Whole-mount skeletal staining of 4-week-old male Osxzic1 and Osxf/f mice at the thoracolumbar region showing a bone formation defect in the dorsal vertebrae of Osxzic1 mice. n=3. Scale bar, 1 mm. d, 3D reconstruction of femur μCT from 4-week-old male Osxzic1 and Osxf/f mice. Scale bar, 100 μm. e, Quantification of bone volume/total volume (BV/TV), trabecular number (Tb.N), trabecular thickness (Tb.Th) and trabecular separation (Tb.Sp) in the femur of 4-week-old male Osxzic1 (n=5) and Osxf/f (n=6) mice. Data are mean±s.d., two-tailed unpaired t test. f, g, Calcein double labeling (f) and quantification of histomorphometric parameters (g) of the L5 vertebrae trabecular bone in 8-week-old Stat3zic1 (n=7) and Stat3f/f (n=6) female mice. Mineral apposition rate (MAR, μm/day), bone formation rate/bone surface (BFR/BS) (μm 3/ μm 2/year. Data are presented as mean ± s.d, two-tailed unpaired t test. Scale bar, 50 μm. h, i, Representative images of TRAP staining (h) and quantification (i) of No.Oc/B.Pm and Oc.S/BS of the L3 vertebrae in 8-week-old Stat3zic1 (n=8) and Stat3f/f (n=6) female mice. Osteoclast number/bone perimeter (No.Oc./B.Pm), Osteoclast surface/bone surface (Oc.S/BS). Data are presented as mean±s.d, 2-tailed unpaired t-test. Scale bar, 20 μm. j, k, Representative flow cytometry (j) and quantification (k) of arterial endothelial cells (AECs) and sinusoidal endothelial cells (SECs) in vertebrae isolated from 6-week-old Stat3zic1 (n=4) and Stat3f/f (n=4) female mice. Data are presented as mean ± s.d, two-tailed unpaired t test.
Extended Data Fig. 7 |
Extended Data Fig. 7 |. The vertebral tropism of breast cancer cells.
a, Representative bioluminescence images showing metastasis of Py8119 cells to long bones and vertebrae of 12-week-old female C57BL6/J mice 4 weeks after injection via the caudal artery. Scale bar, 5 mm. b, Representative bioluminescence images showing cancer metastasis in long bones and vertebrae of 12-week-old female BALB/c mice 4 weeks after injection of 4T1.2 cells through the caudal artery. Scale bar, 5 mm. c, Representative bioluminescence images showing cancer metastasis in long bones and vertebrae of 12-week-old female C57BL6/J mice 3 weeks after injection of EO771 cells through the caudal artery. Scale bar, 5 mm. d, Representative bioluminescence images showing cancer metastasis in long bones and vertebrae of 13-week-old NSG female mice 5 weeks after mammary fat pad injection with Py8119 cells. Scale bar, 5 mm. e, Representative image (i) and weight (ii) of the uterus and quantitative femur μCT parameters (iii) of mice 6 weeks after ovariectomy (OVX) or sham surgery. n=6 per group, data are presented as mean ± s.d, two-tailed unpaired t test. Scale bar, 5 mm. f, Representative flow cytometry plots showing SSCs (Lin-THY1–6C3-CD200+CD105-EMB-) in long bones and vertebrae of 14-week-old female C57BL6/J mice 6 weeks after OVX or sham surgery. n=8. g, Quantification of SSCs in long bones and vertebrae of 14-week-old female C57BL6/J mice 6 weeks after OVX or sham surgery. n=8. Data are presented as mean ± s.d, two-tailed unpaired t test. h, Schematic diagram of the early seeding experiment. i. Representative flow cytometry plots showing the initially seeding cancer cells in long bones and vertebrae of 8-week-old female mice after caudal artery injection. j&k, Quantification of the early seeding cancer cells (j, normalized to total cells; k, normalized to bone marrow volume) in vertebrae and long bones of 8-week-old female mice 20h after cancer cell injection. n=13, data are mean±s.d., two-tailed unpaired t test. l, Total volume of the marrow space in long bones (here, bilateral femurs and tibiae) and vertebrae (all vertebral bodies from 2nd cervical vertebra to 4th sacral vertebra) measured by μCT. n=3 per group. Data are presented as mean ± s.d, two-tailed unpaired t test. m, Representative histology images of three independent experiments showing the early seeding cancer cells in vertebrae and long bones of 8-week-old female mice. n=3. Scale bars, 100 μm. n, Diagram of the blood flow distribution experiment. o, Representative flow cytometry plots showing the microspheres in long bone and vertebrae 1min after caudal artery injection. p, Quantification of the microspheres in long bone and vertebrae 1 min after caudal artery injection. n=6 per group, data are presented as mean±s.d., two-tailed unpaired t test. q, Representative transmission electron micrographs of renal glomerular vascular endothelium, vertebral marrow endothelium and femoral marrow endothelium. n=3. Scale bars, 2 μm.
Extended Data Fig. 8 |
Extended Data Fig. 8 |. vSSCs drive breast cancer cell metastasis.
a, Representative H&E staining of adjacent frozen sections to those provided in Fig 4f showing metastatic Py8119 cells in lbSSC-enriched and vSSC-enriched bone organoids 3 weeks after cancer cell injection, scale bar 200 μm. n=2. b, The distribution of the average radiance of bone organoids 3 weeks after Py8119 cell injection through the caudal artery alongside c, histologic validation of the radiance cutoff (1×10⁵ p/s/cm2/sr) used to discriminate bone organoids with and without metastases. n=3. Scale bar 100 μm. d, Flow cytometry of skeletal cell populations derived from lbSSCs or vSSCs 4 weeks after intramuscular transplantation. n=5. e, Quantification of the indicated cell populations from lbSSC or vSSC-derived bone organoids 4 weeks after intramuscular transplantation. n=5. Data are presented as mean ± s.d, two-tailed unpaired t test. f, Representative immunostaining image (left) and quantification (right) of the number of OPN+ osteoblasts in lbSSCs and Zic1-lineage vSSC-derived bone organoids 4 weeks after intramuscular transplantation. Scale bars, 50 μm. n=12, data are presented as mean ± s.d, two-tailed unpaired t test. g, Representative bioluminescence images showing Py8119 metastasized to lbSSC-derived or vSSC-derived bone organoids 3 weeks after tumor cell injection. Scale bar, 5 mm. h, Diagram of the study of 4T1.2 metastasized to bone organoids. i, Quantification of the metastasis rate of 4T1.2 cells to lbSSC-enriched and vSSC-enriched bone organoids 3 weeks after cancer cell injection. n=42. Chi-square test. j, Representative bioluminescence images showing 4T1.2 metastasized to lbSSC-enriched or vSSC-enriched bone organoids 3 weeks after cancer cell injection. Scale bar, 5 mm. k, Diagram of the bone organoid early seeding experiment. l, Quantification of the early seeding cancer cells in lbSSC-enriched and vSSC-enriched bone organoids 20h after 4T1.2 cancer cell injection. n=10. Data are presented as mean±s.d., two-tailed unpaired t test. m. Representative flow cytometry plots showing the early seeding cancer cells in lbSSC-enriched and vSSC-enriched bone organoids 20h after cancer cell injection. n=10. n, Representative histology images of three independent experiments showing the early seeding of cancer cells in lbSSC-enriched and vSSC-enriched bone organoids 20h after 4T1.2 cancer cell injection, scale bar, 20 μm. n=3.
Extended Data Fig. 9 |
Extended Data Fig. 9 |. vSSC-lineage cells express a higher level of MFGE8 than lbSSC-lineage cells.
a, Heatmap showing the top differentially expressed secreted proteins in Zic1-lineage vSSCs versus lbSSCs. b, qPCR analysis of candidate vertebral-derived metastasis tropism factors in FACS isolated Zic1-lineage vSSCs (Lin-THY1–6C3-CD200+CD105-EMB-GFP+) and lbSSCs (Lin-THY1–6C3-CD200+CD105-EMB-). n=4, data are presented as mean±s.d., two-tailed unpaired t test. c, qPCR analysis of Ocn and Mfge8 in FACS isolated Ocn-cre GFP+ osteoblasts and SSCs from long bones and vertebrae of 4-week-old male Ocn-cre mTmG mice. n=4, data are presented as mean±s.d., two-tailed unpaired t test. d, Gating strategy for FACS of vascular endothelial cells, T cells, B cells, CD11c+ dendritic cells, neutrophils and Ly6chi monocytes from long bones and vertebrae of 8-week-old female mice. e, qPCR analysis of Mfge8 in FACS isolated vascular endothelial cells, T cells, B cells, CD11c+ dendritic cells, neutrophils and Ly6chi monocytes from long bones and vertebrae of 8-week-old female mice. n=5, data are presented as mean±s.d., two-tailed unpaired t test. f, Gating strategy for FACS of osteoclast progenitors (B220-CD117+CD115+CD11b- cells) in 8-week-old female long bones and vertebrae. g, qPCR analysis of Mfge8 in FACS isolated osteoclast progenitors from long bones and vertebrae of 8-week-old female mice. n=5, data are presented as mean±s.d., two-tailed unpaired t test. h, qPCR analysis of Mfge8 in mature osteoclasts derived from in vitro differentiation of vertebral or long bone osteoclast precursors. n=4, data are presented as mean±s.d., two-tailed unpaired t test. i&j, Representative images (i) and quantification (j) of Py8119 transwell migration in the presence of in vitro differentiated osteoblasts in the lower chamber derived from lbSSCs or vSSCs isolated from long bones or vertebrae of 3-week-old WT or Mfge8−/− mice. n=4, data are mean±s.d., two-way ANOVA followed by Tukey’s multiple comparison test.
Extended Data Fig. 10 |
Extended Data Fig. 10 |. MFGE8 mediates breast cancer metastatic tropism.
a, Representative images (left) and quantification (right) of PC3 transwell migration in the presence of MFGE8 at 0 ng/ml (n=5) or 1000 ng/ml (n=6) in the lower chamber. Data are mean±s.d., two-tailed unpaired t test. b, Representative images (left) and quantification (right) of TRAMP-C2 transwell migration in the presence of MFGE8 at 0 ng/ml or 1000 ng/ml in the lower chamber. n=5, data are mean±s.d., two-tailed unpaired t test. c, Representative images (left) and quantification (right) of HKP1 transwell migration in the presence of MFGE8 at 0 ng/ml or 1000 ng/ml in the lower chamber. n=5, data are mean±s.d., two-tailed unpaired t test. d, Representative images (left) and quantification (right) of TRAMP-C2 transwell migration in the presence of bone marrow stromal cells isolated from long bones or vertebrae of 3-week-old WT or Mfge8−/− female mice in the lower chamber. n=5, data are mean±s.d., two-way ANOVA followed by Tukey’s multiple comparison test. e, Representative images (left) and quantification (right) of HKP1 transwell migration in the presence of bone marrow stromal cells isolated from long bones or vertebrae of 3-week-old WT or Mfge8−/− female mice in the lower chamber. n=5, data are mean±s.d., two-way ANOVA followed by Tukey’s multiple comparison test. f, Representative bioluminescence images showing cancer metastasis in long bones and vertebrae of 12-week-old female WT or Mfge8−/− mice 4 weeks after Py8119 cell injection through caudal artery. Scale bar, 5 mm. g, Representative flow cytometry plots showing the early seeding of cancer cells in long bone and vertebrae of 8-week-old female WT and Mfge8−/− mice 20h after cancer cell injection. h, Quantification of the early seeding of cancer cells in the vertebrae and long bones of 8-week-old female and Mfge8−/− mice 20h after cancer cell injection. n=10 per group, data are mean±s.d. Two-way ANOVA followed by Tukey’s multiple comparison test. i, Quantification of bone volume/total volume (BV/TV), trabecular number (Tb.N), trabecular thickness (Tb.Th) and trabecular separation (Tb.Sp) of L5 vertebrae in 8-week-old Mfge8−/− and WT female mice. n=4, data are presented as mean±s.d., two-tailed unpaired t test. j, Representative bioluminescence images showing metastasis of Py8119 cells to WT or Mfge8−/− vSSC-enriched bone organoids 3 weeks after caudal artery injection. Scale bar, 5 mm. k, Representative flow cytometry plots showing B2M/HLA-ABC and DiD dye647 staining in control sponge-only implants without a cellular graft 10 days after intramuscular transplantation into NSG-EGFP host mice. n=3. l, qPCR analysis of the knockdown efficiency of human MFGE8 shRNA (274, 277 and 549) in FACS isolated human vertebral cells. n=4, data are presented as mean±s.d., one-way ANOVA followed by Tukey’s multiple comparison test. m, Representative bioluminescence images of MDA231-BoM-1833 cells to shGFP or shMFGE8–274 human vSSC-derived bone organoids 3 weeks after cancer cell injection. Scale bar, 5 mm.
Fig. 1 |
Fig. 1 |. Identification of vSSC markers.
a, Representative flow cytometry of the EMB+ and EMB- fraction of lbSSCs and candidate vSSCs isolated from P10 mice. n=3. b, Flow cytometry of cells derived from EMB+ vs EMB- candidate vSSCs 7 days after mammary fat pad transplantation and organoid formation. Plots are representative of 3 independent experiments. c, Volcano plot highlighting the differentially expressed transcriptional factors in candidate vSSCs and lbSSCs (FDR<0.05). d, Representative fluorescence images of the lumbar vertebra (L3, left) and femur (right) from female Zic1-cre mTmG mice at P10. Scale bar, 100 μm. Data are representative of three independent experiments. e, Flow cytometry of mGFP+ Zic1-lineage cells within immunophenotypic SSCs (Lin-THY1–6C3-CD200+CD105-EMB- populations) in lumbar vertebrae (L1-L6) and femurs from female Zic1-cre mTmG mice at P10. n=4. g, Tracing of Pax1-lineage cells in the endplate region of Pax1-creERT2 mTmG mice after a tamoxifen pulse on P8 and P9. n=4 biological replicates. Scale bar, 50 μm. h, Flow cytometry of Pax1-creERT2 mTmG male mice 24h (n=6), 2w (n=8), 4w (n=10), or 1 year (n=5) after a tamoxifen pulse on P8 and P9. Data are mean±s.d. i, Immunofluorescence staining of P4 female Zic1-cre mTmG mouse lumbar vertebrae for PAX1, showing PAX1 expression in Zic1-lineage cells at the resting zone of vertebral endplate. Data are representative of two independent experiments. Scale bar, 20 μm.
Fig. 2 |
Fig. 2 |. vSSCs fulfill stemness criteria.
a, In vivo clonal analysis of Pax1-creERT2 cells at the vertebral endplate region in 3-month-old male mice after tamoxifen induction at 1 month. Representative of 4 biologic replicates. Scale bar, 20 μm. b, Immunostaining for PAX1 showing expression of PAX1 in H2B-GFP label retaining cells at the vertebral endplate in 8-month-old H2B-GFP/rtTA mice after 6 months of chase. Representative of 2 independent experiments. Scale bar, 50 μm. c, Flow cytometry of H2B-GFPhi cells (label retaining cells) before and after doxycycline treatment. Representative of 4 biologic replicates. d, μCT analysis of lbSSC (Lin-THY1–6C3-CD200+CD105-EMB-) and Zic1-lineage vSSC-derived bone organoids 6 weeks after intramuscular transplantation showing 3D reconstruction (left) and quantification of bone volume (right). n=7. Data are mean±s.d., two-tailed unpaired t test. Scale bar: 0.5 mm. e, Representative Von Kossa staining for mineralized bone in lbSSC and Zic1-lineage vSSC-derived bone organoids 8 weeks after intramuscular transplantation. n=4. Scale bars, 500 μm. f, Representative images of Safranin O staining for cartilage in lbSSC and Zic1-lineage vSSC-derived bone organoids 2 weeks after intramuscular transplantation. n=4. Scale bars, 200 μm. g, Representative images of H&E staining showing marrow recruitment in the bone organoids 4 month after intramuscular transplantation. n=3. Scale bars, 500 μm. h, Immunostaining of Perilipin+ adipocytes in lbSSCs and Zic1-lineage vSSC-derived bone organoids 4 months after intramuscular transplantation. n=3. Scale bars, 500 μm. i, Schematic diagram of the in vivo serial transplantation experiment. j, Flow cytometry of vSSC-derived cell populations after the first and second round of intramuscular transplantation. Plots are representative of 3 independent experiments.
Fig. 3|
Fig. 3|. vSSCs contribute to physiologic bone formation.
a, Representative X-ray images showing vertebral bone formation defects in 4-week-old male Osxzic1 mice. n=2. Scale bar, 5 mm. b, 3D reconstruction of spine μCT images from 4-week-old male Osxzic1 and Osxf/f mice. Scale bar, 5 mm. c, Dorsal view of a 3D reconstruction of thoracic and lumbar spine μCT images showing the absence of the neural arch in 4-week-old male Osxzic1 mice. Scale bar, 1 mm. d, 3D reconstruction of L5 vertebra μCT from 4-week-old male Osxzic1 and Osxf/f mice. Scale bar, 100 μm. e, Quantification of bone volume/total volume (BV/TV), trabecular number (Tb.N), trabecular thickness (Tb.Th) and trabecular separation (Tb.Sp) of L5 vertebra in 4-week-old male Osxzic1 and Osxf/f mice. n=6 per group, data are presented as mean±s.d., two-tailed unpaired t test. f, 3D reconstruction of L5 vertebrae (top) and femur (bottom) μCT from 8-week-old female Stat3zic1 and Stat3f/f mice. Scale bar, 100 μm. g, Quantification of bone volume/total volume (BV/TV), trabecular number (Tb.N), trabecular thickness (Tb.Th) and trabecular separation (Tb.Sp) of L5 vertebrae (top) and femur (bottom) in 8-week-old female Stat3zic1 and Stat3f/f mice. Stat3f/f lumbar, n=7; Stat3zic1 lumbar, n=9; Stat3f/f femur, n=6; Stat3zic1 femur, n=7. data are mean±s.d., two-tailed unpaired t test. h, 3D reconstruction of L5 vertebra (top) and femur (bottom) μCT from 8-week-old male Shn3zic1 and Shn3f/f mice. Scale bar, 100 μm. i, Quantification of bone volume/total volume (BV/TV), trabecular number (Tb.N), trabecular thickness (Tb.Th) and trabecular separation (Tb.Sp) of L5 vertebrae (top) and femur (bottom) in 8-week-old male Shn3zic1 (n=7) and Shn3f/f mice (n=8). Data are mean±s.d., two-tailed unpaired t test.
Fig. 4 |
Fig. 4 |. vSSCs drive preferential metastasis of breast cancer to the vertebrae.
a, Metastasis rates to long bones and vertebrae after caudal artery injection with Py8119 (n=32), 4T1.2 (n=30), or EO771 cells (n=25). Chi-square test. b, c, Metastasis rates to long bones and vertebrae after intracardiac (b, n=46) or mammary fat pad injection (c, n=19). Chi-square test. d, Metastasis rate to long bones and vertebrae of Sham and OVX mice after caudal artery injection of Py8119 cells, n=50 per group. Chi-square test. e, Schematic diagram of the bone organoid metastasis experiment. f, Representative images showing Py8119 (Green) metastasis to lbSSC- or vSSC-derived organoids (Red), scale bar 200 μm. g, Metastasis rate of Py8119 cells to lbSSC- or vSSC-derived bone organoids. n=40. Chi-square test. h, Metastasis rate of Py8119 cells to the vertebrae of WT (n=31) or Stat3zic1 (n=21) mice. Chi-square test. i-l, Representative images (i, k) and quantification (j, l) of Py8119 transwell migration in the presence of MFGE8 (i, j) at 0 ng/ml (n=5), 100 ng/ml (n=4) or 1000 ng/ml (n=4) or bone marrow stromal cells (k, l) isolated from WT (n=5) or Mfge8−/− (n=4) mice in the lower chamber. Data are mean±s.d., one-way (j) or two-way (l) ANOVA followed by Tukey’s multiple comparison test. m Metastasis rate of Py8119 cells to long bones and vertebrae of WT (n=51) and Mfge8−/− (n=61) mice. Chi-square test. n, Metastasis rate of Py8119 cells to WT or Mfge8−/− vSSC-enriched bone organoids. n=54. Chi-square test. o, Representative images (left) and average radiance (right) of WT (n=10) and Mfge8−/− (n=8) mice 2 weeks after Py8119 cell vertebral body injection. p, Representative images (left) showing tumor outgrowth and tumor weight (right) in WT (n=19) or Mfge8−/− (n=18) mice 4 weeks after injection. In o and p, data are mean±s.d., two-tailed unpaired t test. Scale bar: 5 mm.
Fig. 5 |
Fig. 5 |. Identification of human vSSCs.
a, H&E staining (i) and immunostaining for PAX1 and ZIC1 (ii) in a representative human endplate specimen. Images are representative of 3 independent experiments. Scale bar, (i) 50μm, (ii) 20 μm. b, Flow cytometry of human vSSCs in a human endplate specimen. Plots are representative of 5 independent experiments. c, qPCR analysis of PAX1 and ZIC1 in FACS isolated human vSSCs (n=6) and lbSSCs (Lin-THY1-B2M/HLA-ABC+CD200+CD105-EMB-, n=8). Data are presented as mean±s.d., two-tailed unpaired t test. d, μCT analysis of human vSSC derived bone organoids 6 weeks after intramuscular transplantation. n=3, scale bar 0.5 mm. e, Representative images of Von Kossa staining (left) for mineralized bone and Safranin O staining (right) for cartilage in the bone organoids derived from human vSSCs and sponge controls 6 weeks after intramuscular transplantation. n=3. Scale bars, 500 μm. f, g, Immunostaining of COL2A1+ chondrocytes (f) and OCN+ osteoblasts (g) in human vSSC-derived bone organoids 6 weeks after intramuscular transplantation. n=3. Scale bars, 100 μm. h, Schematic diagram of the in vivo serial transplantation experiment. i, Flow cytometry of human vSSC-derived cell populations after the first and second rounds of intramuscular transplantation. Plots are representative of 2 independent experiments. j, k, Representative images (j) and quantification (k) of MDA231-BoM-1833 transwell migration in the presence of the indicated concentrations of recombinant MFGE8 in the lower chamber. n=4 per group. Data are presented as mean±s.d., two-tailed unpaired t test. l, Metastasis rate of MDA231-BoM-1833 cells to shGFP or shMFGE8–274 human vSSC-derived bone organoids 3 weeks after cancer cell injection. n=34. Chi-square test. Scale bar, 5 mm.

Update of

Comment in

References

    1. Kakhki VR, Anvari K, Sadeghi R, Mahmoudian AS & Torabian-Kakhki M Pattern and distribution of bone metastases in common malignant tumors. Nucl Med Rev Cent East Eur 16, 66–69, doi:10.5603/NMR.2013.0037 (2013). - DOI - PubMed
    1. Gersing AS, Woertler K, Jungmann PM, Bollwein C & Schwaiger BJ Vertebrae, Vertebral End Plates, and Disks: Concepts and Specific Pathologies. Semin Musculoskelet Radiol 23, 489–496, doi:10.1055/s-0039-1693976 (2019). - DOI - PubMed
    1. Greenspan SL et al. Effect of recombinant human parathyroid hormone (1–84) on vertebral fracture and bone mineral density in postmenopausal women with osteoporosis: a randomized trial. Ann Intern Med 146, 326–339, doi:10.7326/0003-4819-146-5-200703060-00005 (2007). - DOI - PubMed
    1. Briasoulis E et al. Metastatic breast carcinoma confined to bone: portrait of a clinical entity. Cancer 101, 1524–1528, doi:10.1002/cncr.20545 (2004). - DOI - PubMed
    1. Debnath S et al. Discovery of a periosteal stem cell mediating intramembranous bone formation. Nature 562, 133–139, doi:10.1038/s41586-018-0554-8 (2018). - DOI - PMC - PubMed

Publication types