. 2023 Sep;55(9):2067-2082.
doi: 10.1038/s12276-023-01084-z. Epub 2023 Sep 13.

Lactobacillus-derived extracellular vesicles counteract Aβ42-induced abnormal transcriptional changes through the upregulation of MeCP2 and Sirt1 and improve Aβ pathology in Tg-APP/PS1 mice

Affiliations

Lactobacillus-derived extracellular vesicles counteract Aβ42-induced abnormal transcriptional changes through the upregulation of MeCP2 and Sirt1 and improve Aβ pathology in Tg-APP/PS1 mice

Hyejin Kwon et al. Exp Mol Med. 2023 Sep.

Abstract

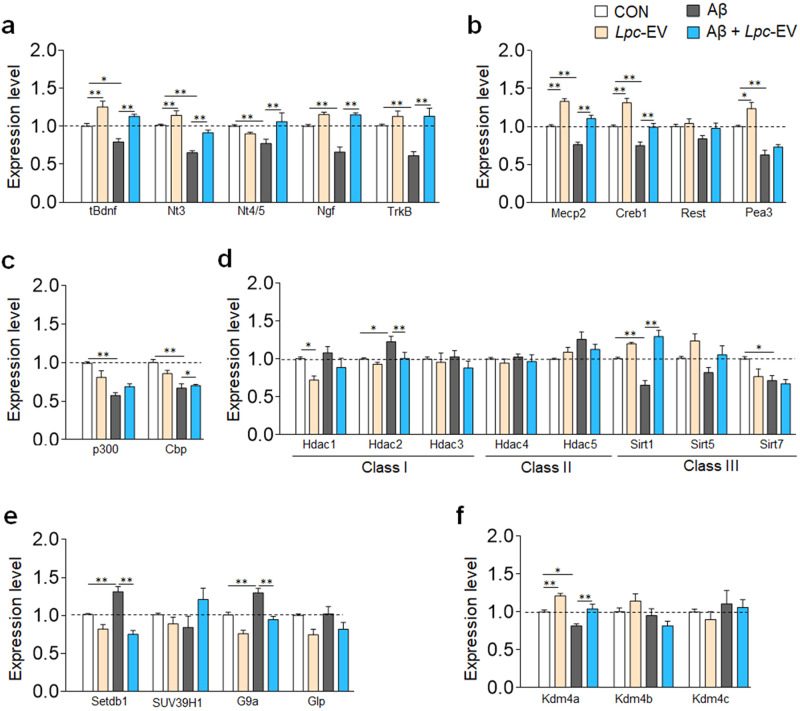
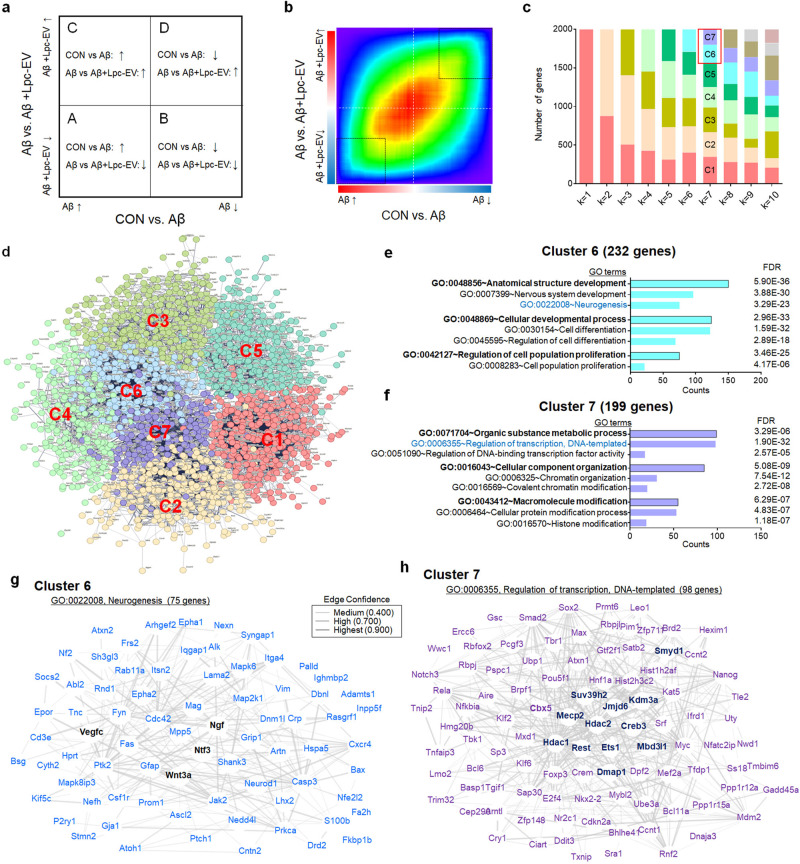
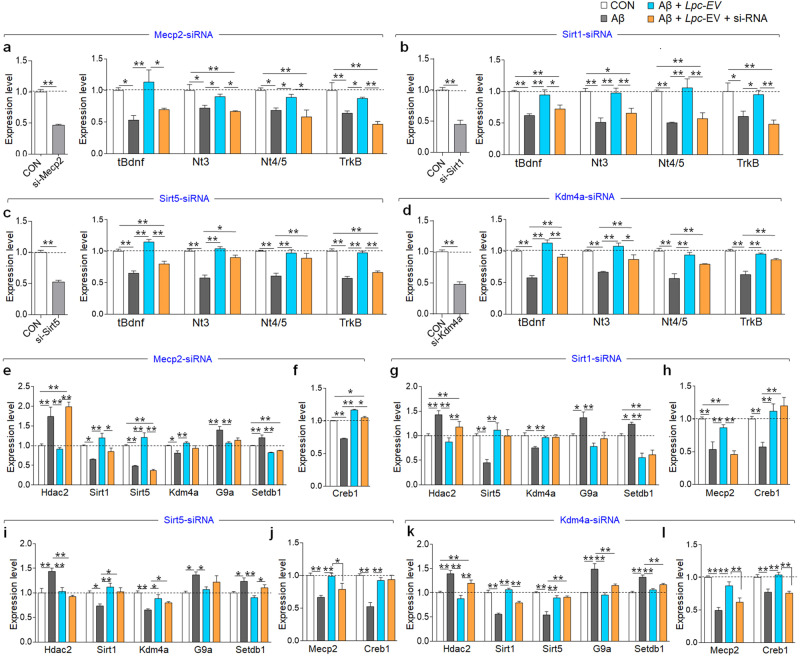
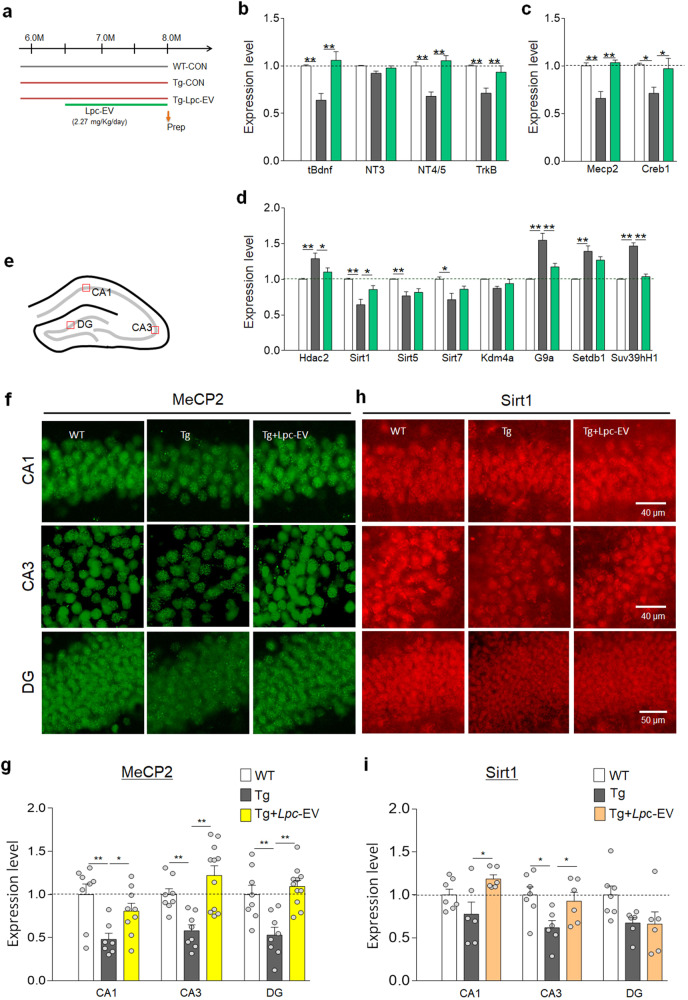
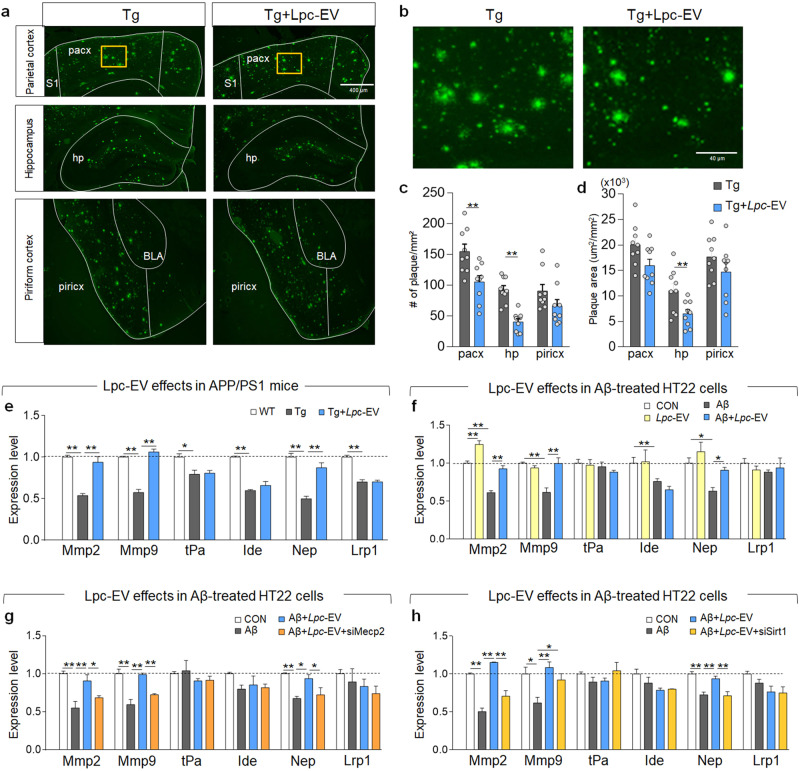
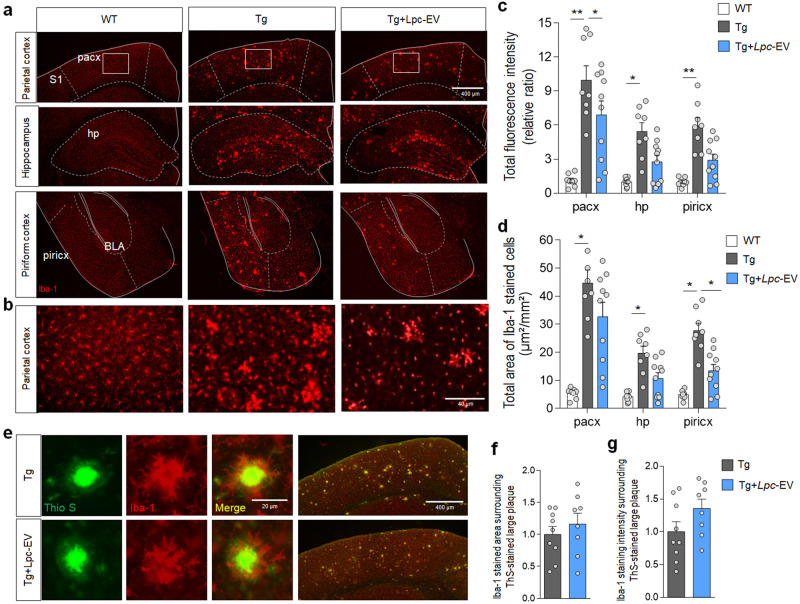
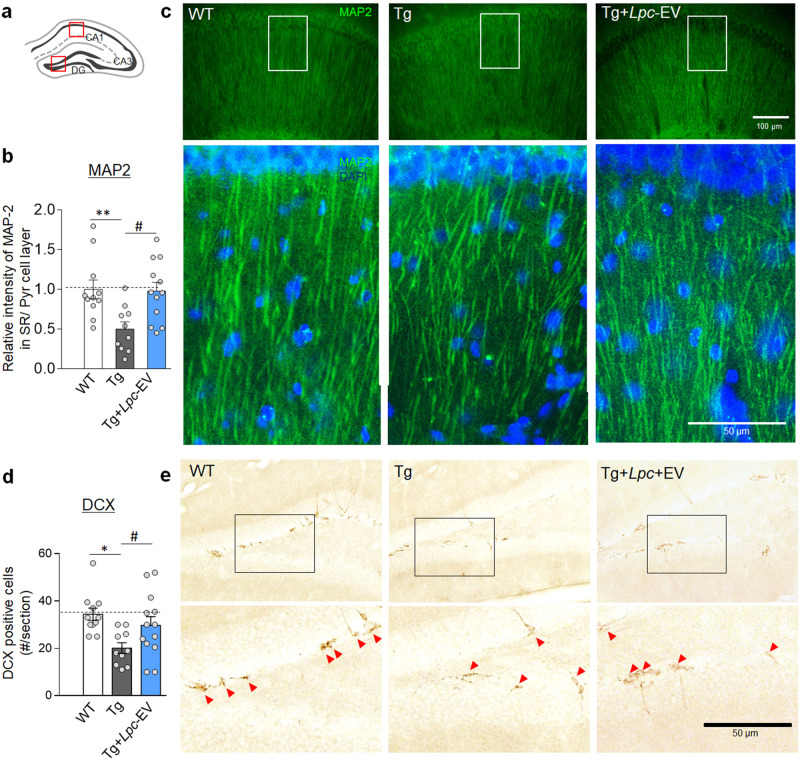
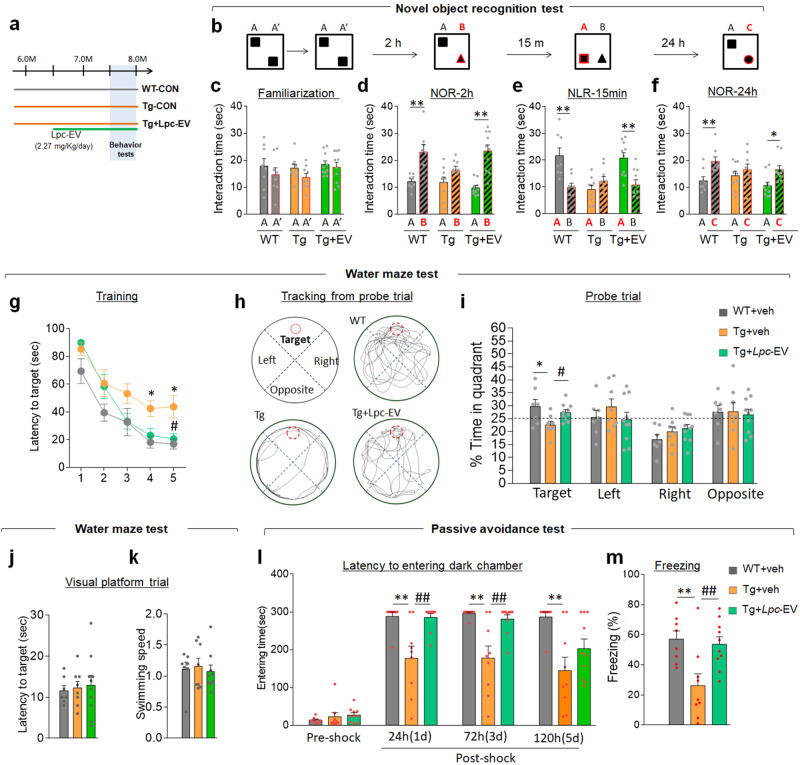
Mounting evidence suggests that probiotics are beneficial for treating Alzheimer's disease (AD). However, the mechanisms by which specific probiotics modify AD pathophysiology are not clearly understood. In this study, we investigated whether Lactobacillus paracasei-derived extracellular vesicles (Lpc-EV) can directly act on neuronal cells to modify amyloid-beta (Aβ)-induced transcriptional changes and Aβ pathology in the brains of Tg-APP/PS1 mice. Lpc-EV treatment in HT22 neuronal cells counteracts Aβ-induced downregulation of Brain-derived neurotrophic factor (Bdnf), Neurotrophin 3 (Nt3), Nt4/5, and TrkB receptor, and reverses Aβ-induced altered expression of diverse nuclear factors, including the downregulation of Methyl-CpG binding protein 2 (Mecp2) and Sirtuin 1 (Sirt1). Systematic siRNA-mediated knockdown experiments indicate that the upregulation of Bdnf, Nt3, Nt4/5, and TrkB by Lpc-EV is mediated via multiple epigenetic factors whose activation converges on Mecp2 and Sirt1. In addition, Lpc-EV reverses Aβ-induced downregulation of the Aβ-degrading proteases Matrix metalloproteinase 2 (Mmp-2), Mmp-9, and Neprilysin (Nep), whose upregulation is also controlled by MeCP2 and Sirt1. Lpc-EV treatment restores the downregulated expression of Bdnf, Nt4/5, TrkB, Mmp-2, Mmp-9, and Nep; induces the upregulation of MeCP2 and Sirt1 in the hippocampus; alleviates Aβ accumulation and neuroinflammatory responses in the brain; and mitigates cognitive decline in Tg-APP/PS1 mice. These results suggest that Lpc-EV cargo contains a neuroactive component that upregulates the expression of neurotrophic factors and Aβ-degrading proteases (Mmp-2, Mmp-9, and Nep) through the upregulation of MeCP2 and Sirt1, and ameliorates Aβ pathology and cognitive deficits in Tg-APP/PS1 mice.


Conflict of interest statement

EKK, TSS, and YKK are employed at MD Healthcare Inc. PLH provides consultancy for brain research at MD Healthcare Inc. and does not hold equity interests of MD Healthcare Inc. Parts of the expenses for this work were supported by MD Healthcare Inc. HK, EHL, SYP, JYP, and JHH declare no potential conflicts of interest.

Figures

Fig. 1
Fig. 1. Lpc-EV counteracted the Aβ42-induced altered expression of neurotrophic factors and epigenetic factors in HT22 cells.
a Expression levels of Bdnf, Nt3, Nt4/5, Ngf, and TrkB in HT22 cells treated with Aβ42 (1 μM, final) or Aβ42 plus Lpc-EV (10 μg/ml, final) for 24 h. n = 8 data points per group. Bdnf, Lpc-EV, F(1,28) = 34.94, p < 0.0001; Aβ42, F(1,28) = 11.10, p = 0.0024; interaction, F(1,28) = 0.655, p = 0.4253; Nt3, Lpc-EV, F(1,28) = 26.40, p < 0.0001; Aβ42, F(1,28) = 58.80, p < 0.0001; interaction, F(1,28) = 3.100, p = 0.0892; Nt4/5, Lpc-EV, F(1,28) = 4.432, p = 0.044; Aβ42, F(1,28) = 1.306, p = 0.2627; interaction, F(1,28) = 13.50, p = 0.001; Ngf, Lpc-EV, F(1,28) = 63.78, p < 0.0001; Aβ42, F(1,28) = 18.11, p = 0.002; interaction, F(1,28) = 17.15, p = 0.0003; and TrkB, Lpc-EV, F(1,28) = 20.93, p < 0.0001; Aβ42, F(1,28) = 7.779, p = 0.0094; interaction, F(1,28) = 7.918, p = 0.0089. bf Expression levels of Mecp2, Creb1, Rest, and Pea3 (b); p300 and Cbp (c); Hdac1, Hdac2, Hdac3, Hdac4, Hdac5, Sirt1, Sirt5, and Sirt7 (d); Setdb1, Suv39h1, G9a, and Glp (e); and Kdm4a, Kdm4b, and Kdm4c (f) in HT22 cells treated for 24 h with Aβ42 (1 μM) or Aβ42 plus Lpc-EV (10 μg/ml). n = 8 data points per group. Mecp2, Lpc-EV, F(1,28) = 106.6, p < 0.0001; Aβ42, F(1,28) = 51.84, p < 0.0001; interaction, F(1,28) = 0.6603, p = 0.8298; Creb1, Lpc-EV, F(1,28) = 37.21, p < 0.0001; Aβ42, F(1,28) = 39.40, p < 0.0001; interaction, F(1,28) = 0.5855, p = 0.4506; Rest, Lpc-EV, F(1,28) = 2.693, p = 0.1120; Aβ42, F(1,28) = 4.350, p = 0.0462; interaction, F(1,28) = 0.8738, p = 0.03579; Pea3, Lpc-EV, F(1,28) = 9.824, p = 0.0040; Aβ42, F(1,28) = 65.53, p < 0.0001; interaction, F(1,28) = 1.452, p = 0.2382; p300, Lpc-EV, F(1,28) = 0.4376, p = 0.5237; Aβ42, F(1,28) = 27.20, p < 0.0001; interaction, F(1,28) = 8.284, p = 0.0076; Cbp, Lpc-EV, F(1,28) = 2.009, p = 1674; Aβ42, F(1,28) = 36.91, p < 0.0001; interaction, F(1,28) = 4.740, p = 0.0381; Hdac1, Lpc-EV, F(1,28) = 8.986, p = 0.0056; Aβ42, F(1,28) = 2.276, p = 0.1426; interaction, F(1,28) = 0.3226, p = 0.5746; Hdac2, Lpc-EV, F(1,28) = 5.148, p = 0.0312; Aβ42, F(1,28) = 8.124, p = 0.0081; interaction, F(1,28) = 1.210, p = 0.2807; Hdac3, Lpc-EV, F(1,28) = 1.307, p = 0.2626; Aβ42, F(1,28) = 0.1064, p = 0.7468; interaction, F(1,28) = 0.2668, p = 0.6095; Hdac4, Lpc-EV, F(1,28) = 0.9985, p = 0.3262; Aβ42, F(1,28) = 0.1629, p = 0.6895; interaction, F(1,28) = 0.0017, p = 0.9674; Hdac5, Lpc-EV, F(1,28) = 0.0856, p = 0.7720; Aβ42, F(1,28) = 4.909, p = 0.0350; interaction, F(1,28) = 2.671, p = 0.1134; Sirt1, Lpc-EV, F(1,28) = 63.93, p < 0.0001; Aβ42, F(1,28) = 5.902, p = 0.0218; interaction, F(1,28) = 18.12, p = 0.0002; Sirt5, Lpc-EV, F(1,28) = 8.020, p = 0.0085; Aβ42, F(1,28) = 5.055, p = 0.0326; interaction, F(1,28) = 0.0014, p = 0.9703; Sirt7, Lpc-EV, F(1,28) = 5.081, p = 0.0322; Aβ42, F(1,28) = 9.163, p = 0.0053; interaction, F(1,28) = 2.602, p = 0.1179; Setdb1, Lpc-EV, F(1,28) = 52.37, p < 0.0001; Aβ42, F(1,28) = 4.838, p = 0.0363; interaction, F(1,28) = 12.53, p = 0.0.0014; Suv39h1, Lpc-EV, F(1,28) = 40.00, p < 0.0001; Aβ42, F(1,28) = 9.665, p = 0.0043; interaction, F(1,28) = 3.643, p = 0.0666; G9a, Lpc-EV, F(1,28) = 41.90, p < 0.0001; Aβ42, F(1,28) = 26.68, p < 0.0001; interaction, F(1,28) = 1.454, p = 0.2380; Glp, Lpc-EV, F(1,28) = 9.102, p = 0.0054; Aβ42, F(1,28) = 0.3600, p = 0.5533; interaction, F(1,28) = 1.1048, p = 0.7486; Kdm4a, Lpc-EV, F(1,28) = 28.80, p < 0.0001; Aβ42, F(1,28) = 19.34, p = 0.0001; interaction, F(1,28) = 0.0258, p = 0.8736; Kdm4b, Lpc-EV, F(1,28) = 0.0023, p = 0.9619; Aβ42, F(1,28) = 6.015, p = 0.0207; interaction, F(1,28) = 3.211, p = 0.0840; and Kdm4c, Lpc-EV, F(1,28) = 0.4177, p = 0.5234; Aβ42, F(1,28) = 1.319, p = 0.2604; interaction, F(1,28) = 0.0496, p = 0.8254. Data are presented as the mean ± SEM. *p < 0.05; **p < 0.01 (two-way ANOVA followed by the Bonferroni post hoc test).
Fig. 2
Fig. 2. Genome-wide microarray analysis identified a list of genes that were differentially expressed by Aβ42 and their altered expression was reversed by Lpc-EV.
a, b A hypothetical RROH map with up- or downregulated genes by Aβ42 or Lpc-EV (a). A hypergeometric map between the genes changed by Aβ42 (x-axis) and those by Lpc-EV (y-axis). The genes were ranked based on expression differences between two comparison groups by their log10-transformed t-test p values and plotted on the x- and y-axes (b). Quadrants A and D contained 11,003 and 9,479 transcripts, respectively. The top 20% of transcripts ranked on expression differences were selected and used for further analyses. Up and down arrows indicate upregulated and downregulated expression, respectively. c, d Serial K-means clustering of the selected genes and subsequent Gene Ontology (GO) enrichment analyses led to identify seven functional clusters (c), which were visualized by a combined PPI network (d). Clusters 6 and 7 contained functional groups of genes for neurotrophic factors (Cluster 6) and for transcription and epigenetic regulation (Cluster 7). e, h A summary of key features of Clusters 6 (e, g) and 7 (f, h). Top three functional groups assigned by GO terms in Cluster 6 (e) and the PPI of 75 genes assigned with a GO term for “neurogenesis” (g). Top three functional groups covered by GO terms in Cluster 7 (f) and the PPI of 98 genes assigned with a GO term for “regulation of transcription, DNA-templated” (h).
Fig. 3
Fig. 3. Lpc-EV counteracted the Aβ42-induced downregulation of neurotrophic factors via the upregulation of epigenetic factors in HT22 cells.
ad Expression levels of Bdnf, Nt3, Nt4/5, and TrkB in HT22 cells treated with Aβ42 (1 μM), Aβ42 plus Lpc-EV (10 μg/ml), or Aβ42 plus Lpc-EV and the indicated siRNA: siRNA-Mecp2 (a), siRNA-Sirt1 (b), siRNA-Sirt5 (c), and siRNA-Kdm4a (d). siRNA-control, siCON. n = 8 per group. siRNA-Mecp2 (a), t(14) = 19.57, p < 0.0001; tBdnf, F(3,28) = 6.796, p = 0.0063; Nt3, F(3,28) = 7.576, p = 0.0042; Nt4/5, F(3,28) = 8.263, p = 0.0030; TrkB, F(3,28) = 12.02, p = 0.0006. siRNA-Sirt1 (b), t(14) = 10.80, p < 0.0001; tBdnf, F(3,28) = 11.67, p = 0.0007; Nt3, F(3,28) = 12.06, p = 0.0006; Nt4/5, F(3,28) = 11.13, p = 0.0009; TrkB, F(3,28) = 7.572, p = 0.0042. siRNA-Sirt5 (c), t(14) = 13.15, p < 0.0001; tBdnf, F(3,28) = 34.05, p < 0.0001; Nt3, F(3,28) = 30.44, p < 0.0001; Nt4/5, F(3,28) = 12.35, p = 0.0002; TrkB, F(3,28) = 56.56, p < 0.0001. siRNA-Kdm4a (d), t(14) = 19.51, p < 0.0001; tBdnf, F(3,28) = 35.21, p < 0.0001; Nt3, F(3,28) = 15.21, p = 0.0002; Nt4/5, F(3,28) = 16.18, p = 0.0002; TrkB, F(3,28) = 26.28, p < 0.0001. el Expression of Hdac2, Sirt1, Sirt5, Setdb1, Kdm4a, G9a, Mecp2, and Creb1 in HT22 cells treated with Aβ42 (1 μM), Aβ42 plus Lpc-EV (10 μg/ml), or Aβ42 and Lpc-EV plus the indicated siRNA: siRNA-MeCP2 (e, f), siRNA-Sirt1 (g, h), siRNA-Sirt5 (i, j), and siRNA-Kdm4a (k, l). n = 8 per group. siRNA-MeCP2 (e, f); Hdac2, F(3, 28) = 15.57, p = 0.0002; Sirt1, F(3,28) = 8.921, p = 0.0022; Sirt5, F(3,28) = 42.61, p < 0.0001; Kdm4a, F(3,28) = 5.852, p = 0.0106; G9a, F(3,28) = 10.03, p = 0.0014; Setdb1, F(3,28) = 92.29, p < 0.0001; Creb1, F(3,28) = 251.8, p < 0.0001. siRNA-Sirt1 (g, h); Hdac2, F(3,28) = 8.184, p = 0.0031; Sirt5, F(3,28) = 8.068, p = 0.0033; Kdm4a, F(3,28) = 6.260, p = 0.0084; G9a, F(3,28) = 6.769, p = 0.0064; Setdb1, F(3,28) = 19.82, p < 0.0001; Mecp2, F(3,28) = 13.39, p = 0.0004; Creb1, F(3,28) = 8.748, p = 0.0024. siRNA-Sirt5 (i, j); Hdac2, F(3,28) = 10.66, p = 0.0011; Sirt1, F(3,28) = 6.476, p = 0.0074; Kdm4a, F(3,28) = 9.403, p = 0.0018; G9a, F(3,28) = 4.318, p = 0.0278; Setdb1, F(3,28) = 7.358, p = 0.0047; Mecp2, F(3,28) = 8.037, p = 0.0010; Creb1, F(3,28) = 17.04, p < 0.0001. siRNA-Kdm4a (k, l); Hdac2, F(3,28) = 14.64, p = 0.0003; Sirt1, F(3,28) = 42.24, p < 0.0001; Sirt5, F(3,28) = 19.79, p < 0.0001; G9a, F(3,28) = 14.07, p = 0.0003; Setdb1, F(3,28) = 18.06, p < 0.0001. Data are presented as the mean ± SEM. *p < 0.05; **p < 0.01 (Student’s t-test; and one-way ANOVA followed by the Newman‒Keuls post hoc test).
Fig. 4
Fig. 4. Lpc-EV treatment restored the expression of neurotrophic factors and epigenetic factors in Tg-APP/PS1 mice.
a Experimental design. Tg-APP/PS1 mice were orally administered Lpc-EV at a dose of 2.27 mg/kg/day from 6.5 months of age until sacrifice at 8 months. Arrow, time point for tissue preparation. bd Expression levels of Bdnf, Nt3, Nt4/5, and TrkB (b); Mecp2, and Creb1 (c); Hdac2, Sirt1, Sirt5, Sirt7, Kdm4a, G9a, Setdb1, and Suv39h1 (d) in the hippocampus of wild-type control (WT), Tg-APP/PS1 mice (Tg), and Tg-APP/PS1 mice treated with Lpc-EV (Tg+ Lpc-EV). N = 6 per group. tBdnf, F(2,5) = 1.41, p = 0.0010; Nt3, F(2,15) = 0.6496, p = 0.5363; Nt4/5, F(2,15) = 8.35, p < 0.0001; TrkB, F(2,15) = 0.977, p = 0.0027; Mecp2, F(2,15) = 19.26, p < 0.0001; Creb1, F(2,15) = 4.858, p = 0.0236; Hdac2, F(2,15) = 6.694, p = 0.0084; Sirt1, F(2,21) = 10.73, p = 0.0006; Sirt5, F(2,15) = 7.347, p = 0.0060; Sirt7, F(2,15) = 5.725, p = 0.0142; Kdm4a, F(2,15) = 2.872, p = 0.0879; G9a, F(2,15) = 19.53, p < 0.0001; Setdb1, F(2,15) = 15.09, p = 0.0003; Suv39h1, F(2,15) = 59.31, p < 0.0001. ei A diagram of the hippocampus and the regions examined (e). Photomicrographs showing MeCP2 (f) and Sirt1 (h) expression in CA1 and CA3 pyramidal neurons and DG neurons and their quantification levels (g, i) in wild-type control (WT), Tg-APP/PS1 mice (Tg-CON), and Tg-APP/PS1 mice treated with Lpc-EV (Tg+Lpc-EV). Scale bar, 100 μm. n = 7–11 animals. Mecp2; CA1, F(2,21) = 6.504, p = 0.0063; CA3, F(2,24) = 11.88, p = 0.0003; DG, F(2,24) = 11.83, p = 0.0003. n = 6–7 animals. Sirt1; CA1, F(2,16) = 4.694, p = 0.0249; CA3, F(2,16) = 4.605, p = 0.0263; DG, F(2,16) = 3.377, p = 0.0598. Data are presented as the mean ± SEM. *p < 0.05; **p < 0.01 (one-way ANOVA followed by the Newman‒Keuls post hoc test).
Fig. 5
Fig. 5. Lpc-EV treatment restored the Aβ42-induced downregulation of Aβ-degrading enzymes, and suppressed Aβ accumulation in Tg-APP/PS1 mice.
a, b Photomicrographs showing the thioflavin S-stained parietal cortex, hippocampus, and piriform cortex (a) of Tg-APP/PS1 mice, and Tg-APP/PS1 mice treated with Lpc-EV at 8 months of age. Higher magnification of the boxed areas in the parietal cortex (b). Lpc-EV was orally administered at a dose of 2.27 mg/kg/day, as depicted in Fig. 3A. c, d Quantification of the number of plaques (c) and total plaque area (d) in the parietal cortex, hippocampus, and piriform cortex of Tg-APP/PS1 mice, and Tg-APP/PS1 mice treated with Lpc-EV. n = 9 animals per group. Plaque numbers: CA1, t(16) = 3.122, p = 0.0066; CA3, t(16) = 5.968, p < 0.0001; DG, t(16) = 1.597, p = 0.1298. Plaque area; CA1, t(16) = 2.016, p = 0.061; CA3, t(16) = 3.034, p = 0.0079; DG, t(16) = 1.300, p = 0.2121. e Expression levels of Mmp-2, Mmp-9, tPA, Ide, Nep, and Lrp1 in the hippocampi of WT mice, Tg-APP/PS1 mice, and Tg-APP/PS1 mice treated with Lpc-EV. n = 8 animals per group. Mmp-2, F(2,21) = 43.29; p < 0.0001; Mmp-9, F(2,21) = 67.69, p < 0.0001; tPa, F(2,21) = 7.643, p = 0.0115; Ide, F(2,21) = 37.29, p < 0.0001; Nep, F(2,21) = 38.69, p < 0.0001; Lrp1, F(2,21) = 44.16, p < 0.0001. f Expression levels of Mmp-2, Mmp-9, uPA, Ide, Nep, and Lrp1 in HT22 cells (CON), HT22 cells treated with Lpc-EV (10 μg/ml), HT22 cells treated with Aβ42 (1 μM), and HT22 cells treated with Aβ42 plus Lpc-EV. n = 8 per group. Mmp-2, F(3,28) = 49.54, p < 0.0001; Mmp-9, F(3,28) = 13.13, p = 0.0004; tPa, F(3,28) = 0.9267, p = 0.4505; Ide, F(3,28) = 4.003, p = 0.0345; Nep, F(3,28) = 7.959, p = 0.0035; Lrp1, F(3,28) = 0.4260, p = 0.7380. g, h Expression levels of Mmp-2, Mmp-9, uPA, Ide, Nep, and Lrp1 in HT22 cells (CON), HT22 cells treated with Aβ42, and HT22 cells treated with Aβ42 plus the indicated siRNA; siRNA-MeCP2 (g) and siRNA-Sirt1 (h). n = 8 per group. siRNA-MeCP2; Mmp-2, F(3,28) = 10.49, p = 0.0011; Mmp-9, F(3,28) = 17.91, p < 0.0001; tPa, F(3,28) = 0.7474, p = 0.5444; Ide, F(3,28) = 1.777, p = 0.2050; Nep, F(3,28) = 8.157, p = 0.0032; Lrp1, F(3,28) = 0.9080, p = 0.4659. siRNA-Sirt1; Mmp-2, F(3,28) = 45.19, p < 0.0001; Mmp-9, F(3,28) = 6.416; p = 0.0077; tPa, F(3,28) = 1.127, p = 0.3619; Ide, F(3,28) = 3.498, p = 0.0497; Nep, F(3,28) = 12.95, p = 0.0005; Lrp1, F(3,28) = 3.338, p = 0.0561. Data are presented as the mean ± SEM. *p < 0.05; **p < 0.01 (Student’s t-test; one-way ANOVA followed by the Newman‒Keuls post hoc test; and two-way ANOVA followed by the Bonferroni post hoc test).
Fig. 6
Fig. 6. Lpc-EV treatment reduced microgliosis in the brains of Tg-APP/PS1 mice.
ad Photomicrographs showing the anti-Iba-1-stained parietal cortex (Pacx), dorsal hippocampus (dHP), and piriform cortex (Piricx) of wild-type mice (WT), Tg-APP/PS1 mice (Tg), and Tg-APP/PS1 mice treated with Lpc-EV (Tg+Lpc-EV) (a). Higher magnification of the boxed areas in the parietal cortex of the indicated groups (b). Relative ratio of total anti-Iba-1-stained fluorescent intensity (c) and total area of anti-Iba-1-stained cells (d) in the parietal cortex, dorsal hippocampus, and piriform cortex of the indicated groups. S1, somatosensory cortex 1; BLA, basolateral nucleus of amygdala. n = 8 animals for WT and Tg and 11 for Tg+Lpc-EV. Total intensity; F(2,23) = 16.17, p < 0.0001; F(2,23) = 13.85, p = 0.0001; F(2,23) = 19.43, p < 00.0001. Total anti-Iba-1-stained area; pacx, F(2,23) = 20.66, p < 00.0001; hp, F(2,23) = 14.78, p < 00.0001; piricx, F(2,23) = 28.27, p < 00.0001. eg Photomicrographs (e) showing Iba-1-stained areas of microglia (red) surrounding ThS-stained plaques (green) in the parietal cortex of Tg-APP/PS1 mice (Tg) and Tg-APP/PS1 mice treated with Lpc-EV (Tg+Lpc-EV). Relative ratio of Iba-1-stained areas (f) and the intensity of Iba-1-stained microglia (g) over plaque areas. n = 8–9 animals. Iba-1-stained area ratio; t(15) = 0.7881, p = 0.4429; Iba-1-stained intensity ratio; t(15) = 1.677, p = 0.1143. Data are presented as mean ± SEM. *p < 0.05; **p < 0.01 (Student’s t-test; and one-way ANOVA followed by the Newman‒Keuls post hoc test).
Fig. 7
Fig. 7. Lpc-EV treatment increased neurogenesis and MAP-2-stained density of hippocampal dendritic processes in Tg-APP/PS1 mice.
ac Diagram of the regions examined for immunohistochemical analyses (a). Anti-MAP2 staining levels in the stratum radiatum of the indicated groups (b). Photomicrographs showing anti-MAP2-stained dendritic processes of pyramidal neurons in the stratum radiatum (c) in the CA1 region of WT-CON, Tg-CON and Tg-Lpc-EV mice. Higher magnification (low panels) of the boxed areas (c) of the indicated groups. The red box in the CA1 of (a) is the region for the images in (c) (upper panels). n = 9–12 animals. F(2,30) = 6.385, p = 0.0049. d, e The numbers of anti-doublecortin (DCX)-positive cells in the dentate gyrus (DG) of WT-CON, Tg-CON, and Tg-Lpc-EV mice (d). Photomicrographs showing anti-doublecortin (DCX)-stained cells in the dentate gyrus of the indicated groups (e). The red box in the DG of (a) is the region for the images in (e) (upper panels). Higher magnification (lower panels) of the boxed areas (e) of the indicated groups. n = 10–13 animals. F(2,31) = 5.136, p = 0.0118. Data are presented as the mean ± SEM. *, **, #, difference between the indicated groups. *, #, p < 0.05; **p < 0.01 (one‐way ANOVA followed by Newman‒Keuls post hoc test).
Fig. 8
Fig. 8. Lpc-EV treatment improved cognitive deficits in Tg-APP/PS1 mice.
a Experimental design. Tg-APP/PS1 mice were orally administered Lpc-EV at a dose of 2.27 mg/kg/day from 6.5 months of age (green line) until the end of the behavioral tests. Behavioral tests were performed in the order of the novel object recognition test (NOR), water maze test (WM), and passive avoidance test (PA). bf The novel object recognition test: The experimental steps in the NOR test (b). Time spent exploring between two identical objects during familiarization (c, familiarization), between a novel and a familiar object 2 h after familiarization (d, NOR-2 h), between a displaced object and a familiar object 15 min later (e, NLR-15 min), and between a novel and a familiar object 24 h after familiarization (f, NOR-24 h) for the indicated groups. n = 8, 9, and 10 for WT, Tg, and Tg+Lpc-EV, respectively. Familiarization; WT, t(14) = 0.8347, p = 0.4179; Tg, t(16) = 1.720, p = 0.1047; Tg+Lpc-EV, t(18) = 0.4314, p = 0.6713. NOR-2 h; WT, t(14) = 3.733, p = 0.0022; Tg, t(16) = 1.686, p = 0.1111; Tg+Lpc-EV, t(18) = 5.516, p < 0.0001. NLR-15 min; WT, t(14) = 3.557, p = 0.0032; Tg, t(16) = 1.283, p = 0.2178; Tg+Lpc-EV, t(18) = 3.561, p = 0.0022. NOR-24 h; WT, t(14) = 3.210, p = 0.0063; Tg, t(16) = 0.8527, p = 0.4064; Tg+Lpc-EV, t(18) = 2.753, p = 0.0131. gk The water maze test: The latency to find the hidden platform in the hidden platform trial (g) for the indicated groups. Representative tracking (h) and time spent (i) in each quadrant in the probe trial of the indicated groups. The dashed line indicates a 25% chance of exploring a quadrant. C, center; P, periphery; T, target; L, left; R, right; O, opposite. The latency to find the platform during the visual platform trial (j) and swim speed (k) in the visual platform trial of the indicated groups. n = 7 (WT), 8 (Tg), and 10 (Tg+Lpc-EV). Training (g); genotype, F(2,22) = 6.026, p = 0.0079; Lpc-EV treatment, F(4,88) = 51.43, p < 0.0001; interaction, F(8,88) = 1.531, p = 0.1572. Probe trial (i); target, F(2,22) = 4.479, p = 0.0233. Latency (j), F(2,21) = 0.2587, p = 0.7742; Speed (i), F(2,21) = 0.1366, p = 0.8731. l, m The passive avoidance test: the latency to enter the dark chamber at the preshock, and 24 h, 72 h, and 120 h after shock (l), and the freezing time 24 h after shock (m) for the indicated groups. n = 7 (WT), 8 (Tg), and 10 (Tg+Lpc-EV). Preshock, F(2,24) = 0.7906, p = 0.4650; 24 h, F(2,24) = 9.480, p = 0.0009; 72 h, F(2,24) = 10.23, p = 0.0006; 120 h, F(2,24) = 6.479, p = 0.0056; freezing time, F(2,24) = 7.227, p = 0.0035. Data are presented as the mean ± SEM. *p < 0.05; **p < 0.01, difference between indicated groups; #p < 0.05; ##p < 0.01, difference between Tg and Tg-Lpc-EV (Student’s t-test; one-way ANOVA followed by the Newman‒Keuls post hoc test; and two-way repeated-measures ANOVA followed by the Bonferroni post hoc test).

References

    1. Long JM, Holztman DM. Alzheimer disease: an update on pathobiology and treatment strategies. Cell. 2019;179:312–339. doi: 10.1016/j.cell.2019.09.001. - DOI - PMC - PubMed
    1. Scheltens P, et al. Alzheimer’s disease. Lancet. 2021;397:1577–1590. doi: 10.1016/S0140-6736(20)32205-4. - DOI - PMC - PubMed
    1. Alvira-Botero X, Carro EM. Clearance of amyloid-β peptide across the choroid plexus in Alzheimer’s disease. Curr. Aging Sci. 2010;3:219–229. doi: 10.2174/1874609811003030219. - DOI - PubMed
    1. Tarasoff-Conway JM, et al. Clearance systems in the brain—implications for Alzheimer disease. Nat. Rev. Neurol. 2015;11:457–470. doi: 10.1038/nrneurol.2015.119. - DOI - PMC - PubMed
    1. Birch AM, Katsourim L, Sastre M. Modulation of inflammation in transgenic models of Alzheimer’s disease. J. Neuroinflammation. 2014;11:25. doi: 10.1186/1742-2094-11-25. - DOI - PMC - PubMed

Publication types

MeSH terms