. 2023 Sep 13;14(1):249.
doi: 10.1186/s13287-023-03485-3.

SARS-CoV-2 viral genes Nsp6, Nsp8, and M compromise cellular ATP levels to impair survival and function of human pluripotent stem cell-derived cardiomyocytes

Affiliations

SARS-CoV-2 viral genes Nsp6, Nsp8, and M compromise cellular ATP levels to impair survival and function of human pluripotent stem cell-derived cardiomyocytes

Juli Liu et al. Stem Cell Res Ther. .

Abstract

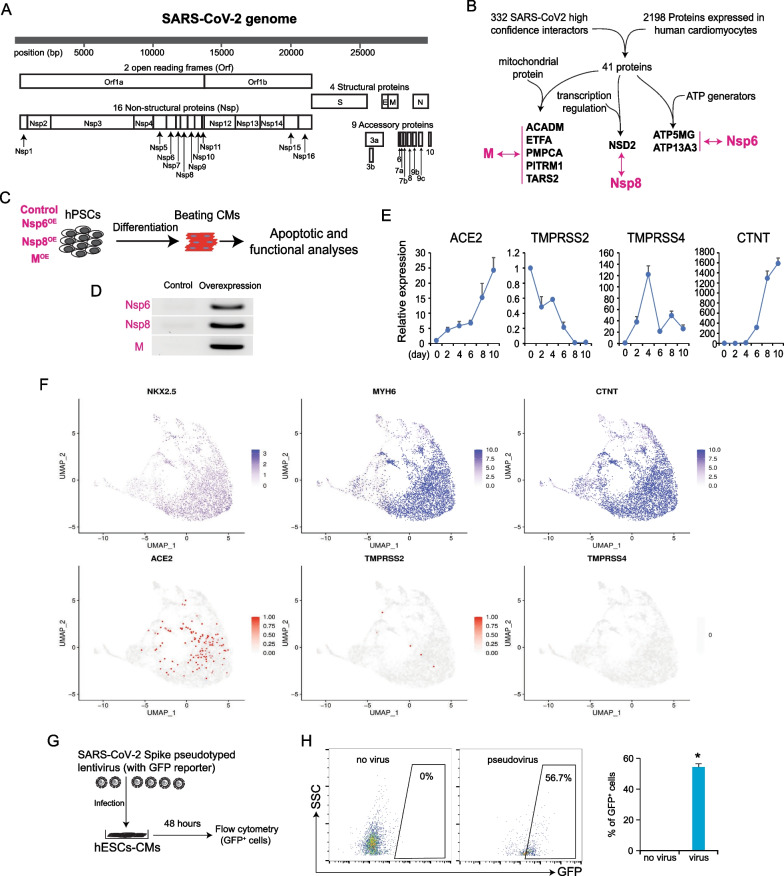
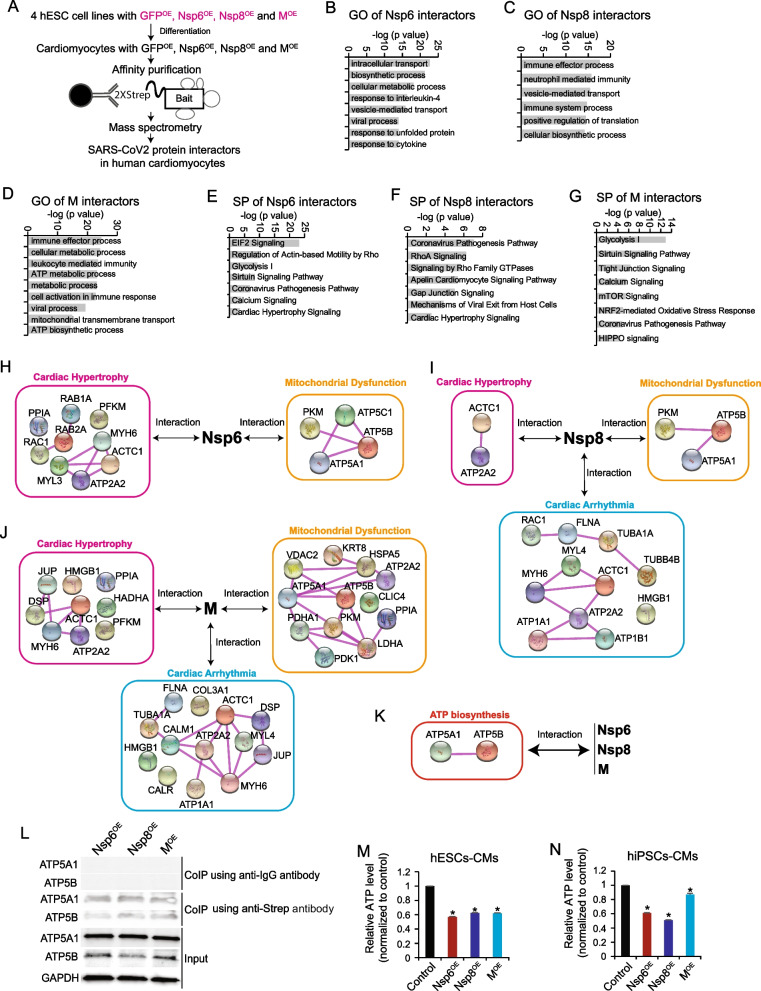
Background: Cardiovascular complications significantly augment the overall COVID-19 mortality, largely due to the susceptibility of human cardiomyocytes (CMs) to SARS-CoV-2 virus. SARS-CoV-2 virus encodes 27 genes, whose specific impacts on CM health are not fully understood. This study elucidates the deleterious effects of SARS-CoV-2 genes Nsp6, M, and Nsp8 on human CMs.

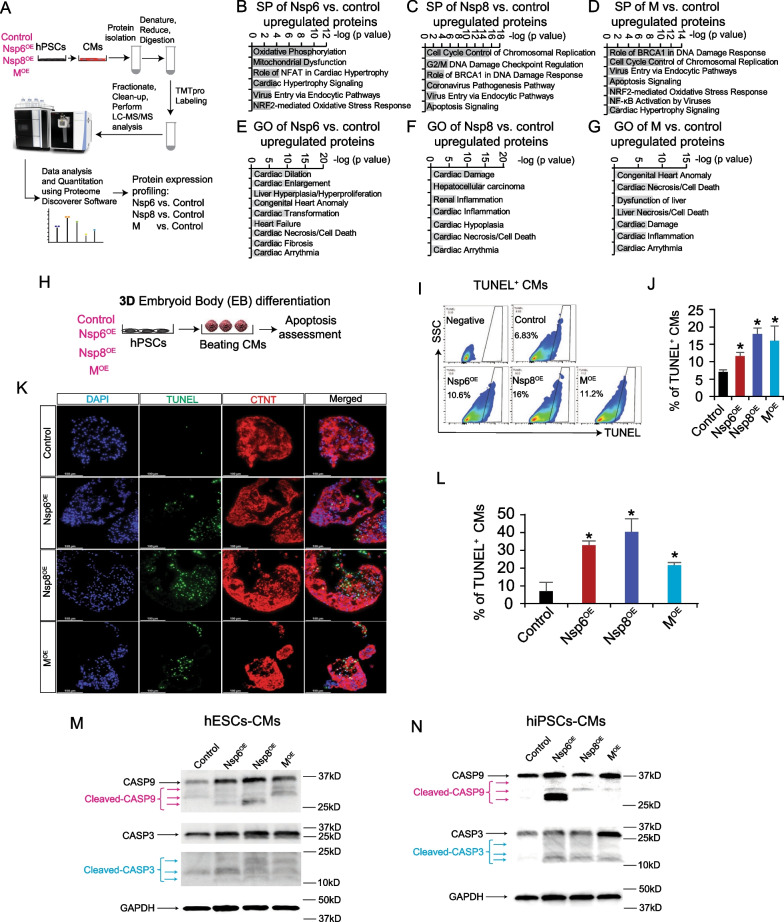
Methods: CMs were derived from human pluripotent stem cells (hPSCs), including human embryonic stem cells and induced pluripotent stem cells, using 2D and 3D differentiation methods. We overexpressed Nsp6, M, or Nsp8 in hPSCs and then applied whole mRNA-seq and mass spectrometry for multi-omics analysis. Co-immunoprecipitation mass spectrometry was utilized to map the protein interaction networks of Nsp6, M, and Nsp8 within host hiPSC-CMs.

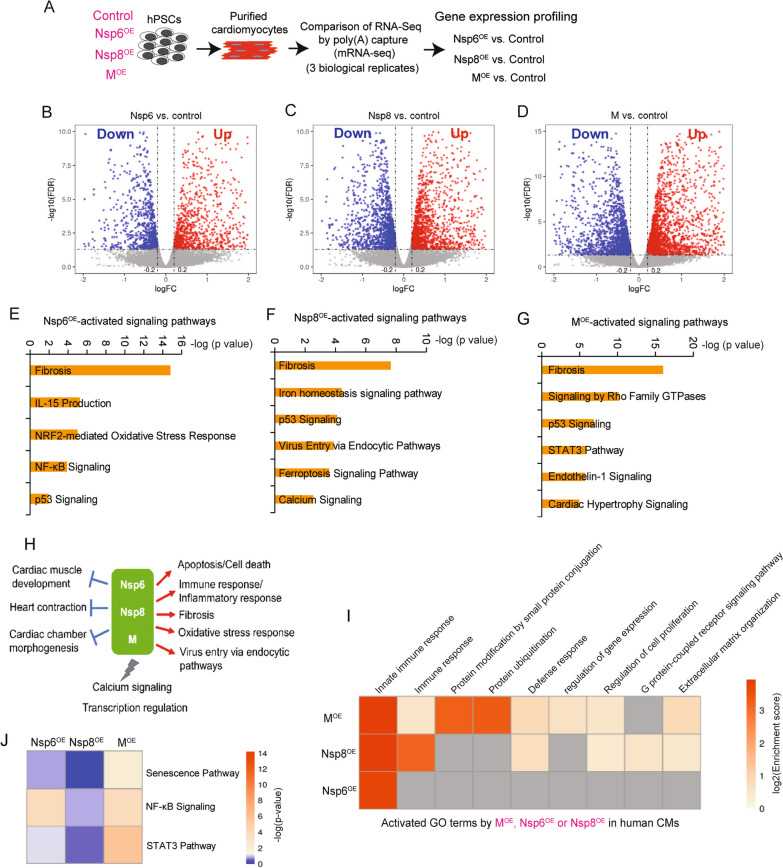
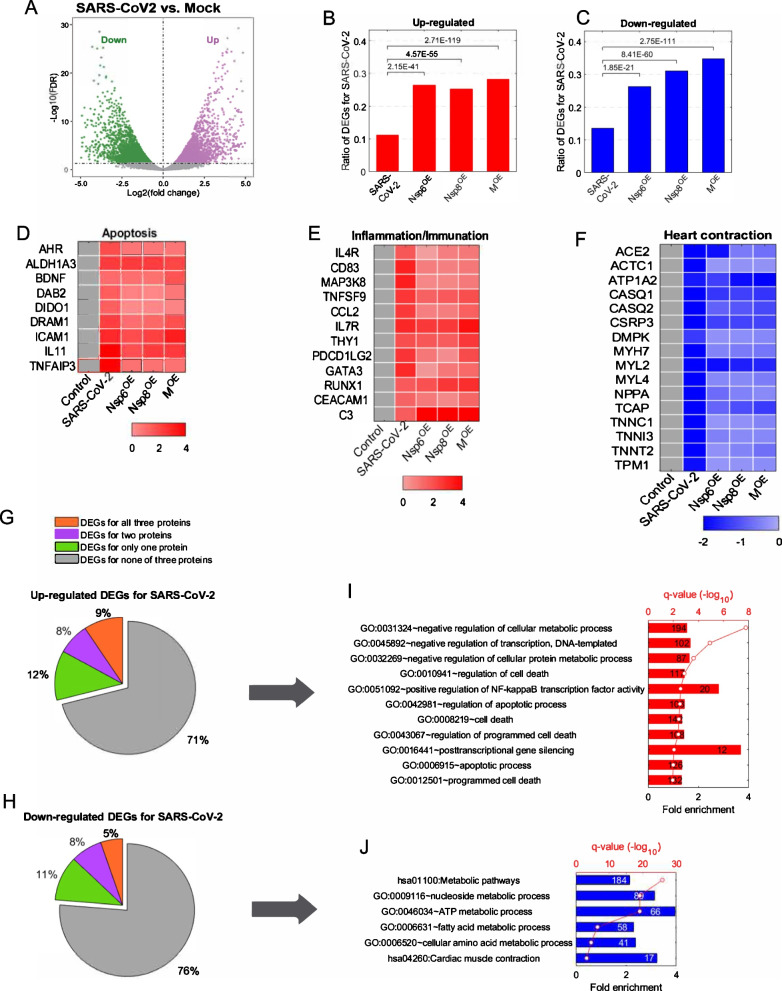
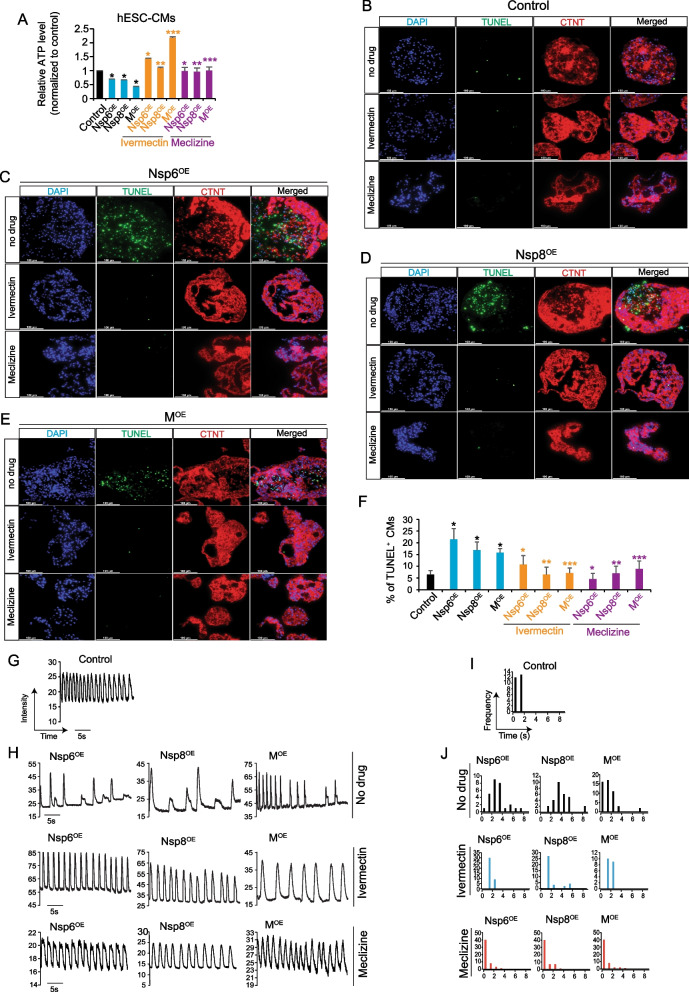
Results: Nsp6, Nsp8, and M globally perturb the transcriptome and proteome of hPSC-CMs. SARS-CoV-2 infection and the overexpression of Nsp6, Nsp8, or M coherently upregulated genes associated with apoptosis and immune/inflammation pathways, whereas downregulated genes linked to heart contraction and functions. Global interactome analysis revealed interactions between Nsp6, Nsp8, and M with ATPase subunits. Overexpression of Nsp6, Nsp8, or M significantly reduced cellular ATP levels, markedly increased apoptosis, and compromised Ca2+ handling in hPSC-CMs. Importantly, administration of FDA-approved drugs, ivermectin and meclizine, could restore ATP levels, thereby mitigating apoptosis and dysfunction in hPSC-CMs overexpressing Nsp6, Nsp8, or M.

Conclusion: Overall, our findings uncover the extensive damaging effects of Nsp6, Nsp8, and M on hPSC-CMs, underlining the crucial role of ATP homeostasis in CM death and functional abnormalities induced by these SARS-CoV-2 genes, and reveal the potential therapeutic strategies to alleviate these detrimental effects with FDA-approved drugs.

Keywords: Apoptosis; COVID-19; Cardiac dysfunction; Cardiomyocyte; Human pluripotent stem cells; SARS-CoV-2.


Conflict of interest statement

The authors declare no competing interests.

Figures

Fig. 1
Fig. 1
Prediction of harmful SARS-CoV-2 viral genes for human cardiomyocytes. A Coding genes annotation of the SARS-CoV-2 genome. B Strategies to predict the potential interactions between SARS-CoV-2 encoded proteins and essential proteins highly expressed in human cardiomyocytes. C Stable hPSC cell lines with overexpression of 3 SARS-CoV-2 genes by lentivirus were established and followed with CM differentiation and functional analyses. OE, overexpression. D RT-PCR detection of Nsp6, Nsp8, and M expression levels in hESC-derived CMs. E RT-qPCR detection of ACE2, TMPRSS2, TMPRSS4 and the cardiomyocyte marker CTNT during cardiac differentiation from hESCs. RNA samples were collected every 2 days from day 0 to day 10 of differentiation. Beating CMs were observed on day 8. All dots are shown as mean ± SD (n = 3). F Gene expression profiles of SARS-CoV-2 viral receptor genes ACE2, TMPRSS2/4, and cardiomyocyte markers NKX2.5, MYH6, CTNT in hESC-derived cardiomyocytes based on our previously published scRNA-seq data [34]. G SARS-CoV-2 Spike pseudotyped lentivirus carrying a GFP reporter was used to infect hESC-CMs. H Flow cytometry analysis of GFP+ hESC-CMs after infection with SARS-CoV-2 Spike pseudotyped lentivirus carrying a GFP reporter. 48 h post-infection, flow cytometry was performed to detect GFP+ cells. CMs without virus infection served as control. All bars are shown as mean ± SD. (n = 3). A two-tailed unpaired t test was used to calculate p values. *p < 0.05 (vs. no virus)
Fig. 2
Fig. 2
Whole mRNA-seq reveals the global impacts of SARS-CoV-2 viral genes on the transcriptome of hESC-CMs. A Scheme of whole mRNA-seq to study the global impacts of SARS-CoV-2 viral genes on the transcriptome of hESC-CMs. BD Volcano blots showing differentially expressed genes caused by Nsp6OE (B), Nsp8OE (C), and MOE (D) in hESC-CMs. EG Canonical signaling pathways (SP) analyses of the upregulated genes induced by Nsp6OE (E), Nsp8OE (F) and MOE (G) in hESC-CMs. H Summary of up- (red) or down-regulated (blue) DEGs by Nsp6OE, Nsp8OE and MOE in hESC-CMs. IJ Canonical signaling pathways of the genes that are differentially induced by Nsp6OE, Nsp8OE and MOE in hESC-CMs
Fig. 3
Fig. 3
Concordant transcriptomic analysis. A Volcano blots showing differentially expressed genes in hiPSC-CMs infected by SARS-CoV-2 virus versus Mock control [17]. B, C Comparison of DEGs between hESC-CMs (Nsp6OE, Nsp8OE and MOE vs. Control) and hiPSC-CMs (SARS-CoV-2 vs. Mock). A two-tailed unpaired t test was used to calculate p values. The remarkable p value indicates the significant overlap between two gene sets. DF Heat map showing representative apoptotic genes in D, inflammation genes in E, and heart contraction genes in F among indicated functional groups. G Frequencies of DEGs that are up-regulated by Nsp6OE/Nsp8OE/MOE in DEGs that are up-regulated due to SARS-CoV-2 infection. H Frequencies of DEGs that are down-regulated by Nsp6OE/Nsp8OE/MOE in DEGs that are down-regulated due to SARS-CoV-2 infection. I GO analysis of DEGs solely up-regulated by SARS-CoV-2 infection. J GO analysis of DEGs solely down-regulated by SARS-CoV-2 infection
Fig. 4
Fig. 4
Overexpression of SARS-CoV-2 genes induces cell death of hPSCs-CMs. A The scheme showing CM differentiation from hESCs in 2D monolayer condition, followed by TMT-MS assessments. Wild type CMs serve as control. BD Signaling pathway enrichment analysis of the upregulated proteins induced by Nsp6OE, Nsp8 OE and M OE in hESC-CMs. EG GO analysis of the upregulated proteins induced by Nsp6OE, Nsp8OE and MOE in hESC-CMs. H The scheme of CM differentiation from hPSCs in 3D embryoid body (EB) condition, followed with apoptotic assessments. IJ Flow cytometry analysis of TUNEL+ cells in the CM (CTNT+) population of hiPSCs-derived EBs. All bars are shown as mean ± SD. (n = 4). A two-tailed unpaired t test was used to calculate p values: *p < 0.05 (vs. Control). K Representative immunostaining images of TUNEL+ cells in hiPSCs-derived EBs containing CTNT+ CMs. Scale bar, 100 µm. L Statistical data analysis of immunostaining results from (K). All bars are shown as mean ± SD. (n = 3). A two-tailed unpaired t test was used to calculate p values: *p < 0.05 (vs. Control). MN Western blotting detection of CASP3, cleaved CASP3, CASP9 and cleaved CASP9 protein expressions in hESC-CMs (M) and hiPSC-CMs (N).
Fig. 5
Fig. 5
SARS-CoV-2 genes interact with host proteins in hPSC-CMs and reduce cellular ATP levels. A The scheme showing Co-IP MS method to globally study SARS-CoV-2 protein interactors in hESC-CMs. BD GO analysis of Nsp6 interactors (B), Nsp8 interactors (C) and M interactors (D). EG Signaling pathway (SP) analysis of Nsp6 interactors (E), Nsp8 interactors (F) and M interactors (G). H Protein–protein interaction (PPI) shows Nsp6 interactors are associated with cardiac hypertrophy and mitochondrial dysfunction. I Protein–protein interaction (PPI) shows Nsp8 interactors are associated with cardiac hypertrophy, mitochondrial dysfunction and cardiac arrhythmia. J Protein–protein interaction (PPI) shows M interactors are associated with cardiac hypertrophy, mitochondrial dysfunction and cardiac arrhythmia. K Protein–protein interaction (PPI) reveals the ATPase subunits ATP5A1 and ATP5B are shared interactors by Nsp6/Nsp8/M proteins in hESC-CMs. L Co-IP Western-blotting verification of the interactions of ATP5A1/ATP5B with Nsp6/Nsp8/M proteins in hESCs-CMs. M ATP level detection in hESC-CMs. All bars are shown as mean ± SD. (n = 3). A two-tailed unpaired t test was used to calculate p values. *p < 0.05 (vs. Control). N ATP level detection in hiPSC-CMs. All bars are shown as mean ± SD. (n = 3). A two-tailed unpaired t test was used to calculate p values. *p < 0.05 (vs. Control)
Fig. 6
Fig. 6
FDA-approved drugs can ameliorate SARS-CoV-2 genes-induced CM abnormalities. A ATP levels in hESC-derived CMs. The final concentration of ivermectin and meclizine's is 0.5 µM. Treatment time is 3 h. All bars are shown as mean ± SD. (n = 3). A two-tailed unpaired t test was used to calculate p values. *p < 0.05, **p < 0.01, ***p < 0.001. Black * indicates overexpression versus control; yellow * indicates ivermectin treatment versus no drug; purple * indicates meclizine versus no drug. BE Representative immunostaining images of TUNEL+ and CTNT+ CMs in control hiPSC-EBs (B), Nsp6OE hiPSC-EBs (C), Nsp8OE hiPSC-EBs (D) and MOE hiPSC-EBs (E). The final concentration of ivermectin and meclizine's is 0.5 µM. Treatment time is 48 h. Scale bar, 100 µm. F Statistical data analysis of immunostaining results from BE. All bars are shown as mean ± SD (n = 3). A two-tailed unpaired t test was used to calculate p values. *p < 0.05, **p < 0.01, ***p < 0.001. Black * indicates overexpression versus control; yellow * indicates ivermectin treatment versus no drug; purple * indicates meclizine versus no drug. G Calcium imaging results in control hESC-CMs. Y-axis represents intensity and X-axis represents time (in seconds, s). H Calcium imaging results in Nsp6OE, Nsp8OE and MOE hESC-CMs treated without or with drugs for 1 h. Y-axis means intensity. X-axis represents time (in seconds, s). I Interspike interval (ISI) distribution analysis from G. Y-axis means beating frequency in a specific time window. X-axis means time (in seconds, s). J Interspike interval (ISI) distribution analysis from (H) in different CM cell lines treated with or without drugs for 1 h

Similar articles

Cited by

References

    1. Zhu N, Zhang D, Wang W, Li X, Yang B, Song J, et al. A novel coronavirus from patients with pneumonia in China, 2019. N Engl J Med. 2020;382(8):727–733. - PMC - PubMed
    1. Zhou P, Yang XL, Wang XG, Hu B, Zhang L, Zhang W, et al. A pneumonia outbreak associated with a new coronavirus of probable bat origin. Nature. 2020;579(7798):270–273. - PMC - PubMed
    1. Guo T, Fan Y, Chen M, Wu X, Zhang L, He T, et al. Cardiovascular implications of fatal outcomes of patients with coronavirus disease 2019 (COVID-19) JAMA Cardiol. 2020;5(7):811–818. - PMC - PubMed
    1. Huang C, Wang Y, Li X, Ren L, Zhao J, Hu Y, et al. Clinical features of patients infected with 2019 novel coronavirus in Wuhan. China Lancet. 2020;395(10223):497–506. - PMC - PubMed
    1. Shi S, Qin M, Shen B, Cai Y, Liu T, Yang F, et al. Association of cardiac injury with mortality in hospitalized patients with COVID-19 in Wuhan, China. JAMA Cardiol. 2020;5(7):802–810. - PMC - PubMed

Publication types

Substances