

Variability of Replicates of Intraocular Inflammatory Biomarkers in Ocular Fluid Samples Analyzed with Multiplex Assays
- PMID: 37705679
- PMCID: PMC10497047
- DOI: 10.2147/OPTH.S417821
Variability of Replicates of Intraocular Inflammatory Biomarkers in Ocular Fluid Samples Analyzed with Multiplex Assays
Abstract
Purpose: Certain factors such as instrumental and sample processing errors may contribute to variability of ocular biofluid samples when they are run as replicates with multiplex assays. There is a paucity of literature on the variability of replicates in multiplex assays. This study aims to evaluate whether there is significant variability in replicate analyses of multiplex assays.
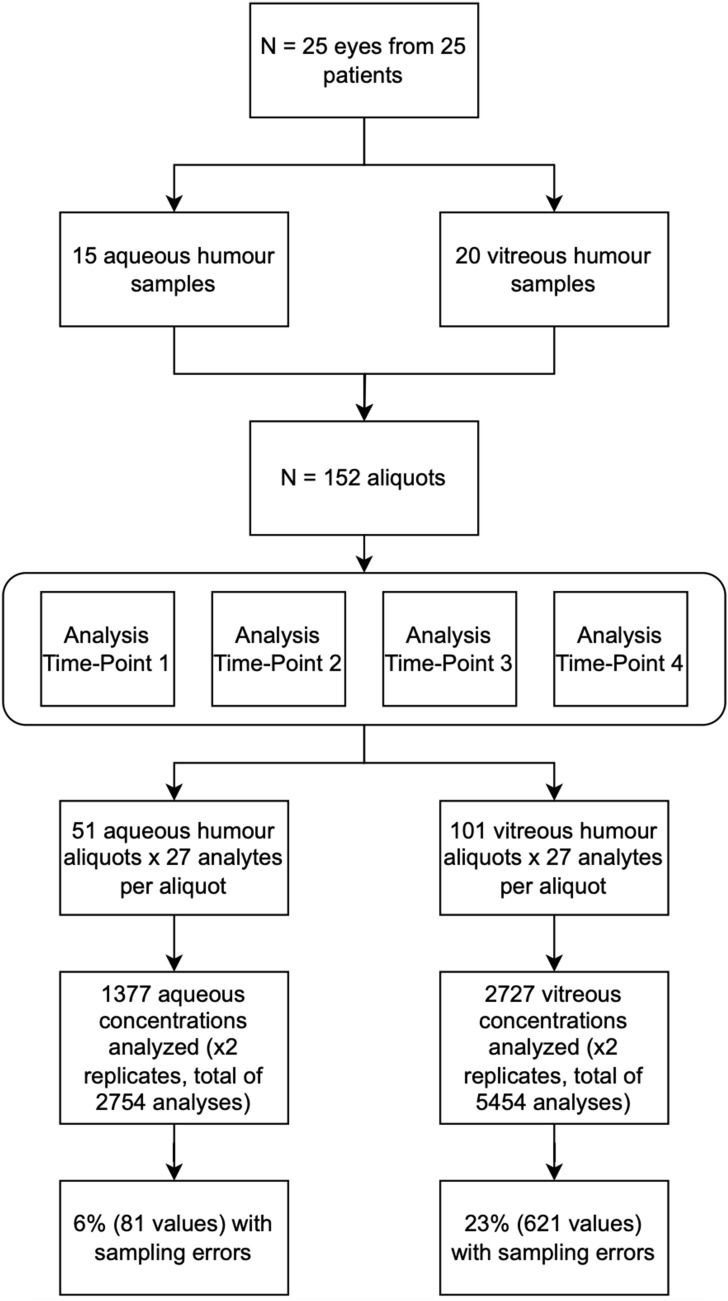
Methods: A total of 152 human ocular biofluid samples (51 aqueous humor and 101 vitreous) were collected and assayed for 27 cytokine biomarker concentrations (pg/mL). Samples were evaluated as replicates (duplicate analysis) at four different time points. Statistical methods including paired samples t-test, 3-way ANOVA, intraclass correlation coefficient (ICC; <0.5-0.75=poor-moderate, 0.75->0.90 =good-excellent reliability), and coefficients of variation (CV) were employed to evaluate for statistical significance, with Bonferroni corrected P=0.002.
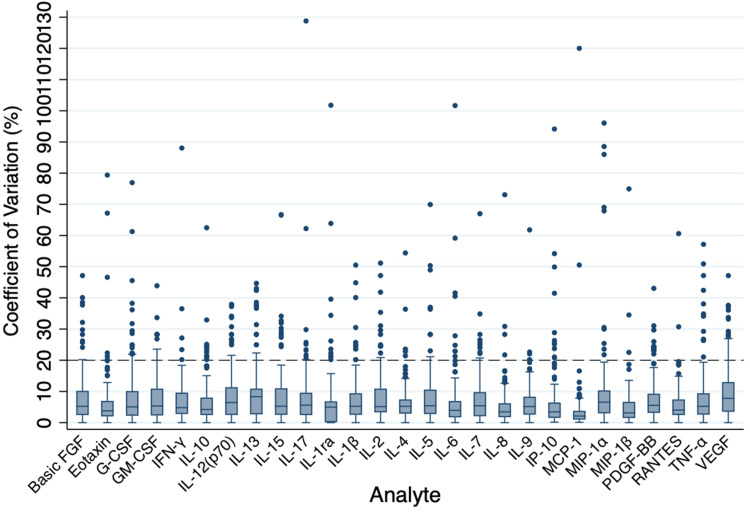
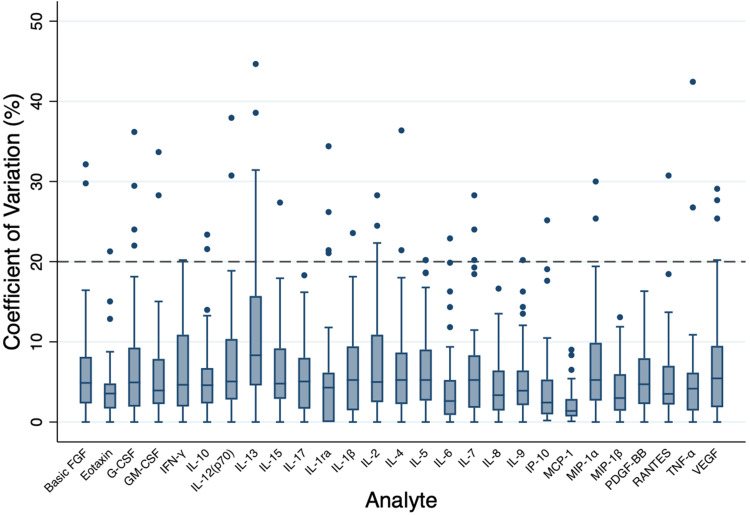
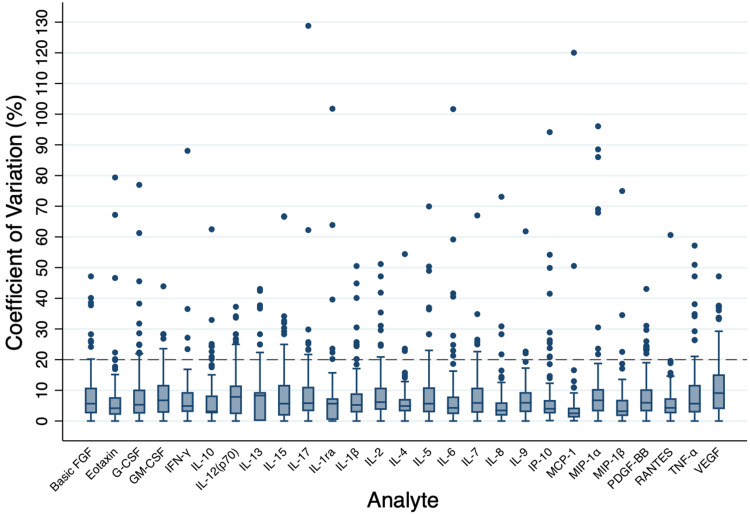
Results: Among the 4104 biomarker replicate assays for aqueous humor and vitreous, two analytes (PDGF-BB and IL-7) had a statistically significant difference between the sampled concentrations of the replicates in vitreous samples (mean (diff)=2.05, P<0.001, mean (diff)=1.56, P<0.001, respectively). Majority of the ICC values fell within the good-excellent range (86% of samples) with a minority falling in the poor-moderate range (14% of samples). More variability was noted in the vitreous humour, with five analytes (IL-2, IL-10, IL-12(p70), IL-13, IL-17) demonstrating an average ICC of less than 0.5. The CV calculated for each set of replicates suggested that 93% of replicates had an acceptable level of quantitative assay variability (CV<20%).
Conclusion: This study demonstrates that the analysis of most biomarkers in ocular fluids may not require the use of replicates. However, certain analytes such as PDGF-BB and IL-7 may require the use of replicates to ensure reliable results. Caution should be taken when applying these findings to other laboratory settings as our study was conducted by an experienced technician using a standardized protocol. In less standardized settings, replicates may be required in order to ensure accuracy of results. These findings may guide researchers with the design of their studies on ophthalmic biomarker analysis.
Keywords: aqueous; assay; biomarkers; cytokines; vitreous.
© 2023 Lamoureux et al.
Conflict of interest statement
Dr David T Wong reports grants and personal fees from Bayer, Roche, Novartis; personal fees from Alcon, AbbVie, Apellis, Ripple Therapeutics, Zeiss, and Bausch Health; equity from ArcticDX; and on the board of directors for 20/20 Innovation Hub, outside the submitted work. The authors report no other conflicts of interest in this work. This research did not receive any specific grant from funding agencies in the public, commercial, or not-for-profit sectors.
Figures
References
LinkOut - more resources
Full Text Sources
