. 2023 Aug 29:3:1237004.
doi: 10.3389/fnetp.2023.1237004. eCollection 2023.

Impact of biological rhythms on the importance hierarchy of constituents in time-dependent functional brain networks

Affiliations

Impact of biological rhythms on the importance hierarchy of constituents in time-dependent functional brain networks

Timo Bröhl et al. Front Netw Physiol. .

Abstract

Biological rhythms are natural, endogenous cycles with period lengths ranging from less than 24 h (ultradian rhythms) to more than 24 h (infradian rhythms). The impact of the circadian rhythm (approximately 24 h) and ultradian rhythms on spectral characteristics of electroencephalographic (EEG) signals has been investigated for more than half a century. Yet, only little is known on how biological rhythms influence the properties of EEG-derived evolving functional brain networks. Here, we derive such networks from multiday, multichannel EEG recordings and use different centrality concepts to assess the time-varying importance hierarchy of the networks' vertices and edges as well as the various aspects of their structural integration in the network. We observe strong circadian and ultradian influences that highlight distinct subnetworks in the evolving functional brain networks. Our findings indicate the existence of a vital and fundamental subnetwork that is rather generally involved in ongoing brain activities during wakefulness and sleep.

Keywords: circadian rhythm; edge centrality; electroencephalographic signals; functional brain network; vertex centrality.


Conflict of interest statement

The authors RvW and KL declared that they were editorial board members of Frontiers, at the time of submission. This had no impact on the peer review process and the final decision. The remaining author declares that the research was conducted in the absence of any commercial or financial relationships that could be construed as a potential conflict of interest.

Figures

FIGURE 1
FIGURE 1
Exemplary observations: (A) temporal sequences of the importance of arbitrarily chosen vertices (here, FP2 and PZ) and edges (FP2–PZ and T8–O1) estimated with CvS and CeS , respectively. (B) Lomb–Scargle periodograms of sequences in (A). (C) Temporal evolution of the relative rank (color-coded) of all network constituents (ant., anterior; post., posterior; ll, left-hemispheric interactions; rr, right-hemispheric interactions; lr, inter-hemispheric interactions; white vertical lines depict recording gaps). Electrode contacts are displayed in the following descending order (top to bottom) respectively: ant. – post.: Fp1, Fp2, F7, F3, Fz, F4, F8, T7, C3, C4, T8, P7, P3, Pz, P4, P8, O1, O2; ll: Fp1-F7, Fp1-F3, Fp1-Fz, Fp1-T7, Fp1-C3, Fp1-P7, Fp1-P3, Fp1-Pz, Fp1-O1, F7-F3, F7-Fz, F7-T7, F7-C3, F7-P7, F7-P3, F7-Pz, F7-O1, F3-Fz, F3-T7, F3-C3, F3-P7, F3-P3, F3-Pz, F3-O1, Fz-T7, Fz-C3, Fz-P7, Fz-P3, Fz-O1, T7-C3, T7-P7, T7-P3, T7-Pz, T7-O1, C3-P7, C3-P3, C3-Pz, C3-O1, P7-P3, P7-Pz, P7-O1, P3-Pz, P3-O1, Pz-O1; rr: Fp2-Fz, Fp2-F4, Fp2-F8, Fp2-C4, Fp2-T8, Fp2-Pz, Fp2-P4, Fp2-P8, Fp2-O2, Fz-F4, Fz-F8, Fz-C4, Fz-T8, Fz-P4, Fz-P8, Fz-O2, F4-F8, F4-C4, F4-T8, F4-Pz, F4-P4, F4-P8, F4-O2, F8-C4, F8-T8, F8-Pz, F8-P4, F8-P8, F8-O2, C4-T8, C4-Pz, C4-P4, C4-P8, C4-O2, T8-Pz, T8-P4, T8-P8, T8-O2, Pz-P4, Pz-P8, Pz-O2, P4-P8, P4-O2, P8-O2; lr: Fp1-Fp2, Fp1-F4, Fp1-F8, Fp1-C4, Fp1-T8, Fp1-P4, Fp1-P8, Fp1-O2, Fp2-F7, Fp2-F3, Fp2-T7, Fp2-C3, Fp2-P7, Fp2-P3, Fp2-O1, F7-F4, F7-F8, F7-C4, F7-T8, F7-P4, F7-P8, F7-O2, F3-F4, F3-F8, F3-C4, F3-T8, F3-P4, F3-P8, F3-O2, Fz-Pz, F4-T7, F4-C3, F4-P7, F4-P3, F4-O1, F8-T7, F8-C3, F8-P7, F8-P3, F8-O1, T7-C4, T7-T8, T7-P4, T7-P8, T7-O2, C3-C4, C3-T8, C3-P4, C3-P8, C3-O2, C4-P7, C4-P3, C4-O1, T8-P7, T8-P3, T8-O1, P7-P4, P7-P8, P7-O2, P3-P4, P3-P8, P3-O2, P4-O1, P8-O1, O1-O2. (D,E) Fraction of the recording time during which a respective constituent was the most/least important. (F) Average relative centrality values ( CvS and CeS , respectively, normalized to the maximum value) over the recording time.
FIGURE 2
FIGURE 2
Influence of the circadian rhythm (estimated with P 24) on centrality values of network constituents (assessed with betweenness centrality CB , closeness centrality CC , eigenvector centrality CE , and strength/nearest-neighbor centrality CS ). Pale blue: P 24 ≤ 0.5; red: P 24 > 0.5.
FIGURE 3
FIGURE 3
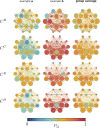
Influence of the circadian rhythm (P 24; color-coded) and the average importance over the recording time (the size of vertices/edges; the larger they are, the more important they are). Importance estimated with betweenness centrality CB , closeness centrality CC , eigenvector centrality CE , and strength/nearest-neighbor centrality CS . Networks are depicted in the layout of the 10–20 EEG system (Klem et al., 1999). Examples a and b (left and middle columns) represent the observed opposing extreme cases from two subjects, either showing an overall little (example a) or strong (example b) influence of the circadian rhythm. The right column shows the group average over all the subjects.
FIGURE 4
FIGURE 4
Relation between constituents’ average relative rank over the total recording time and their fraction of the recording time, for which the constituents are deemed the most important. Marker colors encode the different subjects, and marker sizes encode the relative power corresponding to the 24-h peak related to the circadian rhythm.
FIGURE 5
FIGURE 5
(A) Fraction of the recording time during which a network constituent is the most important (color-coded) and the average relative rank of the constituent (size-coded). Importance assessed with betweenness centrality CB , closeness centrality CC , eigenvector centrality CE , and strength/nearest-neighbor centrality CS . Middle column: Absolute night–day differences in the fraction of the recording time during which the respective constituent is the most important (color-coded, green/purple indicating a higher fraction of the recording time during night/day) and the absolute value of the absolute difference in the constituents’ relative rankings (size-coded). (B) Absolute night–day difference in constituents’ relative rankings (color-coded, red/blue indicating a higher relative ranking during night/day) and the absolute value of the absolute difference in the fraction of the recording time during which a network constituent is the most important (size-coded). The respective data are averaged over all subjects and their respective night/day periods.

Similar articles

Cited by

References

    1. Albouy G., King B. R., Maquet P., Doyon J. (2013). Hippocampus and striatum: dynamics and interaction during acquisition and sleep-related motor sequence memory consolidation. Hippocampus 23, 985–1004. 10.1002/hipo.22183 - DOI - PubMed
    1. Bavelas A. (1950). Communication patterns in task-oriented groups. J. Acoust. Soc. Am. 22, 725–730. 10.1121/1.1906679 - DOI
    1. Boashash B. (1992). Time frequency signal analysis: Methods and applications. Melbourne: Longman Cheshire.
    1. Boccaletti S., Bianconi G., Criado R., Del Genio C. I., Gómez-Gardenes J., Romance M., et al. (2014). The structure and dynamics of multilayer networks. Phys. Rep. 544, 1–122. 10.1016/j.physrep.2014.07.001 - DOI - PMC - PubMed
    1. Boccaletti S., Latora V., Moreno Y., Chavez M., Hwang D.-U. (2006). Complex networks: structure and dynamics. Phys. Rep. 424, 175–308. 10.1016/j.physrep.2005.10.009 - DOI

LinkOut - more resources