. 2023 Aug 21;19(13):4340-4359.
doi: 10.7150/ijbs.85692. eCollection 2023.

FGF2 Alleviates Microvascular Ischemia-Reperfusion Injury by KLF2-mediated Ferroptosis Inhibition and Antioxidant Responses

Affiliations

FGF2 Alleviates Microvascular Ischemia-Reperfusion Injury by KLF2-mediated Ferroptosis Inhibition and Antioxidant Responses

Fanfeng Chen et al. Int J Biol Sci. .

Abstract

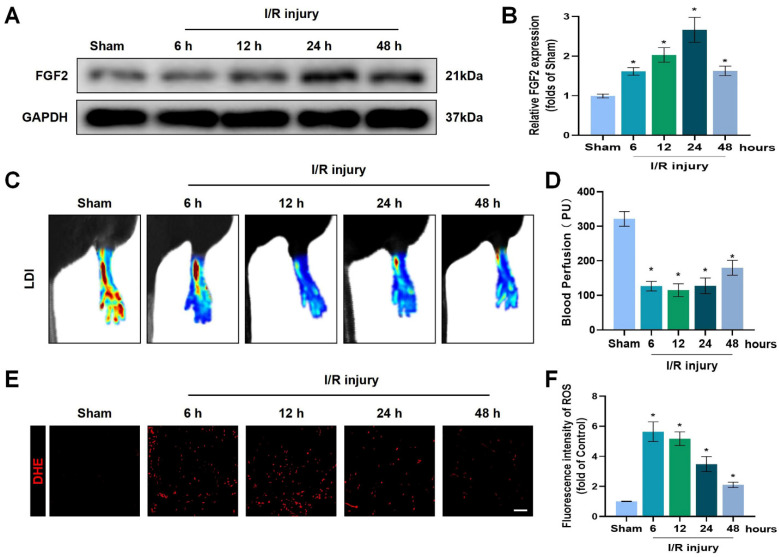
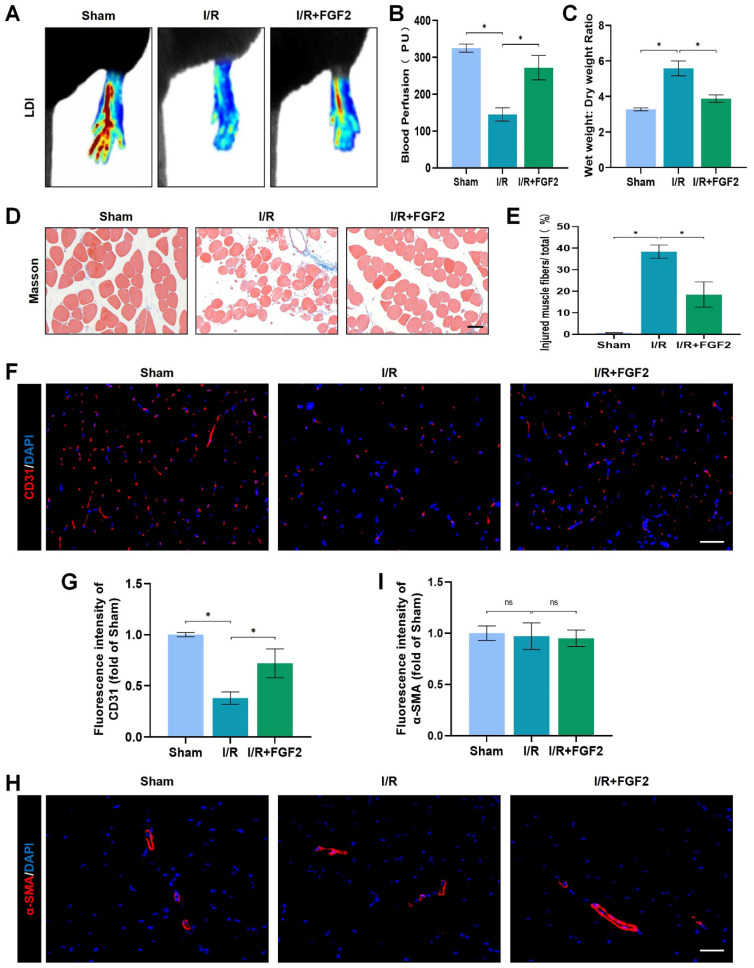
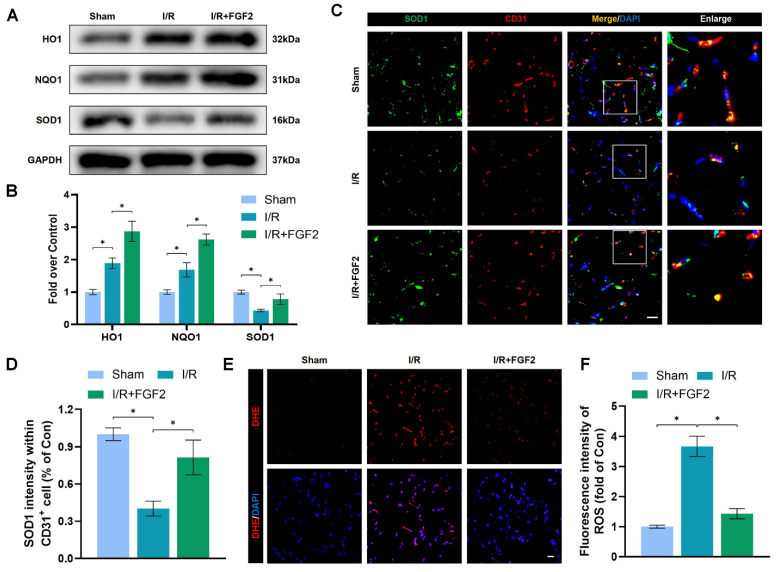
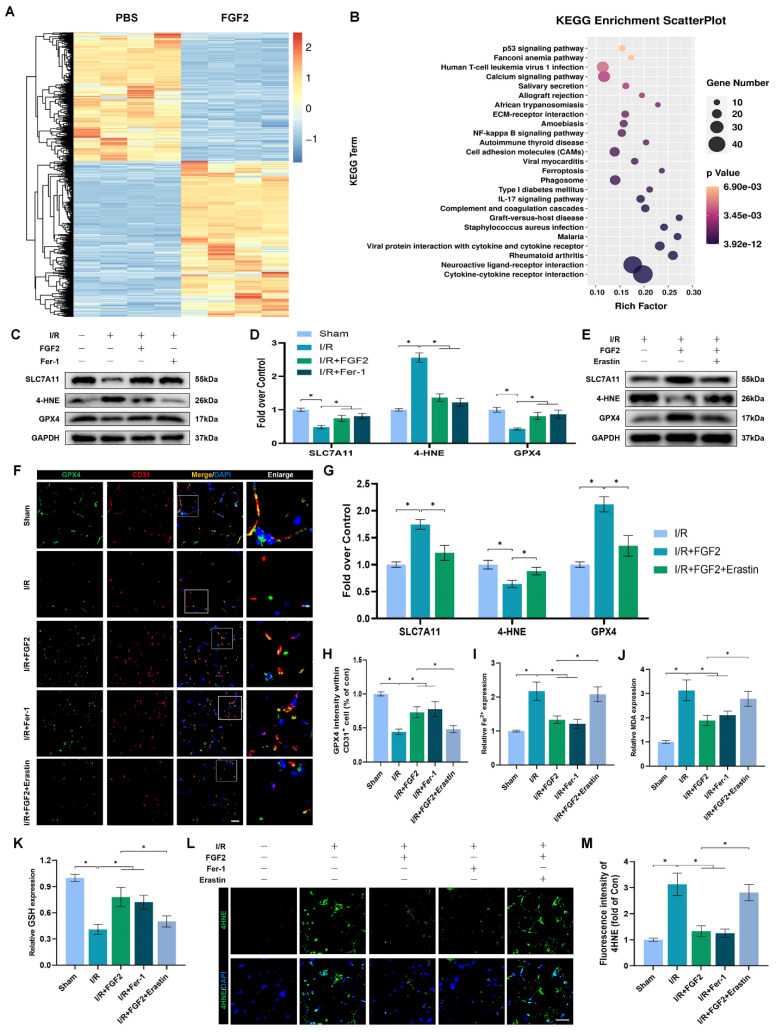
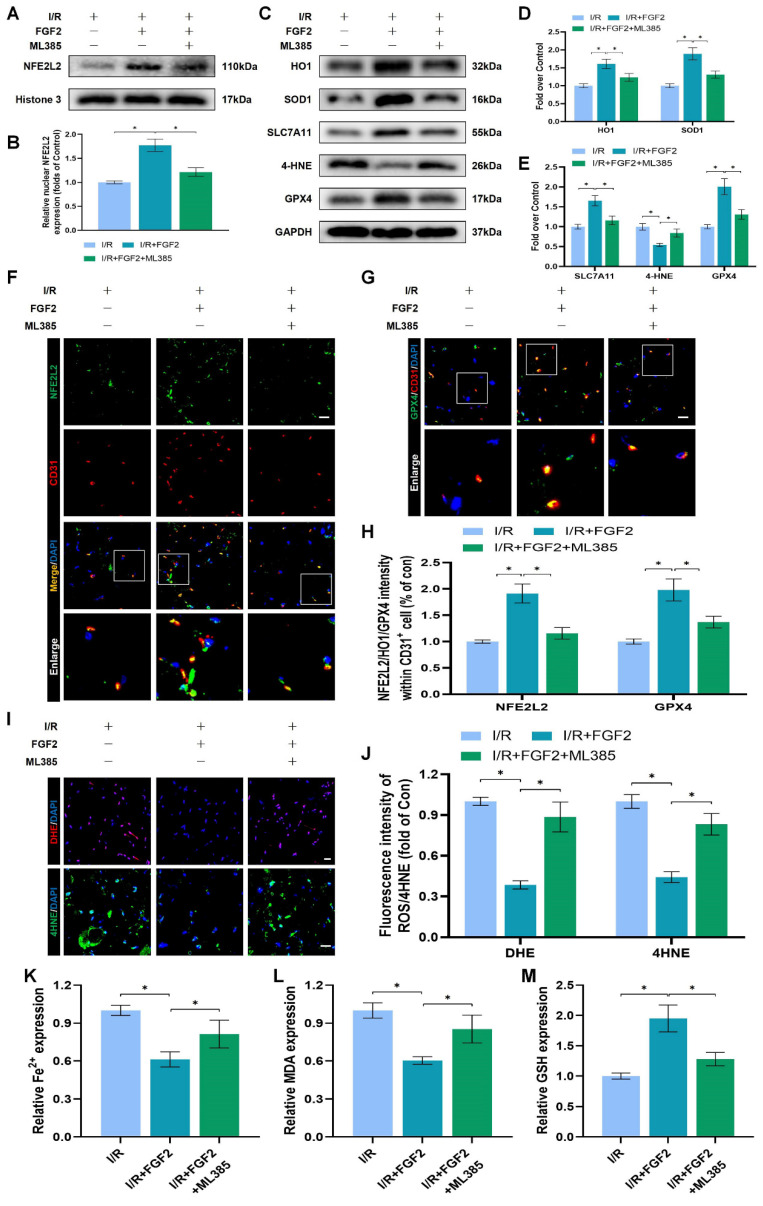
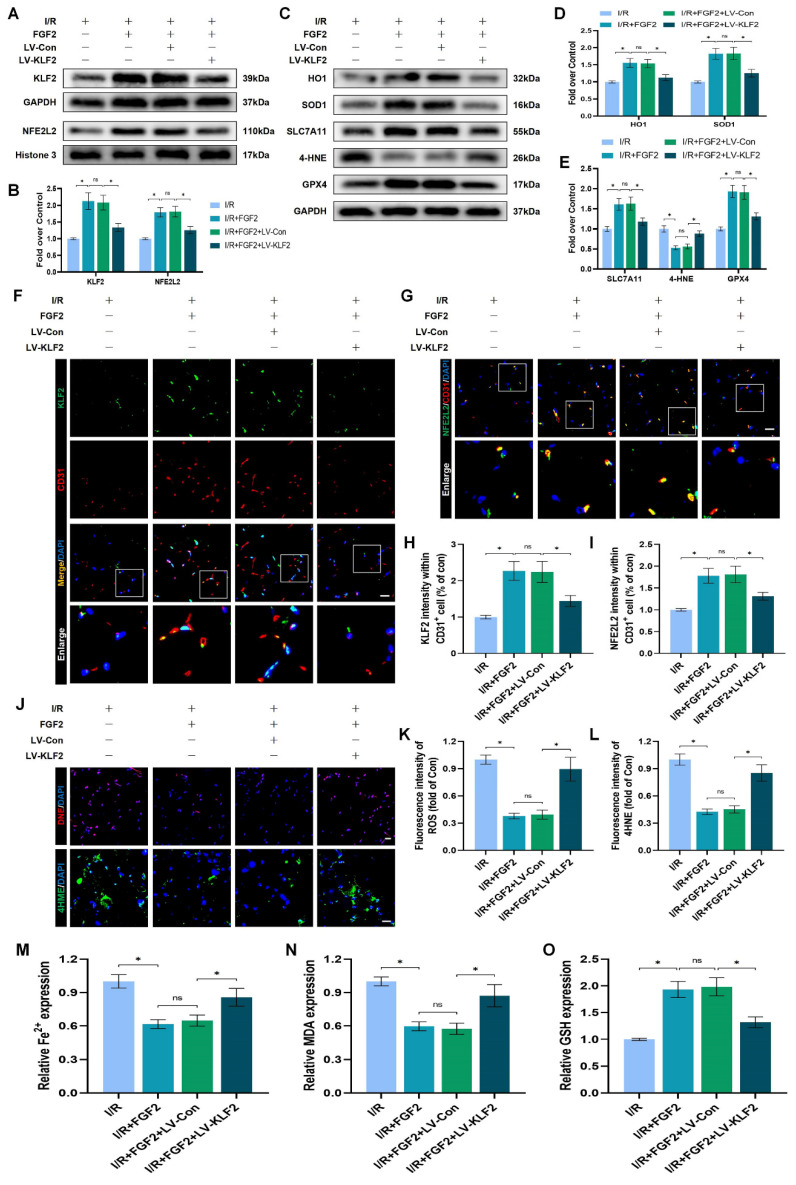
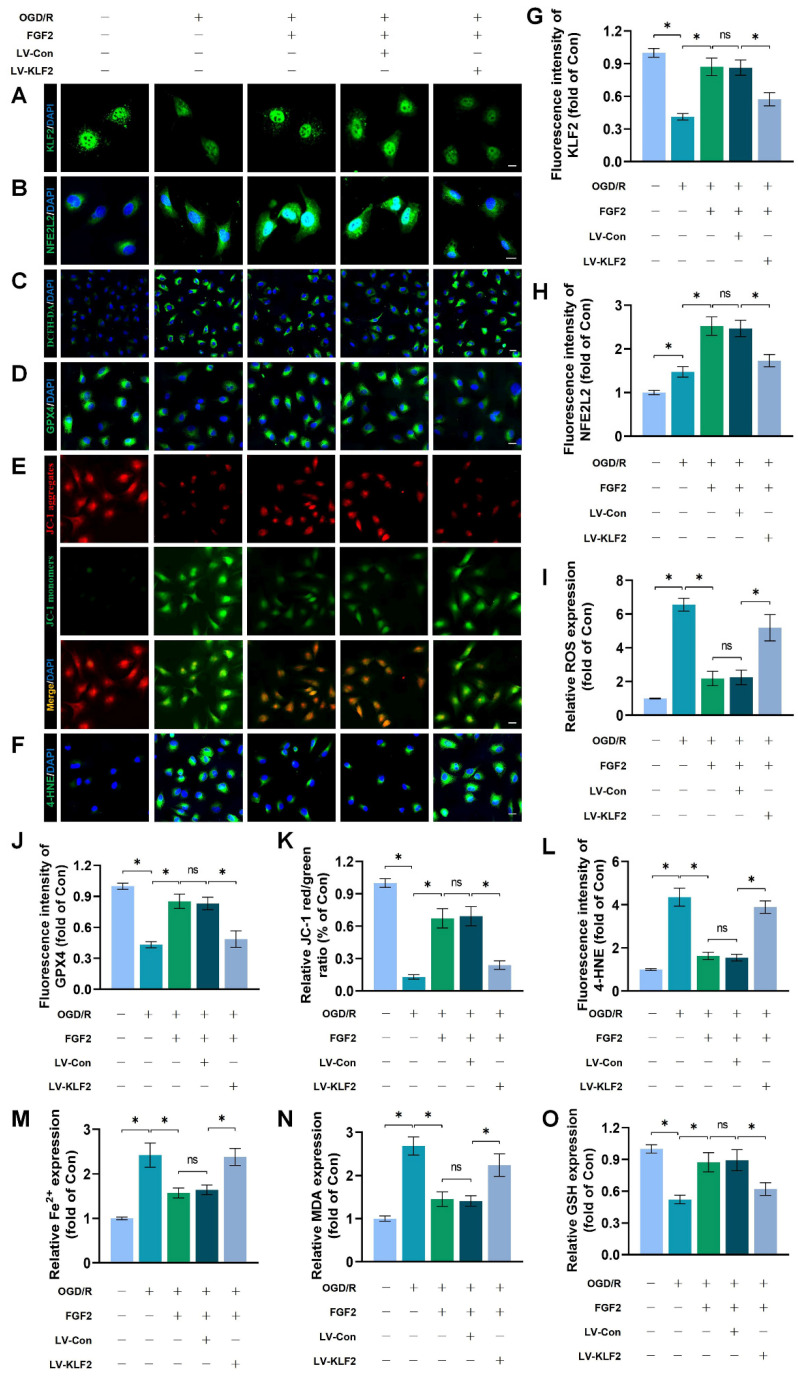
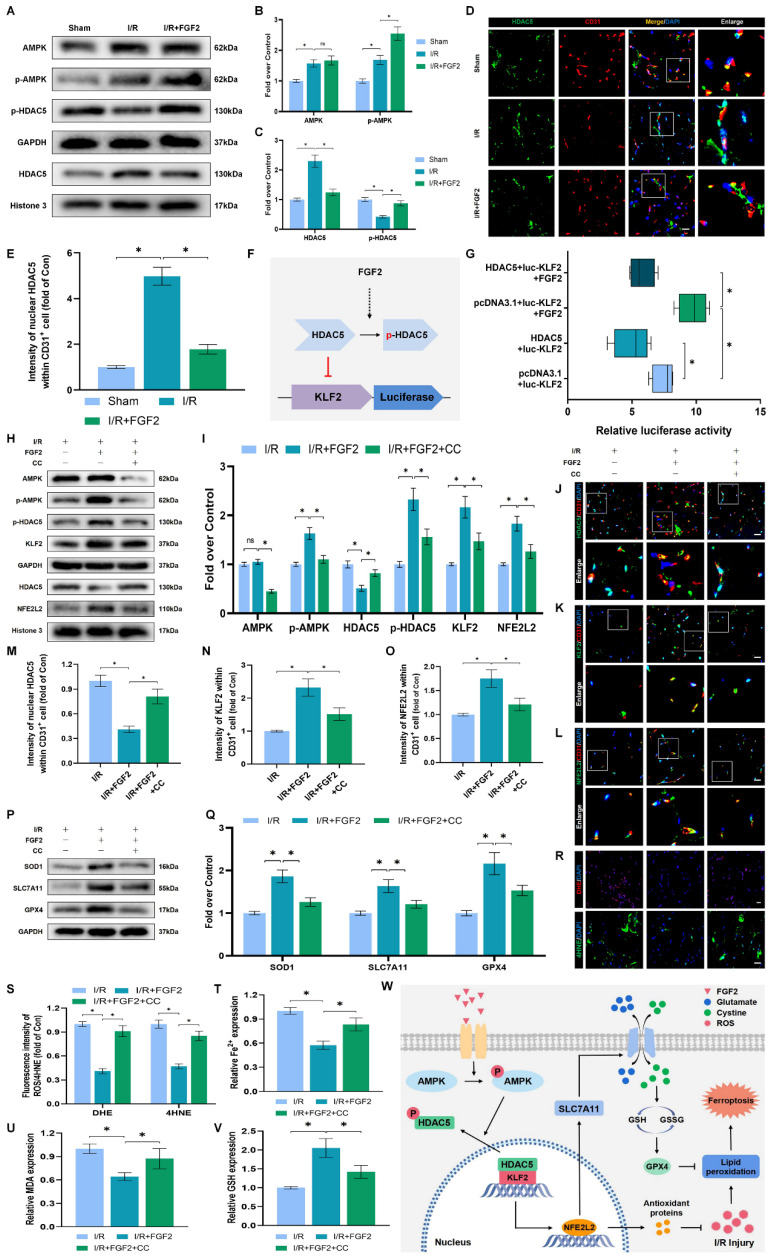
An essential pathogenic element of acute limb ischemia/reperfusion (I/R) injury is microvascular dysfunction. The majority of studies indicates that fibroblast growth factor 2 (FGF2) exhibits protective properties in cases of acute I/R injury. Albeit its specific role in the context of acute limb I/R injury is yet unknown. An impressive post-reperfusion increase in FGF2 expression was seen in a mouse model of hind limb I/R, followed by a decline to baseline levels, suggesting a key role for FGF2 in limb survivability. FGF2 appeared to reduce I/R-induced hypoperfusion, tissue edema, skeletal muscle fiber injury, as well as microvascular endothelial cells (ECs) damage within the limb, according to assessments of limb vitality, Western blotting, and immunofluorescence results. The bioinformatics analysis of RNA-sequencing revealed that ferroptosis played a key role in FGF2-facilitated limb preservation. Pharmacological inhibition of NFE2L2 prevented ECs from being affected by FGF2's anti-oxidative and anti-ferroptosis activities. Additionally, silencing of kruppel-like factor 2 (KLF2) by interfering RNA eliminated the antioxidant and anti-ferroptosis effects of FGF2 on ECs. Further research revealed that the AMPK-HDAC5 signal pathway is the mechanism via which FGF2 regulates KLF2 activity. Data from luciferase assays demonstrated that overexpression of HDAC5 prevented KLF2 from becoming activated by FGF2. Collectively, FGF2 protects microvascular ECs from I/R injury by KLF2-mediated ferroptosis inhibition and antioxidant responses.

Keywords: FGF2; Ferroptosis; Limb ischemia/reperfusion; Microvascular damage; Oxidative stress.


Conflict of interest statement

Competing Interests: The authors have declared that no competing interest exists.

Figures

Figure 1
Figure 1
Increased FGF2 expression after acute limb I/R injury. (A) WB evaluation of skeletal muscle samples for FGF2. (B) Quantification of the FGF2 protein level from (A), standardised to GAPDH band density. (C) LDI analysis of post-I/R hind limb blood perfusion. (D) A histogram showing the strength of the blood flow signal. (E) DHE staining used to measure the ROS levels in limbs damaged by I/R. (F) A histogram displaying the signal strength of ROS levels. Data are presented as mean ± SD, (n = 3-5 per group). Significance: *P < 0.05.
Figure 2
Figure 2
FGF2 reduces limb tissue edema and skeletal muscle fibres injury while increasing blood perfusion and microvascular EC density in I/R limbs. (A) LDI analysis of the blood perfusion in the hind limbs. (B) A histogram showing the strength of the blood flow signal. (C) Wet weight to dry weight ratio. (D) Transverse slices of skeletal muscle stained with Masson. Scale bar: 100 µm. (E) Calculating the fraction of damaged fibres in skeletal muscle. (F) Images of skeletal muscle sections labelled with CD31 antibodies and showing DAPI staining to identify the nuclei. Scale bar: 100 µm. Using the immunofluorescence data in (F), the average CD31 optical density is shown in (G). (H) Images of skeletal muscle sections stained with anti-α-SMA antibodies and showing DAPI-positive nuclei. Scale bar: 100 µm. Immunofluorescence data in (H) were used to calculate the average α-SMA optical density in (I). Data are presented as mean ± SD (n = 3-5 per group). Significance: ns, not significant; *P < 0.05.
Figure 3
Figure 3
FGF2 reduces I/R-induced oxidative stress in ECs. (A) WB assay of skeletal muscle samples with HO-1, NQO1, and SOD1. (B) Quantification of HO-1, NQO1, and SOD1 proteins at the protein level from (A), normalised to GAPDH band density. (C) Skeletal muscle slices with SOD1 and CD31, an EC marker, stained. DAPI staining is used to identify the nuclei. Scale bars: 100 μm. (D) Quantification of SOD1 and CD31 cells with double positivity and percentages of total CD31 positive cells. (E) Images of skeletal muscle sections stained with DHE, nuclei were recognized by DAPI staining. Scale bars: 100 μm. Using the immunofluorescence data in (E), the average ROS optical density is shown in (F). Data are presented as mean ± SD (n = 3-5 per group). Significance: *P < 0.05.
Figure 4
Figure 4
FGF2 reduces I/R-induced ferroptosis in ECs. (A) Heatmap displays the PBS and I/R cohorts' distinctive abundance characteristics. (B) The KEGG database's functional classification of the FGF2-regulated genes. (C) WB assay of GPX4, 4-HNE, and SLC7A11 in skeletal muscle tissues. (D) Quantification of protein level of SLC7A11, 4-HNE and GPX4 from (C) with normalised to GAPDH band density. (E) WB assay of GPX4, 4-HNE, and SLC7A11 in skeletal muscle samples. (F) Skeletal muscle slices with GPX4 and CD31, an EC marker, stained. DAPI staining is used to identify the nuclei. Scale bars: 100 μm. (G) Quantification of protein level of SLC7A11, 4-HNE and GPX4 from (E) with normalized with respect to GAPDH band density. (H) Quantification of GPX4 and CD31 double-positive cells, the percentages of double positive cells versus total CD31 positive cells are indicated. (I) Content of Fe2+ was plotted as a histogram. (J) A histogram displaying the MDA content. (K) Content of GSH was plotted as a histogram. (L) Sections of skeletal muscle stained with 4-HNE, with DAPI staining identifying the nuclei. Scale bars: 100 μm. Based on the immunofluorescence results in (L), the average 4-HNE optical density is shown in (M). Data are presented as mean ± SD (n = 3-5 per group). Significance: *P < 0.05.
Figure 5
Figure 5
Through increased NFE2L2 activity, FGF2 mitigates oxidative stress and ferroptosis. (A) WB examination of skeletal muscle samples. (B) Quantification of protein level of NFE2L2 from (A) with normalized to Histone 3 band density. (C) WB assay of skeletal muscle tissues reveals the presence of HO-1, SOD1, SLC7A11, 4-HNE, and GPX4. (D) Quantification of the GAPDH band density-normalized HO-1 and SOD1 protein levels from (C). SLC7A11, 4-HNE, and GPX4 protein levels from (C) are quantified in (E), normalised to GAPDH band density. (F) Micrographs of skeletal muscle slices with NFE2L2 and CD31, a marker for endothelial cells, immunostained; DAPI labelling outlined nuclei. Scale bars: 100 μm. (G) Micrographs of skeletal muscle slices with GPX4 and CD31 antibodies; DAPI labelling showed nuclei. Scale bars: 100 μm (H) Quantification of cells that express NFE2L2, GPX4, and CD31; ratios of co-expressing cells to all CD31-positive cells are shown. (I) Micrographs of skeletal muscle slices with nuclei identified by DAPI labelling and DHE and 4-HNE staining. Scale bars: 100 μm. (J) Quantification of the intensity of DHE and 4-HNE fluorescence from (I). (K) The concentration of Fe2+ is displayed as a histogram. (L) Content of MDA was displayed as a histogram. (M) Content of GSH was displayed as a histogram. Data are provided as mean ± SD (n = 3-5 per group). Significance: *P < 0.05.
Figure 6
Figure 6
FGF2 reduces oxidative stress and ferroptosis via KLF2-NFE2L2 pathway in vivo. (A) Skeletal muscle specimens were used for the KLF2 and NFE2L2 WB assay. (B) Protein quantification of KLF2 and NFE2L2 from (A), normalised to GAPDH band density and histone 3 band density, respectively. (C) Skeletal muscle specimens showing HO-1, SOD1, SLC7A11, 4-HNE, and GPX4 on a WB assay. (D) Quantification of the GAPDH band density-normalized HO-1 and SOD1 protein levels from (C). (E) Quantification of protein level of SLC7A11, 4-HNE and GPX4 from (C) with normalized to GAPDH band density. (F) DAPI staining shows the nuclei in these micrographs of skeletal muscle slices that have been immunostained for KLF2 and CD31. Scale bars: 100 μm. (G) Micrographs of skeletal muscle slices with NFE2L2 and CD31 immunostaining; DAPI labelling shows nuclei. Scale bars: 100 μm. (H) Quantification of cells that co-express KLF2 and CD31; proportions of co-expressing cells to all CD31-positive cells are shown. (I) Quantification of NFE2L2 and CD31 double-positive cells, the ratio of co-expressing cells to all CD31-positive cells is shown. (J) Micrographs of skeletal muscle slices with nuclei identified by DAPI labelling and DHE and 4-HNE staining. Scale bars: 100 μm. Based on the immunofluorescence data in (J), the ROS level was quantified in (K). Based on the immunofluorescence results in (J), 4-HNE fluorescence intensity was quantified in (L). (M) Content of Fe2+ was plotted as a histogram. (N) The concentration of MDA is shown as a histogram. (O) The concentration of GSH is shown as a histogram. Data are provided as mean ± SD (n = 3-5 per group). Significance: ns, not significant; *P < 0.05.
Figure 7
Figure 7
FGF2 reduces oxidative stress and ferroptosis through KLF2-NFE2L2 axis in vitro. (A) KLF2-labeled HUVECs slices show DAPI-stained nuclei that can be distinguished. Scale bars: 25 μm. (B) Images of HUVECs sections stained with NFE2L2, nuclei were recognized by DAPI staining. Scale bars: 25 μm. (C) Images of HUVECs sections stained with DCFH-DA, nuclei were recognized by DAPI staining. Scale bars: 25 μm. (D) Images of HUVECs sections stained with GPX4, nuclei were recognized by DAPI staining. Scale bars: 25 μm. (E) Images of HUVECs sections stained with JC-1. Scale bars: 25 μm. (F) Using DAPI staining, 4-HNE-stained HUVECs sections show different nuclei. Scale bars: 25 μm. Immunofluorescence data from (A) are calculated in (G), which shows the mean optical density of KLF2. Analysing immunofluorescence data from (B) reveals that NFE2L2 has an average optical density (H). (I) Quantification of immunofluorescence data from (C) displaying the level of ROS. The mean optical density of GPX4 is shown in (J) by measuring the immunofluorescence data from (D). (K) Quantification of immunofluorescence data from (E) displaying the level of ferroptosis. The average optical density of 4-HNE is shown in (L) based on the analysis of immunofluorescence data from (F). (M) Content of Fe2+ was plotted as a histogram. (N) A histogram showing the content of MDA. (O) GSH content as shown by a histogram. Data are shown as the means ± SD (n = 3 per group). Significance: ns, not significant; *P < 0.05.
Figure 8
Figure 8
FGF2 activates KLF2 through the AMPK-HDAC5 pathway. (A) Skeletal muscle tissues' WB assay for AMPK, p-AMPK, p-HDAC5, and HDAC5. AMPK and p-AMPK protein levels from (A) are quantified in (B), normalised to GAPDH band density. HDAC5 protein level from (A) is evaluated in (C), normalised in respect to Histone 3 band density, coupled with p-HDAC5 level from (A), normalised in relation to GAPDH band density. (D) Using DAPI labelling, skeletal muscle slices labelled with HDAC5 and the EC marker CD31 reveal distinct nuclei. Scale bars indicate 100 μm. Nuclear HDAC5 and CD31 double-positive cells computation (E). (F) Images from a dual luciferase reporter gene test. (G) Relative luciferase activity was plotted as a box plots. (H) Skeletal muscle tissues' WB assay for AMPK, p-AMPK, p-HDAC5, KLF2, HDAC5, and NFE2L2. (I) Quantification of protein level of AMPK, p-AMPK, p-HDAC5, KLF2 from (H) with normalized to GAPDH band density, HDAC5 and NFE2L2 protein levels from (H) with normalized to Histone 3 band density. (J-L) Images of skeletal muscle slices with DAPI-stained nuclei that have had HDAC5, KLF2, NFE2L2, and EC marker CD31 stained. Scale bars: 100 μm. (M-O) Quantification of nuclear HDAC5, KLF2, NFE2L2 and CD31 double-positive cells, the percentages of double positive cells versus total CD31 positive cells are indicated. (P) Skeletal muscle tissues' WB assay for SOD1, SLC7A11, and GPX4. SOD1, SLC7A11, and GPX4 protein levels are evaluated in (Q) and normalised based on GAPDH band density. (R) Photographs of skeletal muscle slices with distinct nuclei shown by DAPI staining and DHE and 4-HNE staining. Scale bars: 100 μm. Immunofluorescence data from (R) are measured in (S), which reveals the average optical density of 4-HNE and the degree of ROS. (T) Content of Fe2+ was plotted as a histogram. (U) A histogram showing the content of MDA. (V) A histogram showing the GSH content. (W) Schematic representation of proposed molecular mechanisms highlighting the roles of AMPK-HDAC5 signaling, KLF2, NFE2L2, oxidative stress, ferroptosis in the pathophysiology of I/R-induced microvascular injury in extremities. Data are presented as the mean ± SD (n = 3-5 per group). Significance: ns, not significant; *P < 0.05.

References

    1. Girn HR, Ahilathirunayagam S, Mavor AI, Homer-Vanniasinkam S. Reperfusion syndrome: cellular mechanisms of microvascular dysfunction and potential therapeutic strategies. Vasc Endovascular Surg. 2007;41:277–93. - PubMed
    1. Kerrigan CL, Stotland MA. Ischemia reperfusion injury: a review. Microsurgery. 1993;14:165–75. - PubMed
    1. McCord JM. Oxygen-derived free radicals in postischemic tissue injury. N Engl J Med. 1985;312:159–63. - PubMed
    1. Wang WZ, Fang XH, Stepheson LL, Khiabani KT, Zamboni WA. Acute microvascular action of vascular endothelial growth factor in skeletal muscle ischemia/reperfusion injury. Plast Reconstr Surg. 2005;115:1355–65. - PubMed
    1. Granger DN, Kvietys PR. Reperfusion therapy-What's with the obstructed, leaky and broken capillaries? Pathophysiology. 2017;24:213–28. - PubMed

Publication types