

Increased interhemispheric functional connectivity during non-dominant hand movement in right-handed subjects
- PMID: 37705959
- PMCID: PMC10495657
- DOI: 10.1016/j.isci.2023.107592
Increased interhemispheric functional connectivity during non-dominant hand movement in right-handed subjects
Abstract
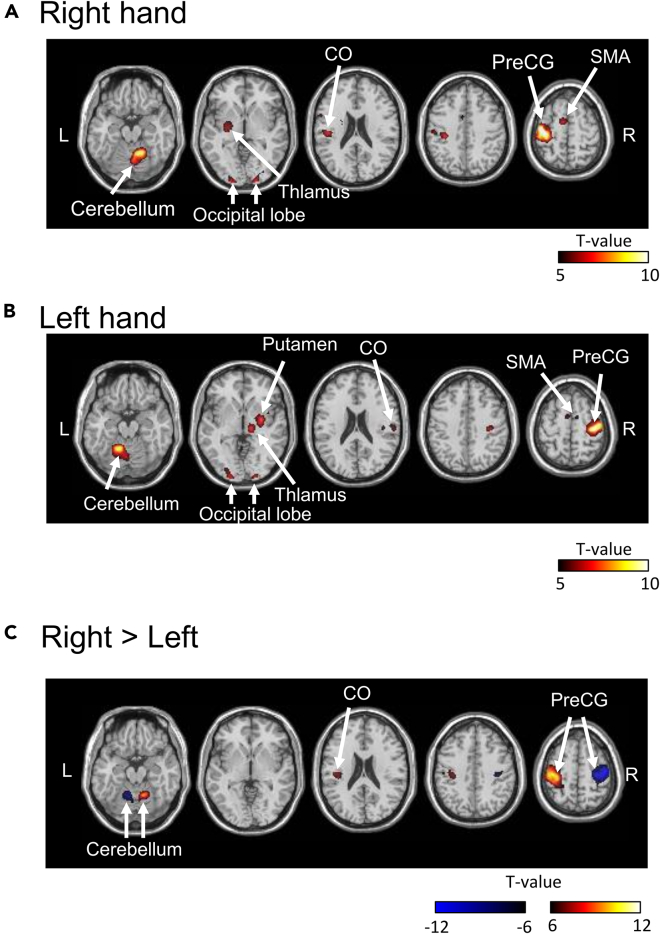
Hand preference is one of the behavioral expressions of lateralization in the brain. Previous fMRI studies showed the activation in several regions including the motor cortex and the cerebellum during single-hand movement. However, functional connectivity related to hand preference has not been investigated. Here, we used the generalized psychophysiological interaction (gPPI) approach to investigate the alteration of functional connectivity during single-hand movement from the resting state in right-hand subjects. The functional connectivity in interhemispheric motor-related regions including the supplementary motor area, the precentral gyrus, and the cerebellum was significantly increased during non-dominant hand movement, while functional connectivity was not increased during dominant hand movement. The general linear model (GLM) showed activation in contralateral supplementary motor area, contralateral precentral gyrus, and ipsilateral cerebellum during right- or left-hand movement. These results indicate that a combination of GLM and gPPI analysis can detect the lateralization of hand preference more clearly.
Keywords: Biological sciences; Neuroscience; Techniques in neuroscience.
© 2023 The Author(s).
Conflict of interest statement
The authors declare no competing interests.
Figures


Similar articles
-
Handedness and effective connectivity of the motor system.Neuroimage. 2014 Oct 1;99:451-60. doi: 10.1016/j.neuroimage.2014.05.048. Epub 2014 May 23. Neuroimage. 2014. PMID: 24862079 Free PMC article.
-
Cerebello-Cortical Differences in Effective Connectivity of the Dominant and Non-dominant Hand during a Visuomotor Paradigm of Grip Force Control.Front Hum Neurosci. 2017 Oct 25;11:511. doi: 10.3389/fnhum.2017.00511. eCollection 2017. Front Hum Neurosci. 2017. PMID: 29123475 Free PMC article.
-
Altered regional and circuit resting-state activity in patients with occult spastic diplegic cerebral palsy.Pediatr Neonatol. 2018 Aug;59(4):345-351. doi: 10.1016/j.pedneo.2017.10.003. Epub 2017 Oct 7. Pediatr Neonatol. 2018. PMID: 29066071
-
Sex differences in the neural underpinnings of unimanual and bimanual control in adults.Exp Brain Res. 2023 Mar;241(3):793-806. doi: 10.1007/s00221-023-06561-5. Epub 2023 Feb 4. Exp Brain Res. 2023. PMID: 36738359
-
Network dynamics engaged in the modulation of motor behavior in healthy subjects.Neuroimage. 2013 Nov 15;82:68-76. doi: 10.1016/j.neuroimage.2013.05.123. Epub 2013 Jun 6. Neuroimage. 2013. PMID: 23747288
Cited by
-
Comparison of local activation, functional connectivity, and structural connectivity in the N-back task.Front Neurosci. 2024 Mar 4;18:1337976. doi: 10.3389/fnins.2024.1337976. eCollection 2024. Front Neurosci. 2024. PMID: 38516310 Free PMC article.
-
Transfer of motor learning is associated with patterns of activity in the default mode network.PLoS Biol. 2025 Aug 14;23(8):e3003268. doi: 10.1371/journal.pbio.3003268. eCollection 2025 Aug. PLoS Biol. 2025. PMID: 40811438 Free PMC article.
-
Alteration of prefrontal functional connectivity in preclinical Alzheimer's disease: an fNIRS study.Front Aging Neurosci. 2025 Mar 11;17:1507180. doi: 10.3389/fnagi.2025.1507180. eCollection 2025. Front Aging Neurosci. 2025. PMID: 40134533 Free PMC article.
References
-
- Ciavarro M., Grande E., Pavone L., Bevacqua G., De Angelis M., di Russo P., Morace R., Committeri G., Grillea G., Bartolo M., et al. Pre-surgical fMRI Localization of the Hand Motor Cortex in Brain Tumors: Comparison Between Finger Tapping Task and a New Visual-Triggered Finger Movement Task. Front. Neurol. 2021;12 doi: 10.3389/fneur.2021.658025. - DOI - PMC - PubMed
LinkOut - more resources
Full Text Sources
