

Electrophysiological evidence for increased auditory crossmodal activity in adult ADHD
- PMID: 37706153
- PMCID: PMC10495991
- DOI: 10.3389/fnins.2023.1227767
Electrophysiological evidence for increased auditory crossmodal activity in adult ADHD
Abstract
Background: Attention deficit and hyperactivity disorder (ADHD) is a neurodevelopmental disorder characterized by core symptoms of inattention, and/or impulsivity and hyperactivity. In order to understand the basis for this multifaceted disorder, the investigation of sensory processing aberrancies recently reaches more interest. For example, during the processing of auditory stimuli comparable low sensory thresholds account for symptoms like higher distractibility and auditory hypersensitivity in patients with ADHD. It has further been shown that deficiencies not only exist on an intramodal, but also on a multimodal level. There is evidence that the visual cortex shows more activation during a focused auditory task in adults with ADHD than in healthy controls. This crossmodal activation is interpreted as the reallocation of more attentional resources to the visual domain as well as deficient sensory inhibition. In this study, we used, for the first time, electroencephalography to identify a potential abnormal regulated crossmodal activation in adult ADHD.
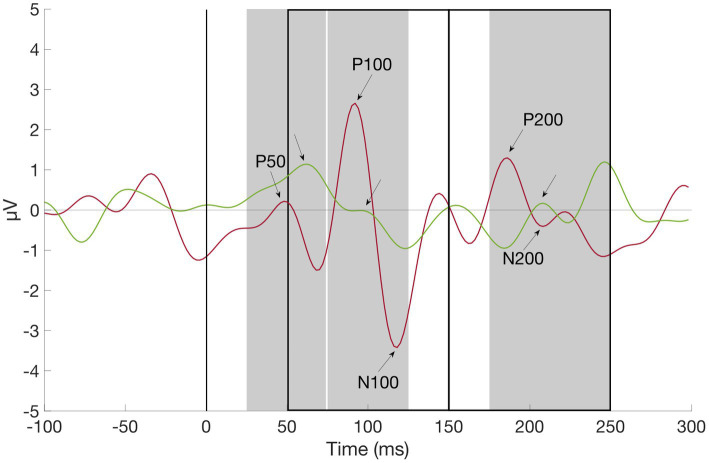
Methods: 15 adult subjects with clinically diagnosed ADHD and 14 healthy controls comparable in age and gender were included. ERP components P50, P100, N100, P200 and N200 were measured during the performance of a unimodal auditory and visual discrimination task in a block design. Sensory profiles and ADHD symptoms were assessed with inattention as well as childhood ADHD scores. For evaluating intramodal and crossmodal activations, we chose four EEG channels for statistical analysis and group-wise comparison.
Results: At the occipital channel O2 that reflects possible crossmodal activations, a significantly enhanced P200 amplitude was measured in the patient group. At the intramodal channels, a significantly enhanced N200 amplitude was observed in the control group. Statistical analysis of behavioral data showed poorer performance of subjects with ADHD as well as higher discrimination thresholds. Further, the correlation of the assessed sensory profiles with the EEG parameters revealed a negative correlation between the P200 component and sensation seeking behavior.
Conclusion: Our findings show increased auditory crossmodal activity that might reflect an altered stimulus processing resource allocation in ADHD. This might induce consequences for later, higher order attentional deployment. Further, the enhanced P200 amplitude might reflect more sensory registration and therefore deficient inhibition mechanisms in adults with ADHD.
Keywords: EEG; attention deficit and hyperactivity disorder (ADHD); auditory; crossmodal activity; sensory processing; visual.
Copyright © 2023 Schramm, Goregliad Fjaellingsdal, Aslan, Jung, Lux, Schulze and Philipsen.
Conflict of interest statement
The authors declare that the research was conducted in the absence of any commercial or financial relationships that could be construed as a potential conflict of interest.
Figures


References
-
- American Psychiatric Association (2013). Diagnostic and statistical manual of mental disorders. Diagnostic and statistical manual of mental disorders Diagnos. Statist. Manual Ment. Disord. doi: 10.1176/APPI.BOOKS.9780890425596 - DOI
-
- Barry R. J., Clarke A. R., McCarthy R., Selikowitz M., Brown C. R., Heaven P. C. L. (2009). Event-related potentials in adults with attention-deficit/hyperactivity disorder: an investigation using an inter-modal auditory/visual oddball task. Int. J. Psychophysiol. 71, 124–131. doi: 10.1016/J.IJPSYCHO.2008.09.009, PMID: - DOI - PubMed
LinkOut - more resources
Full Text Sources
Research Materials