. 2023 Sep 1;40(9):msad199.
doi: 10.1093/molbev/msad199.

Interploidy Introgression Shaped Adaptation during the Origin and Domestication History of Brassica napus

Affiliations

Interploidy Introgression Shaped Adaptation during the Origin and Domestication History of Brassica napus

Tianpeng Wang et al. Mol Biol Evol. .

Abstract

Polyploidy is recurrent across the tree of life and known as an evolutionary driving force in plant diversification and crop domestication. How polyploid plants adapt to various habitats has been a fundamental question that remained largely unanswered. Brassica napus is a major crop cultivated worldwide, resulting from allopolyploidy between unknown accessions of diploid B. rapa and B. oleracea. Here, we used whole-genome resequencing data of accessions representing the majority of morphotypes and ecotypes from the species B. rapa, B. oleracea, and B. napus to investigate the role of polyploidy during domestication. To do so, we first reconstructed the phylogenetic history of B. napus, which supported the hypothesis that the emergence of B. napus derived from the hybridization of European turnip of B. rapa and wild B. oleracea. These analyses also showed that morphotypes of swede and Siberian kale (used as vegetable and fodder) were domesticated before rapeseed (oil crop). We next observed that frequent interploidy introgressions from sympatric diploids were prominent throughout the domestication history of B. napus. Introgressed genomic regions were shown to increase the overall genetic diversity and tend to be localized in regions of high recombination. We detected numerous candidate adaptive introgressed regions and found evidence that some of the genes in these regions contributed to phenotypic diversification and adaptation of different morphotypes. Overall, our results shed light on the origin and domestication of B. napus and demonstrate interploidy introgression as an important mechanism that fuels rapid diversification in polyploid species.

Keywords: Brassica napus; Brassica; adaptive introgression; domestication; interploidy introgression; origin; polyploidy.


Figures

<sc>Fig.</sc> 1.
Fig. 1.
Phylogenetic relationship and population structure of the A lineage. (A) The phylogeny of the A lineage with B. nigra as the outgroup. The tip colors of the phylogeny indicate subspecies/morphotypes, whereas the branch colors denote the ploidy level. Branches with reliable bootstrap value (>70) are labeled with black point at the corresponding nodes. (B) PCA of the B. rapa and B. napus accessions. The proportions of variance explained by the top three principal components are presented in the axis labels. Colored points represent different morphotypes and are the same as the tip colors in the phylogeny. (C) Model-based Bayesian clustering performed with the number of ancestry kinship (K) set to 11. The different colors of vertical bar represent contributions to the K-groups. The colored segments of each horizontal bar indicate morphotypes.
<sc>Fig.</sc> 2.
Fig. 2.
Phylogenetic relationship and population structure of the C lineage. (A) The phylogeny of the C lineage with B. nigra as the outgroup. The tip colors of the phylogeny indicate subspecies/morphotypes, whereas the branch colors denote the ploidy level. Branches with reliable bootstrap value (>70) are labeled with black point at the corresponding nodes. (B) PCA of the B. oleracea and B. napus accessions. The proportions of variance explained by the top three principal components are presented in the axis labels. Colored points represent different morphotypes and are the same as the tip colors in the phylogeny. (C) Model-based Bayesian clustering performed with the number of ancestry kinship (K) set to 10. The different colors of vertical bar represent contributions to the K-groups. The colored segments of each horizontal bar indicate morphotypes.
<sc>Fig.</sc> 3.
Fig. 3.
Genomic features of the A and C lineages. (A) The nucleotide diversity over 100-kb nonoverlapping windows in the A and C lineages. The middle line indicates the median value. The top and bottom of whisker denote the maximum and minimum value or the third quartile plus 1.5× the interquartile range (IQR). (B) Comparison of Fst and nucleotide diversity between B. napus morphotypes and its direct progenitors. The value in each circle indicates the nucleotide diversity of the group, whereas the value on each line represents Fst value between groups. (C and D) Demographic history of the A and C lineages inferred by MSMC model. Generation estimates were inferred by assuming that mutation rates were 1.5 × 10⁻⁸ per synonymous site per generation, respectively, and that the generation time was 1 year.
<sc>Fig.</sc> 4.
Fig. 4.
Frequent past interploidy introgression during B. napus domestication. (A and D) Heatmaps indicate maximum pairwise Patterson's D statistics measurements between pairs of morphotypes across all combinations in the A and C lineages. Asterisks indicate a significant value (|Z| > 4). (B, C, E, and F) f4-ratio statistics to test the proportion of interploidy introgression in specific groups. Colors of filled circles indicate a significant value threshold (|Z| > 4). The top and bottom whiskers correspond to 1 SE calculated across the A and C subgenomes using a weighted blocked jackknife. (Complete data sets are available in supplementary tables S3 and S4, Supplementary Material online.)
<sc>Fig.</sc> 5.
Fig. 5.
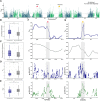
Genomic characteristics of the putative introgressed regions in semiwinter rapeseed. (A) Manhattan plot showing the fdM value across the A subgenome. The dashed line shows the cutoff value, calculated by highest x% of fdM values, where x was determined by the corresponding f4-ratio estimate. (B, C, D, and E) Diagrams indicate the comparison of nucleotide diversity, recombination rate, and genetic divergence (Fst and Dxy) between putative introgressed and nonintrogressed regions in semiwinter rapeseed. Mann–Whitney tests were used to assess significance between introgressed and nonintrogressed regions with asterisks indicating significance level. ***P < 0.001. (F and G) Magnification of the two representative adaptive introgressed regions showed by fdM and selective sweeps.

References

    1. Allender CJ, King GJ. 2010. Origins of the amphiploid species Brassica napus L. investigated by chloroplast and nuclear molecular markers. BMC Plant Biol. 10(1):54. - PMC - PubMed
    1. An H, Qi X, Gaynor ML, Hao Y, Gebken SC, Mabry ME, McAlvay AC, Teakle GR, Conant GC, Barker MS, et al. . 2019. Transcriptome and organellar sequencing highlights the complex origin and diversification of allotetraploid Brassica napus. Nat Commun. 10(1):2878. - PMC - PubMed
    1. Arrigo N, Barker MS. 2012. Rarely successful polyploids and their legacy in plant genomes. Curr Opin Plant Biol. 15(2):140–146. - PubMed
    1. Baack EJ, Rieseberg LH. 2007. A genomic view of introgression and hybrid speciation. Curr Opin Genet Dev. 17(6):513–518. - PMC - PubMed
    1. Bolger AM, Lohse M, Usadel B. 2014. Trimmomatic: a flexible trimmer for illumina sequence data. Bioinformatics. 30(15):2114–2120. - PMC - PubMed

Publication types