

Neoadjuvant Durvalumab Alone or Combined with Novel Immuno-Oncology Agents in Resectable Lung Cancer: The Phase II NeoCOAST Platform Trial
- PMID: 37707791
- PMCID: PMC10618740
- DOI: 10.1158/2159-8290.CD-23-0436
Neoadjuvant Durvalumab Alone or Combined with Novel Immuno-Oncology Agents in Resectable Lung Cancer: The Phase II NeoCOAST Platform Trial
Abstract
Neoadjuvant chemoimmunotherapy improves pathologic complete response rate and event-free survival in patients with resectable non-small cell lung cancer (NSCLC) versus chemotherapy alone. NeoCOAST was the first randomized, multidrug platform trial to examine novel neoadjuvant immuno-oncology combinations for patients with resectable NSCLC, using major pathologic response (MPR) rate as the primary endpoint. Eighty-three patients received a single cycle of treatment: 26 received durvalumab (anti-PD-L1) monotherapy, 21 received durvalumab plus oleclumab (anti-CD73), 20 received durvalumab plus monalizumab (anti-NKG2A), and 16 received durvalumab plus danvatirsen (anti-STAT3 antisense oligonucleotide). MPR rates were higher for patients in the combination arms versus durvalumab alone. Safety profiles for the combinations were similar to those of durvalumab alone. Multiplatform immune profiling suggested that improved MPR rates in the durvalumab plus oleclumab and durvalumab plus monalizumab arms were associated with enhanced effector immune infiltration of tumors, interferon responses and markers of tertiary lymphoid structure formation, and systemic functional immune cell activation.
Significance: A neoadjuvant platform trial can rapidly generate clinical and translational data using candidate surrogate endpoints like MPR. In NeoCOAST, patients with resectable NSCLC had improved MPR rates after durvalumab plus oleclumab or monalizumab versus durvalumab alone and tumoral transcriptomic signatures indicative of augmented immune cell activation and function. See related commentary by Cooper and Yu, p. 2306. This article is featured in Selected Articles from This Issue, p. 2293.
Trial registration: ClinicalTrials.gov NCT03794544.
©2023 The Authors; Published by the American Association for Cancer Research.
Figures
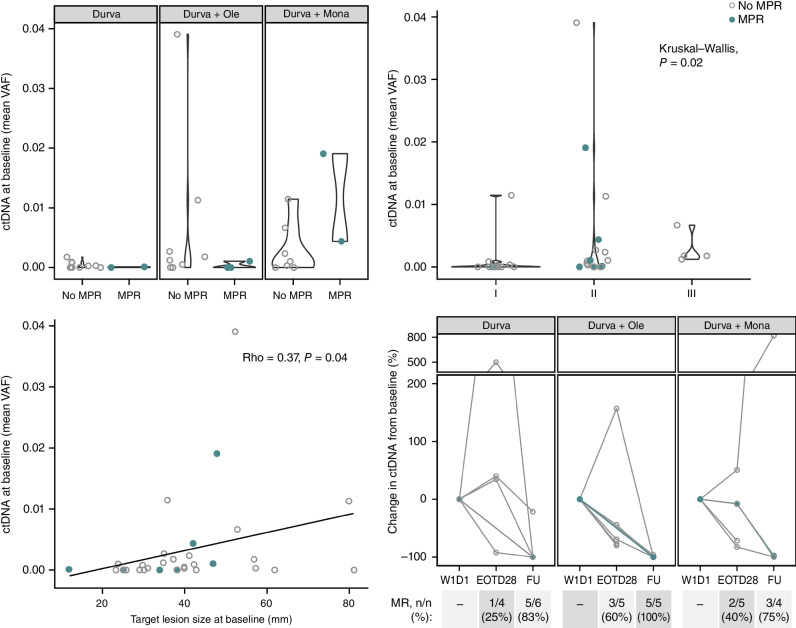
![Figure 2. Pathologic regressions at surgery; genomic profiles of ITT population and correlates with pathologic responses. A, The magnitude of pathologic response is shown by percent residual viable tumor cells in resected tumor and nodal samples for all patients with available data (total N = 75; durvalumab monotherapy arm: n = 24; durvalumab + oleclumab arm: n = 18; durvalumab + monalizumab arm: n = 18; durvalumab + danvatirsen arm: n = 15), and annotated with histologic subtype, tumor mutational burden (TMB; mutations/megabase), and history of smoking. PD-L1 status (≥1% positive; <1% negative) from baseline tumor biopsies was determined by IHC (SP263) for all evaluable patients (n = 33). Presence of activating EGFR mutations or ALK fusions was determined by whole-exome sequencing (n = 34). B, Residual viable tumor cells (RVT) from resected tumor and nodal samples are reported as 0% to 100%, and MPR (RVT ≤10%) for n = 60 patients (durvalumab monotherapy: n = 24, durvalumab + oleclumab: n = 18; durvalumab + monalizumab: n = 18). Best response by Response Evaluation Criteria in Solid Tumors version 1.1 (RECIST) is reported for n = 58 patients. Somatic tumor alterations identified in EGFR, KRAS, STK11, KEAP1, TP53, ALK, and RET genes are reported from tumor tissue for n = 35 patients. For patients with evaluable circulating tumor DNA (ctDNA) samples at baseline, each patient is identified as having detected or no detected ctDNA at baseline. For patients with detectable ctDNA at baseline (total N = 20; durvalumab monotherapy: n = 6; durvalumab + oleclumab: n = 7; durvalumab + monalizumab: n = 7), molecular response is depicted at end-of-treatment (day 28, n = 14) and follow-up (day 105, n = 15) time points for all patients with evaluable ctDNA at those time points and represented as complete molecular response [100% reduction in variant allele frequency (VAF) from baseline, also referred to as complete clearance], partial molecular response (≥50% reduction in VAF from baseline), or no molecular response (<50% reduction in VAF from baseline). BESTRESP, best response; FU, follow-up; MR, molecular response; WT, wild-type.](https://cdn.ncbi.nlm.nih.gov/pmc/blobs/6bf3/10618740/cb4db42ba0d5/2394fig2.jpg)
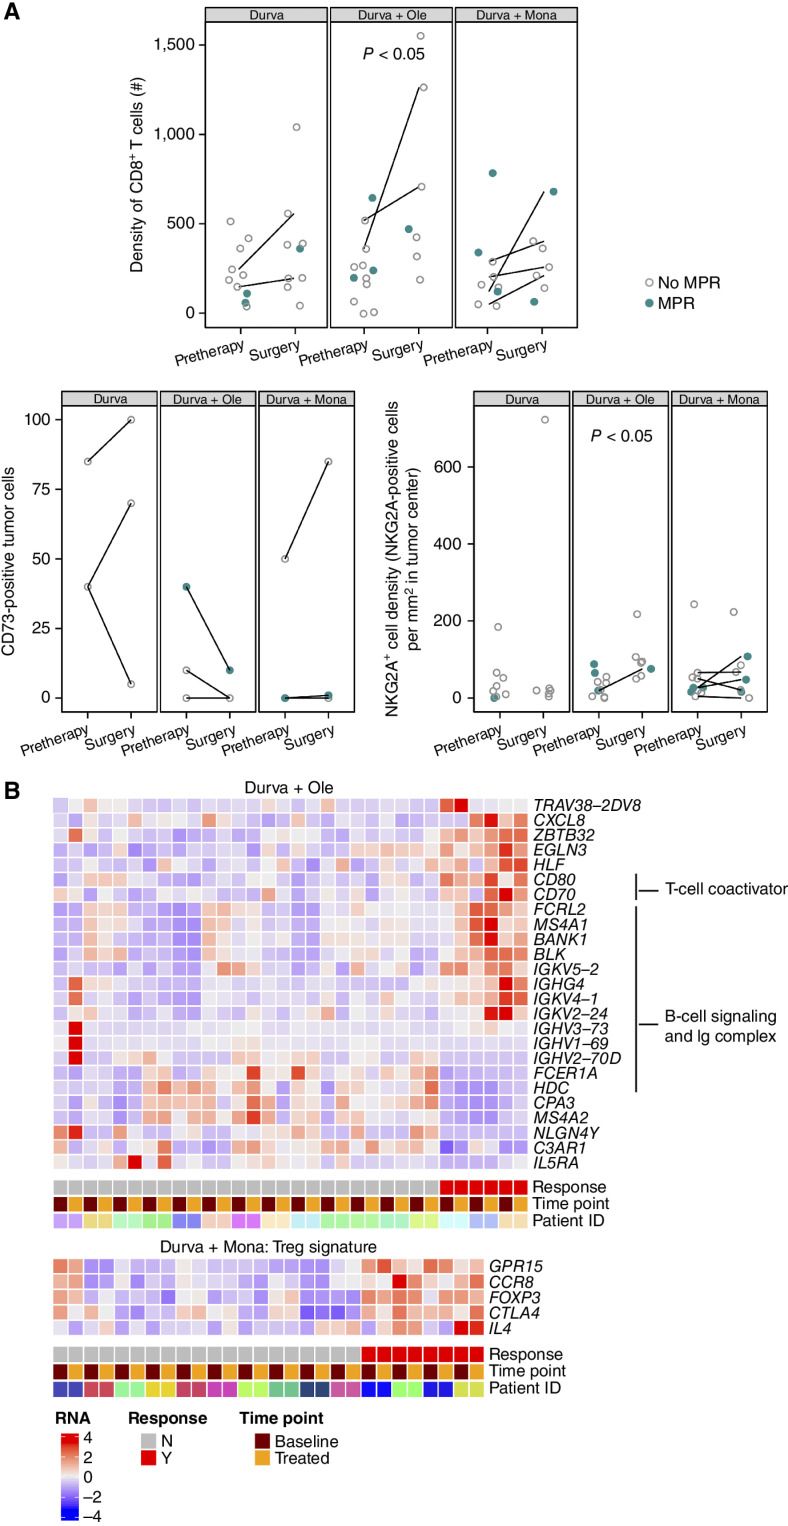
![Figure 3. Treatment-related transcriptomic changes in tumor and peripheral blood. A, Left: differential gene expression between tumors collected at pretherapy and at surgery was assessed in all patients with evaluable paired tumor samples (total, n = 13 patients). Paired samples in each arm had the following MPR rates: durvalumab monotherapy: 0/4; durvalumab + oleclumab: 1/5; durvalumab + monalizumab: 2/4. Right: gene set enrichment analysis (GSEA) was used to identify gene sets and signatures significantly down- or upregulated from pretherapy to surgery on each treatment arm. The durvalumab monotherapy arm is not pictured, as no significant gene enrichment was observed. B, Patients with MPR are indicated in closed teal circle; patients without MPR are indicated in open gray circle. Top and top middle: mRNA from select genes associated with T cells, NK cells, and cytotoxicity is shown from pretreatment and surgery tumor tissue (n = 69 samples; n = 35 pretherapy, n = 34 surgery). Patients with paired samples (an evaluable sample from both pretreatment and surgery) are connected by a line. Bottom and bottom middle: mRNA from select genes associated with tumor and blood lymphocyte recruitment is shown from pretherapy to end-of-treatment peripheral blood collections (n = 120 samples; n = 65 pretherapy, n = 55 end-of-treatment). Y-axes units are all [Log2 (TPM + 0.01)], where TPM is transcripts per million. DN, down; Durva, durvalumab; IPA, Ingenuity Pathway Analysis; Mona, monalizumab; Ole, oleclumab.](https://cdn.ncbi.nlm.nih.gov/pmc/blobs/6bf3/10618740/df6d114ca665/2394fig3.jpg)
Comment in
-
The Promise and Limitations of Neoadjuvant Immune-Checkpoint Blockade in Resectable Non-Small Cell Lung Cancer.Cancer Discov. 2023 Nov 1;13(11):2306-2309. doi: 10.1158/2159-8290.CD-23-0949. Cancer Discov. 2023. PMID: 37909090
-
Dual immuno-oncology agents as neoadjuvant therapy for patients with resectable non-small cell lung cancer.Transl Lung Cancer Res. 2024 Feb 29;13(2):229-235. doi: 10.21037/tlcr-23-738. Epub 2024 Feb 20. Transl Lung Cancer Res. 2024. PMID: 38496701 Free PMC article. No abstract available.
-
Novel immunotherapy combinations in neoadjuvant non-small cell lung cancer (NSCLC): a better chance at cure?Transl Lung Cancer Res. 2024 Mar 29;13(3):673-677. doi: 10.21037/tlcr-23-735. Epub 2024 Mar 15. Transl Lung Cancer Res. 2024. PMID: 38601451 Free PMC article. No abstract available.
References
-
- Pignon JP, Tribodet H, Scagliotti GV, Douillard JY, Shepherd FA, Stephens RJ, et al. Lung adjuvant cisplatin evaluation: a pooled analysis by the LACE Collaborative Group. J Clin Oncol 2008;26:3552–9. - PubMed
-
- Altorki NK, McGraw TE, Borczuk AC, Saxena A, Port JL, Stiles BM, et al. Neoadjuvant durvalumab with or without stereotactic body radiotherapy in patients with early-stage non-small-cell lung cancer: a single-centre, randomised phase 2 trial. Lancet Oncol 2021;22:824–35. - PubMed
-
- Besse B, Adam J, Cozic N, Chaput-Gras N, Planchard D, Mezquita L, et al. 1215O-SC neoadjuvant atezolizumab (A) for resectable non-small cell lung cancer (NSCLC): results from the phase II PRINCEPS trial. Ann Oncol 2020;31:S794–S5.
Publication types
MeSH terms
Substances
Associated data
LinkOut - more resources
Full Text Sources
Medical
Research Materials
Miscellaneous
