. 2023 Oct 23;8(20):e169208.
doi: 10.1172/jci.insight.169208.

Itaconate-producing neutrophils regulate local and systemic inflammation following trauma

Affiliations

Itaconate-producing neutrophils regulate local and systemic inflammation following trauma

Janna L Crossley et al. JCI Insight. .

Abstract

Modulation of the immune response to initiate and halt the inflammatory process occurs both at the site of injury as well as systemically. Due to the evolving role of cellular metabolism in regulating cell fate and function, tendon injuries that undergo normal and aberrant repair were evaluated by metabolic profiling to determine its impact on healing outcomes. Metabolomics revealed an increasing abundance of the immunomodulatory metabolite itaconate within the injury site. Subsequent single-cell RNA-Seq and molecular and metabolomic validation identified a highly mature neutrophil subtype, not macrophages, as the primary producers of itaconate following trauma. These mature itaconate-producing neutrophils were highly inflammatory, producing cytokines that promote local injury fibrosis before cycling back to the bone marrow. In the bone marrow, itaconate was shown to alter hematopoiesis, skewing progenitor cells down myeloid lineages, thereby regulating systemic inflammation. Therapeutically, exogenous itaconate was found to reduce injury-site inflammation, promoting tenogenic differentiation and impairing aberrant vascularization with disease-ameliorating effects. These results present an intriguing role for cycling neutrophils as a sensor of inflammation induced by injury - potentially regulating immune cell production in the bone marrow through delivery of endogenously produced itaconate - and demonstrate a therapeutic potential for exogenous itaconate following tendon injury.

Keywords: Immunology; Inflammation; Neutrophils.


Figures
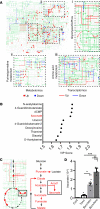
Figure 1
Figure 1. Metabolic analysis shows itaconate accumulation following burn/tenotomy.
(A) Metabolomics (dots) and transcriptomic (22) (lines) analysis conducted on the tendon injury site mapped on to “Metabolic Pathways” KEGG schematic (green). Colors denote increased (red) and decreased (blue) abundance in injury sites 7 days after burn/tenotomy relative to uninjured controls. Highly regulated regions, including glycolysis/OxPhos (region i), purine/pyrimidine metabolism (region ii), and amino acid metabolism (region iii), are expanded for clarity. (B) Top 10 differentially enriched metabolites within the Achilles tendon region from uninjured control, tenotomy, burn/skin incision, and burn/tenotomy. (C) Glycolysis/TCA cycle pathways with relevant components shown on right. Red denotes increased metabolites (text) and enzyme expression (arrows). (D) Itaconate abundance within each injury condition. n = 5. Data are shown as mean ± SD. *P < 0.05, **P < 0.01, ***P < 0.001, determined by 2-way ANOVA followed by Tukey’s multiple-comparison test, relative to uninjured controls unless otherwise noted.
Figure 2
Figure 2. Itaconate is produced by a subset of highly mature neutrophils within the HO injury site.
(A) UMAP of scRNA-Seq data obtained from the tendon injury area 7 days after burn/tenotomy (62). Dashed box denotes neutrophil cluster. (B) Feature plot of Acod1 expression. (C) Feature plot of the neutrophil marker S100a8. (D) RNAscope of the injured tendon region stained for Acod1, as well as for neutrophils (S100a8) and macrophages (Aif1). Scale bar: 50 µm. (E) UMAP of scRNA-Seq data obtained from the bone marrow, blood, and tendon injury site after burn/tenotomy surgery. (F) Feature plot of the neutrophil marker S100a8. (G). Feature plot of Acod1. (H) UMAP of subclustered neutrophils. (I) Expression of Acod1 and markers of early (Elane), middle (Ltf), and late-stage (Cebpb) neutrophils. (J) Ridge plot of neutrophil maturation clustered by physiological site of origin. (K) Expression of Acod1 in neutrophils clustered by site of origin. (L) Expression of Acod1 as well as neutrophil (S100a8) and macrophage (Aif1) markers in cells fractionated into neutrophils, macrophages, and “rest” from the bone marrow, blood, and tendon injury site. n = 4/site. (M) Levels of itaconate in neutrophils, macrophages, and “rest” isolated from the blood or tendon injury site. (N) Trajectory analysis of neutrophils colored by neutrophil subcluster (region i), site of origin (region ii), or pseudotime (region iii). (O) Expression pattern of early (Elane), middle (Ltf), and late-stage (Cebpb) neutrophil markers, overall maturation score, and Acod1 expression across neutrophil trajectory pseudotime. Data are shown as mean ± SD. *P < 0.05, **P < 0.01, ***P < 0.001, determined by 2-way ANOVA followed by Tukey’s multiple-comparison test, relative to tendon injury site “rest” unless otherwise noted.
Figure 3
Figure 3. Mature neutrophils within the HO-forming injury site contribute to prolonged local inflammation.
(A) Expression profile of genes differentially expressed across neutrophil pseudotime. (B) Pathway analysis of pseudotime DEGs enriched with the terminal neutrophil stage. Red numbers denote number of differentially expressed genes found within each pathway. (C) Heatmap showing expression of terminal neutrophil genes by pseudotime, clustered by site of origin. (D) Expression of indicated genes within neutrophils derived from different sites. (E) Indicated protein abundance within the bone marrow, blood, and HO site. n = 5. Data are shown as mean ± SD. ***P < 0.001, determined by 1-way ANOVA followed by Tukey’s multiple-comparison test, relative to bone marrow unless otherwise noted.
Figure 4
Figure 4. Itaconate produced by stimulated neutrophils is delivered to the bone marrow.
(A) Expression of ACOD1 in human neutrophils isolated from peripheral blood and stimulated with TNF-α or varying doses of a cell membrane preparation from S. aureus (MRSA-CM). (B) Metabolomic profiling of itaconate in stimulated neutrophils. Proline is shown as a control. (C) Itaconate and lactate levels in cell bodies and conditioned media from freshly isolated, unstimulated, and TNF-α–stimulated human neutrophils. (D) Dot plot of Cxcr2 and Cxcr4 across different anatomical sites. (E) Expression of Cxcr2 and Cxcr4 across neutrophil pseudotime. (F) Confocal image of bone marrow from Cd169/Tomato mice showing injury-site neutrophils harvested from donor mice and dyed using a membrane label following i.v. injection (green) and Tomato+ macrophages (red) at indicated time points after injection. Scale bar: 25 μm. (G) Flow analysis of neutrophils and monocytes/macrophages from Cd169/Tomato mouse bone marrow injected i.v. with membrane-labeled neutrophils at indicated time points after injection. (H) Cxcr2/Cxcr4 ratio assessed by qPCR of neutrophils in vitro cultured with or without stimulation with TNF-α or MRSA-CM. Dotted line denotes a 1:1 ratio of Cxcr2 and Cxcr4 transcripts. (I) Relative expression of Acod1 assessed by qPCR in cultured neutrophils with or without TNF-α or MRSA-CM stimulation. Data are shown as mean ± SD. *P < 0.05, **P < 0.01, ***P < 0.001, determined by 2-way ANOVA followed by Tukey’s multiple-comparison test, relative to time 4 hours after stimulation (T4) unstimulated controls (A) or t0 (H and I) unless otherwise stated.
Figure 5
Figure 5. Treatment with exogenous itaconate alters bone marrow hematopoiesis.
(A) Flow analysis of bone marrow progenitors from uninjured mice, as well as mice 3 and 7 days after burn/tenotomy with or without treatment with exogenous itaconate. (B) Flow analysis of bone marrow and spleen erythrocytes. (C) Flow analysis of total (from A) and unipotent bone marrow myeloid/granulocyte progenitors. (D) Flow analysis of granulocyte and monocyte progenitors. Data are shown as mean ± SD. *P < 0.05, **P < 0.01, ***P < 0.001, determined by 2-way ANOVA followed by Tukey’s multiple-comparison test, relative to uninjured saline controls unless otherwise denoted.
Figure 6
Figure 6. Therapeutic delivery of itaconate mitigates HO formation and progression.
(A) Representative μ-CT at 9 weeks after burn/tenotomy in mice treated with itaconate or saline control. Heterotopic bone is highlighted in blue (bone-associated) and orange (tendon-associated). (B) Quantification of total and bone-associated HO formation by μ-CT. n = 6–11 per treatment group. (C) H&E of HO sites 9 weeks after burn/tenotomy injury. Dotted lines denote region of HO. (D) UMAP of scRNA-Seq data isolated from the tendon injury site of mice treated with itaconate and saline controls. (E) Marker genes used to identify cell clusters. (F) Module scores of indicated inflammatory pathways within immune cell populations. (G) Luminex analysis of protein concentrations within the tendon injury area. (H) Percent of scRNA-Seq cells predicted to be proliferating. n = 5/treatment. (I) Immunofluorescence of KI67 in burn/tenotomy mice 7 days after injury treated with either saline control or itaconate. Dotted line denotes severed Achilles tendon end. Scale bar: 100 µm. (J) Expression of genes involved in inflammatory signaling (left) or of markers for more progenitor (middle) or mature (right) tenogenic cells within the MPC cluster. (K) Module scores for terms linked to angiogenesis and vessel maturation within the endothelial cell cluster. Data are shown as mean ± SD. *P < 0.05, **P < 0.01, ***P < 0.001, determined by nonparametric 2-tailed t test (B, G, and I), Wilcoxon test (F), or 2-way ANOVA followed by Tukey’s multiple-comparison test (G), relative to saline controls.

Similar articles

Cited by

References

    1. Medzhitov R. Inflammation 2010: new adventures of an old flame. Cell. 2010;140(6):771–776. doi: 10.1016/j.cell.2010.03.006. - DOI - PubMed
    1. Osuka A, et al. Immune response to traumatic injury: harmony and discordance of immune system homeostasis. Acute Med Surg. 2014;1(2):63–69. doi: 10.1002/ams2.17. - DOI - PMC - PubMed
    1. Sorkin M, et al. Regulation of heterotopic ossification by monocytes in a mouse model of aberrant wound healing. Nat Commun. 2020;11(1):722. doi: 10.1038/s41467-019-14172-4. - DOI - PMC - PubMed
    1. Brown KV, et al. Comparison of development of heterotopic ossification in injured US and UK Armed Services personnel with combat-related amputations: preliminary findings and hypotheses regarding causality. J Trauma. 2010;69 Suppl 1:S116–S122. doi: 10.1097/TA.0b013e3181e44cc7. - DOI - PubMed
    1. Ranganathan K, et al. Heterotopic ossification: basic-science principles and clinical correlates. J Bone Joint Surg Am. 2015;97(13):1101–1111. doi: 10.2106/JBJS.N.01056. - DOI - PMC - PubMed

Publication types