. 2023 Nov 15;133(22):e164792.
doi: 10.1172/JCI164792.

A cyclic pyrrole-imidazole polyamide reduces pathogenic RNA in CAG/CTG triplet repeat neurological disease models

Affiliations

A cyclic pyrrole-imidazole polyamide reduces pathogenic RNA in CAG/CTG triplet repeat neurological disease models

Susumu Ikenoshita et al. J Clin Invest. .

Abstract

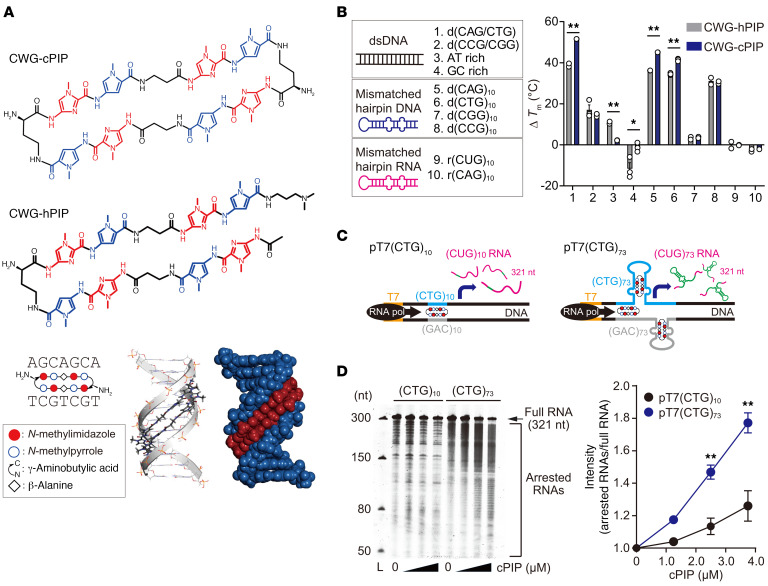
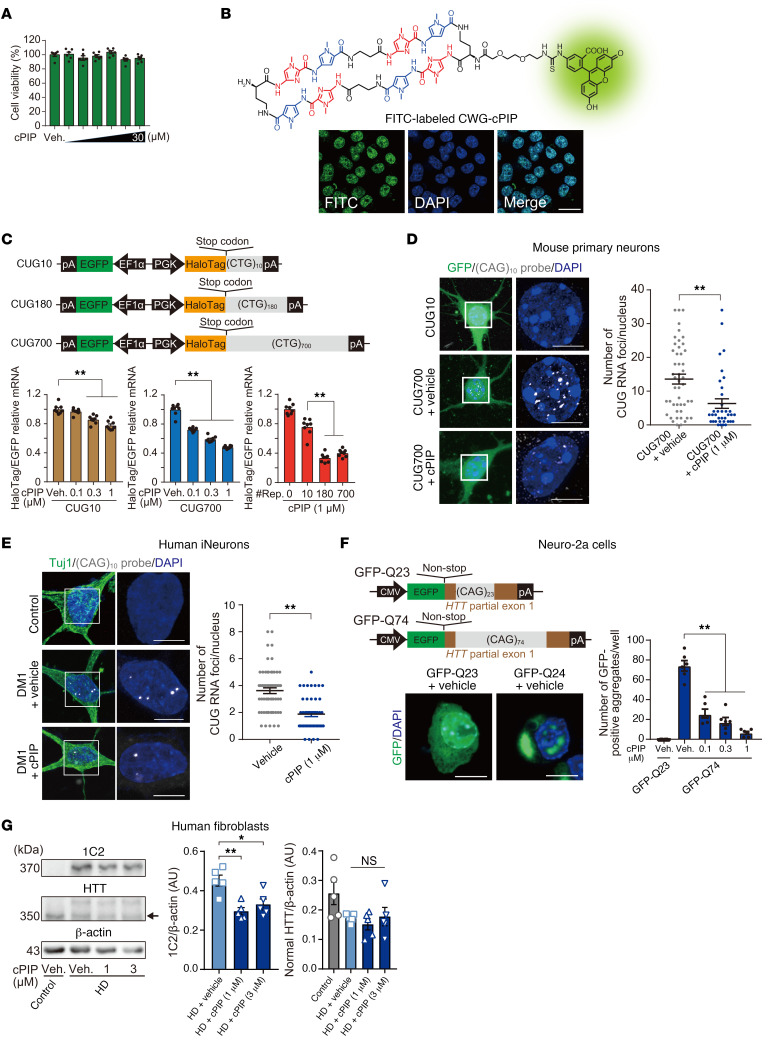
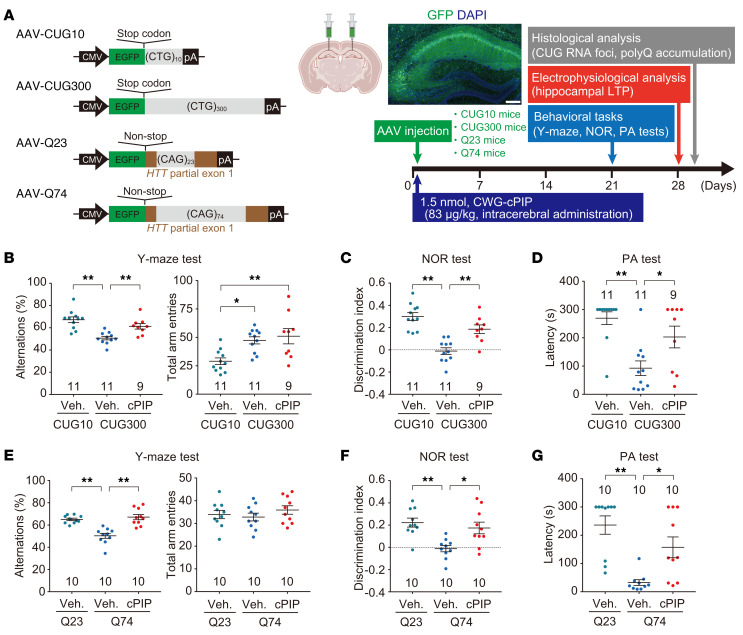
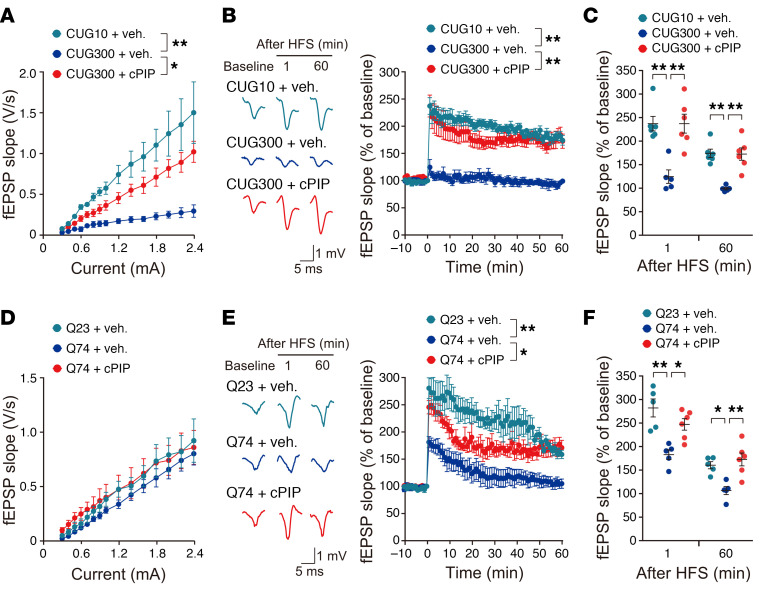
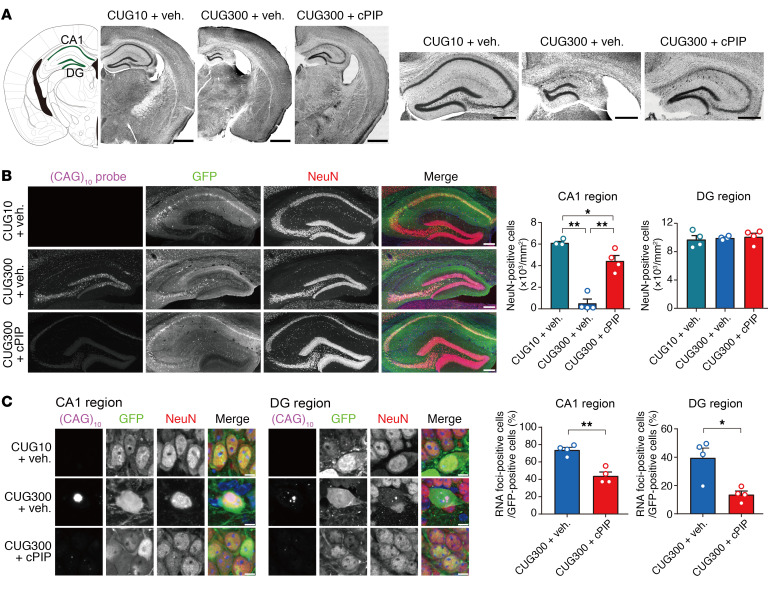
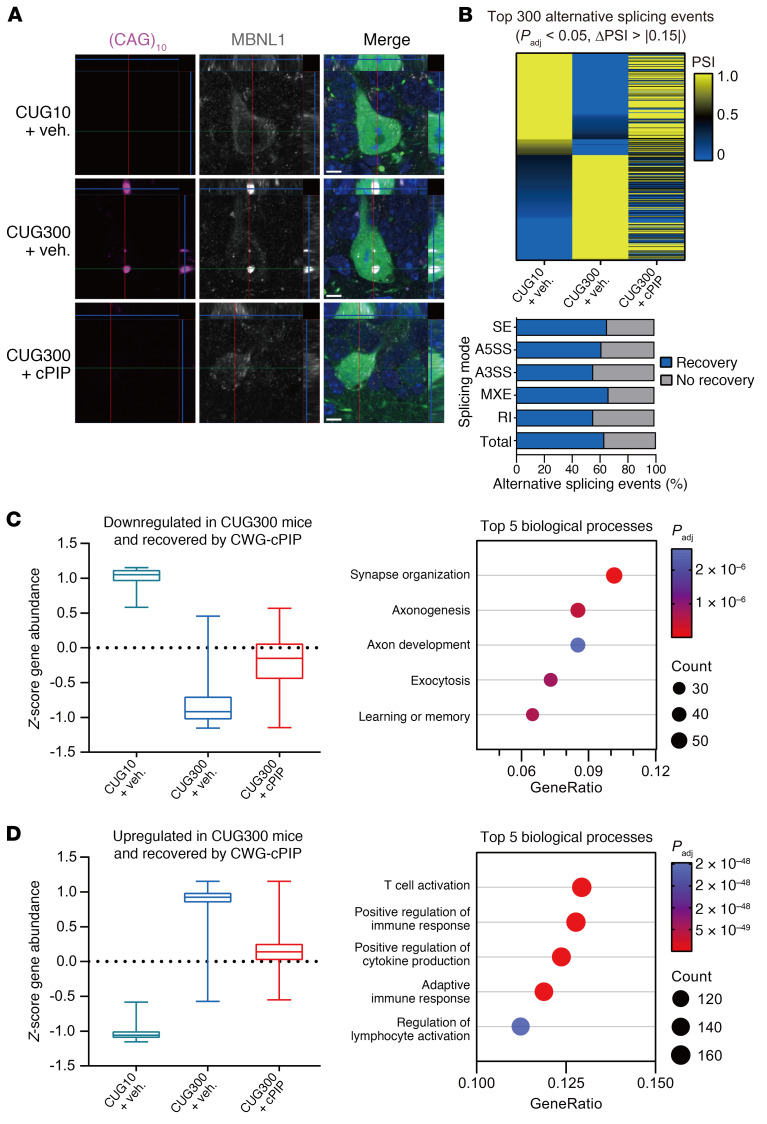
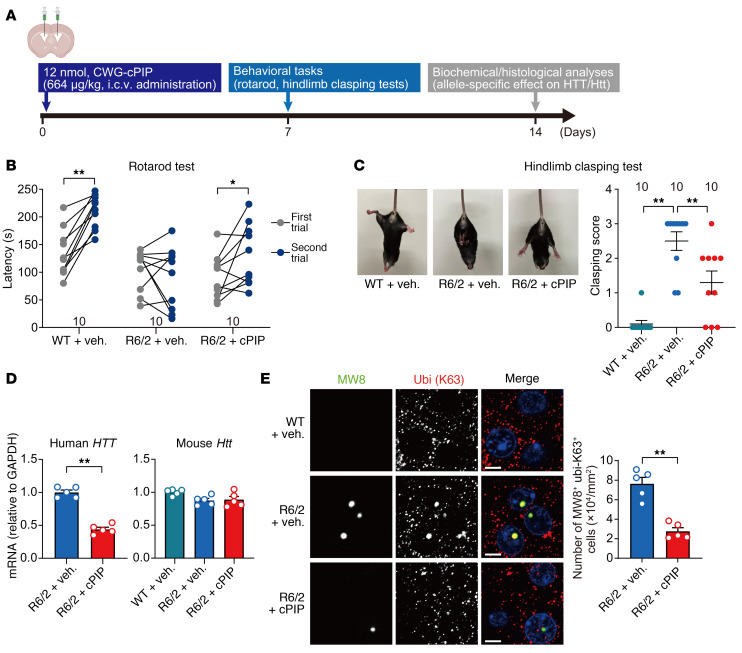
Expansion of CAG and CTG (CWG) triplet repeats causes several inherited neurological diseases. The CWG repeat diseases are thought to involve complex pathogenic mechanisms through expanded CWG repeat-derived RNAs in a noncoding region and polypeptides in a coding region, respectively. However, an effective therapeutic approach has not been established for the CWG repeat diseases. Here, we show that a CWG repeat DNA-targeting compound, cyclic pyrrole-imidazole polyamide (CWG-cPIP), suppressed the pathogenesis of coding and noncoding CWG repeat diseases. CWG-cPIP bound to the hairpin form of mismatched CWG DNA, interfering with transcription elongation by RNA polymerase through a preferential activity toward repeat-expanded DNA. We found that CWG-cPIP selectively inhibited pathogenic mRNA transcripts from expanded CWG repeats, reducing CUG RNA foci and polyglutamine accumulation in cells from patients with myotonic dystrophy type 1 (DM1) and Huntington's disease (HD). Treatment with CWG-cPIP ameliorated behavioral deficits in adeno-associated virus-mediated CWG repeat-expressing mice and in a genetic mouse model of HD, without cytotoxicity or off-target effects. Together, we present a candidate compound that targets expanded CWG repeat DNA independently of its genomic location and reduces both pathogenic RNA and protein levels. CWG-cPIP may be used for the treatment of CWG repeat diseases and improvement of clinical outcomes.

Keywords: Genetic diseases; Neuroscience; Noncoding RNAs; Therapeutics; Transcription.


Figures

Figure 1
Figure 1. Transcriptional inhibition of CWG repeat DNA by CWG-cPIP.
(A) Chemical structure of CWG-cPIP and CWG-hPIP; a schematic illustration of DNA sequence recognition of CWG-cPIP (bottom left); and molecular models of CWG-cPIP/double-stranded CWG-DNA complex by computer-assisted molecular simulation. (B) Nucleic acid sequences used for the Tm assay and quantification of ΔTm. The number on the x axis corresponds to the nucleic acid sequence on the left legend. *P < 0.05 and **P < 0.01, by 2-sided, unpaired Student’s t test. n = 2 [1. d(CAG/CTG); 3. AT rich; 5. d(CAG)10; 7. d(CGG)10; 9. r(CUG)10; 10. r(CAG)10]; n = 3 [2. d(CCG/CGG); 4. GC rich; 6. d(CTG)10; 8. d(CCG)10]. (C) Schematic representation of the in vitro transcription arrest assay. (D) Representative urea polyacrylamide gel electrophoresis for the in vitro transcription arrest assay (left). CWG-cPIP concentrations were 1.25, 2.5, and 3.75 μM. The arrow and bracket represent transcribed full-length RNAs and arrested-form RNAs, respectively. Graph on the right shows quantification of the arrested RNAs. **P < 0.01, by 2-way ANOVA with Bonferroni’s multiple-comparison test. n = 3 each. L, ladder; nt, nucleotide. Data represent the mean ± SEM. Statistical data are provided in Supplemental Data File 6.
Figure 2
Figure 2. Attenuation of pathogenic CUG RNA foci and polyQ aggregates in DM1 and HD cell models by CWG-cPIP treatment.
(A) Cell viability assay in Neuro-2a cells treated with CWG-cPIP at concentrations of 0.1, 0.3, 1, 3, 10, and 30 μM. Statistics were performed by 1-way ANOVA with Bonferroni’s multiple-comparison test. n = 6 each. (B) Chemical structure of FITC-labeled CWG-cPIP and representative confocal images of FITC-labeled CWG-cPIP. Nuclei were counterstained with DAPI (blue). Scale bar: 20 μm. (C) Schematic representation of constructs used for RT-qPCR in cellulo and quantification of HaloTag mRNA levels. **P < 0.01, by 1-way ANOVA with Bonferroni’s multiple-comparison test. n = 8 each. #Rep., CUG repeat lengths. (D) Representative confocal images of CUG-RNA foci (white) in mouse primary neurons (scale bars: 5 μm) and quantification of CUG-RNA foci (right). **P < 0.01, by 2-sided, unpaired Student’s t test. CUG700 plus vehicle: n = 49 cells; CUG700 plus CWG-cPIP: n = 36 cells. (E) Representative confocal images of CUG-RNA foci (white) in DM1 patient–derived iNeurons (scale bars: 5 μm) and quantification of CUG-RNA foci. **P < 0.01, by 2-sided, unpaired Student’s t test. Vehicle: n = 61 cells; CWG-cPIP: n = 49 cells. (F) Schematic representation of constructs containing Egfp tagged with CAG repeat sequences in a coding region and representative confocal images of GFP-positive aggregates in Neuro-2a cells. Scale bars: 10 μm. Graph shows quantification of GFP-positive aggregates. **P < 0.01, by 1-way ANOVA with Bonferroni’s multiple-comparison test. n = 6 wells each. (G) Representative blots of lysates from HD patient–derived fibroblasts probed with 1C2 and HTT antibodies. Arrow indicates HTT products corresponding to the normal allele. Graphs show quantification of 1C2 and HTT. *P < 0.05 and **P < 0.01, by 1-way ANOVA with Bonferroni’s multiple-comparison test. n = 5 experiments each. Data represent the mean ± SEM. Statistical data are provided in Supplemental Data File 6. Veh., vehicle treatment.
Figure 3
Figure 3. Amelioration of cognitive deficits observed in AAV-mediated CWG repeat–expressing mice by CWG-cPIP treatment.
(A) Schematic representation of viral constructs used in in vivo experiments and experimental schedules and representative confocal image of GFP expression in the hippocampus of CUG10 mice. Scale bar: 200 μm. (B and E) Spontaneous alternation behaviors and locomotor activities in the Y-maze test. *P < 0.05 and **P < 0.01, by 1-way ANOVA with Bonferroni’s multiple-comparison test. CUG10 plus vehicle and CUG300 plus vehicle: n = 11 mice; CUG300 plus CWG-cPIP: n = 9 mice each (B); n = 10 mice each (E). (C and F) Discrimination indices for the NOR test sessions. *P < 0.05 and **P < 0.01, by 1-way ANOVA with Bonferroni’s multiple-comparison test. CUG10 plus vehicle and CUG300 plus vehicle: n = 11 mice; CUG300 plus CWG-cPIP: n = 9 mice each (C); n = 10 mice each (F). (D and G) Latency to enter the dark compartment in the PA test sessions. *P < 0.05 and **P < 0.01, by 1-way ANOVA with Bonferroni’s multiple-comparison test. CUG10 plus vehicle and CUG300 plus vehicle: n = 11 mice; CUG300 plus CWG-cPIP: n = 9 mice each (D); n = 10 mice each (G). Data represent the mean ± SEM. Statistical data are provided in Supplemental Data File 6.
Figure 4
Figure 4. Mitigation of neuronal dysfunction observed in AAV-mediated CWG repeat–expressing mice following CWG-cPIP treatment.
(A and D) Input-output curves generated from the field excitatory postsynaptic potential (fEPSP) slope in the hippocampal CA1 versus amplitude measured at increasing stimulus intensities. *P < 0.05 and **P < 0.01, by 2-way ANOVA with Bonferroni’s multiple-comparison test. CUG10 plus vehicle and CUG300 plus CWG-cPIP: n = 6 mice; CUG300 plus vehicle: n = 5 mice each (A); n = 5 mice each (D). (B, C, E, and F) Representative fEPSPs were recorded from the hippocampal CA1 region of mice (B, left; E, left). Representative fEPSP traces following HFS (B, right; E, right). (C and F) fEPSP slope changes following HFS at 1 or 60 minutes. **P < 0.01, by 2-way ANOVA with Bonferroni’s multiple-comparison test. CUG10 plus vehicle and CUG300 plus CWG-cPIP: n = 6 mice; CUG300 plus vehicle: n = 5 mice (B and C). *P < 0.05 and **P < 0.01, by 2-way ANOVA with Bonferroni’s multiple-comparison test. n = 5 mice each (E and F). Data represent the mean ± SEM. Statistical data are provided in Supplemental Data File 6.
Figure 5
Figure 5. Inhibition of nuclear CUG RNA foci seen in CUG300 mice by CWG-cPIP treatment.
(A) Representative confocal images of Nissl-stained sections. Scale bars: 1 mm (left) and 500 μm (right). (B) Representative confocal images of CUG-RNA (magenta), GFP (green), and NeuN (red) in the hippocampus and quantification of NeuN-positive cells in CA1 and DG regions. *P < 0.05 and **P < 0.01, by 1-way ANOVA with Bonferroni’s multiple-comparison test. n = 4 mice each, averaged from 3 independent replicates (n = 3 slices) per mouse. Scale bars: 200 μm. (C) Representative confocal images of CUG-RNA foci in the hippocampal CA1 and DG regions and their quantification. *P < 0.05 and **P < 0.01, by 2-sided, unpaired Student’s t test. n = 4 mice each, averaged from 3 independent replicates (n = 3 slices) per mouse. Scale bars: 5 μm. Data represent the mean ± SEM. Statistical data are provided in Supplemental Data File 6.
Figure 6
Figure 6. Restoration of splicing defects and gene expression changes seen in CUG300 mice following CWG-cPIP treatment.
(A) Representative confocal images of CUG-RNA foci (magenta), MBNL1 (white), and GFP (green) in the hippocampus. Scale bars: 5 μm. (B) Heatmap of the top 300 (sorted by PSI of CUG10 mice) differential alternative splicing events and stacked bar chart showing the percentage of improvement over the total and each splicing mode in CUG300 mice after treatment with CWG-cPIP. n = 1 mouse each. Source data are provided in Supplemental Data File 3. (C and D) Z score–converted |expression levels of genes downregulated (C) and upregulated (D) in CUG300 mice and restored by CWG-cPIP treatment. Lines in the middle of the boxes indicate the median, and the top and bottom of the whiskers indicate the maximum and minimum values, respectively. Graphs on the right show the top 5 enriched gene ontology biological processes. n = 3 mice each. Source data are provided in Supplemental Data File 4. Padj, adjusted P value.
Figure 7
Figure 7. Improvement of neurological symptoms and pathology seen in R6/2 mice following CWG-cPIP treatment.
(A) Experimental diagram of i.c.v. injection of CWG-cPIP into R6/2 mice and the corresponding schedule. (B) Latency to fall for each trial in the rotarod test. *P < 0.05 and **P < 0.01, by 2-sided, paired Student’s t test. n = 10 mice each. (C) Representative images of hind limb clasping and quantification of the clasping score in the hind limb clasping test. **P < 0.01, by 1-way ANOVA with Bonferroni’s multiple-comparison test. n = 10 mice each. (D) Quantification of endogenous mouse Htt and human HTT transgene mRNA levels in the striatum. **P < 0.01, by 2-sided, unpaired Student’s t test (left); multiple comparisons were performed by 1-way ANOVA with Bonferroni’s multiple-comparison test (right). n = 5 mice each. (E) Representative confocal images of MW8 and K63-ubiquitin in the striatum and quantification. Scale bars: 5 μm. **P < 0.01, by 2-sided, paired Student’s t test. n = 5 mice each, averaged from 12 replicates per 100 μm2 area each in 3 slices per mouse. Data represent the mean ± SEM. Statistical data are provided in Supplemental Data File 6.

Comment in

Similar articles

Cited by

References

    1. Lander ES, et al. Initial sequencing and analysis of the human genome. Nature. 2001;409(6822):860–921. doi: 10.1038/35057062. - DOI - PubMed
    1. Paulson H. Repeat expansion diseases. In: Geschwind DH,et al., eds. Handbook of Clinical Neurology. Academic Press; 2018:105–123. - PMC - PubMed
    1. Depienne C, Mandel JL. 30 years of repeat expansion disorders: what have we learned and what are the remaining challenges? Am J Hum Genet. 2021;108(5):764–785. doi: 10.1016/j.ajhg.2021.03.011. - DOI - PMC - PubMed
    1. Orr HT, Zoghbi HY. Trinucleotide repeat disorders. Annu Rev Neurosci. 2007;30:575–621. doi: 10.1146/annurev.neuro.29.051605.113042. - DOI - PubMed
    1. Swinnen B, et al. RNA toxicity in non-coding repeat expansion disorders. EMBO J. 2020;39(1):e101112. doi: 10.15252/embj.2018101112. - DOI - PMC - PubMed

Publication types