. 2023 Nov 22;8(22):e165172.
doi: 10.1172/jci.insight.165172.

Circulating extracellular vesicles in human cardiorenal syndrome promote renal injury in a kidney-on-chip system

Affiliations

Circulating extracellular vesicles in human cardiorenal syndrome promote renal injury in a kidney-on-chip system

Emeli Chatterjee et al. JCI Insight. .

Abstract

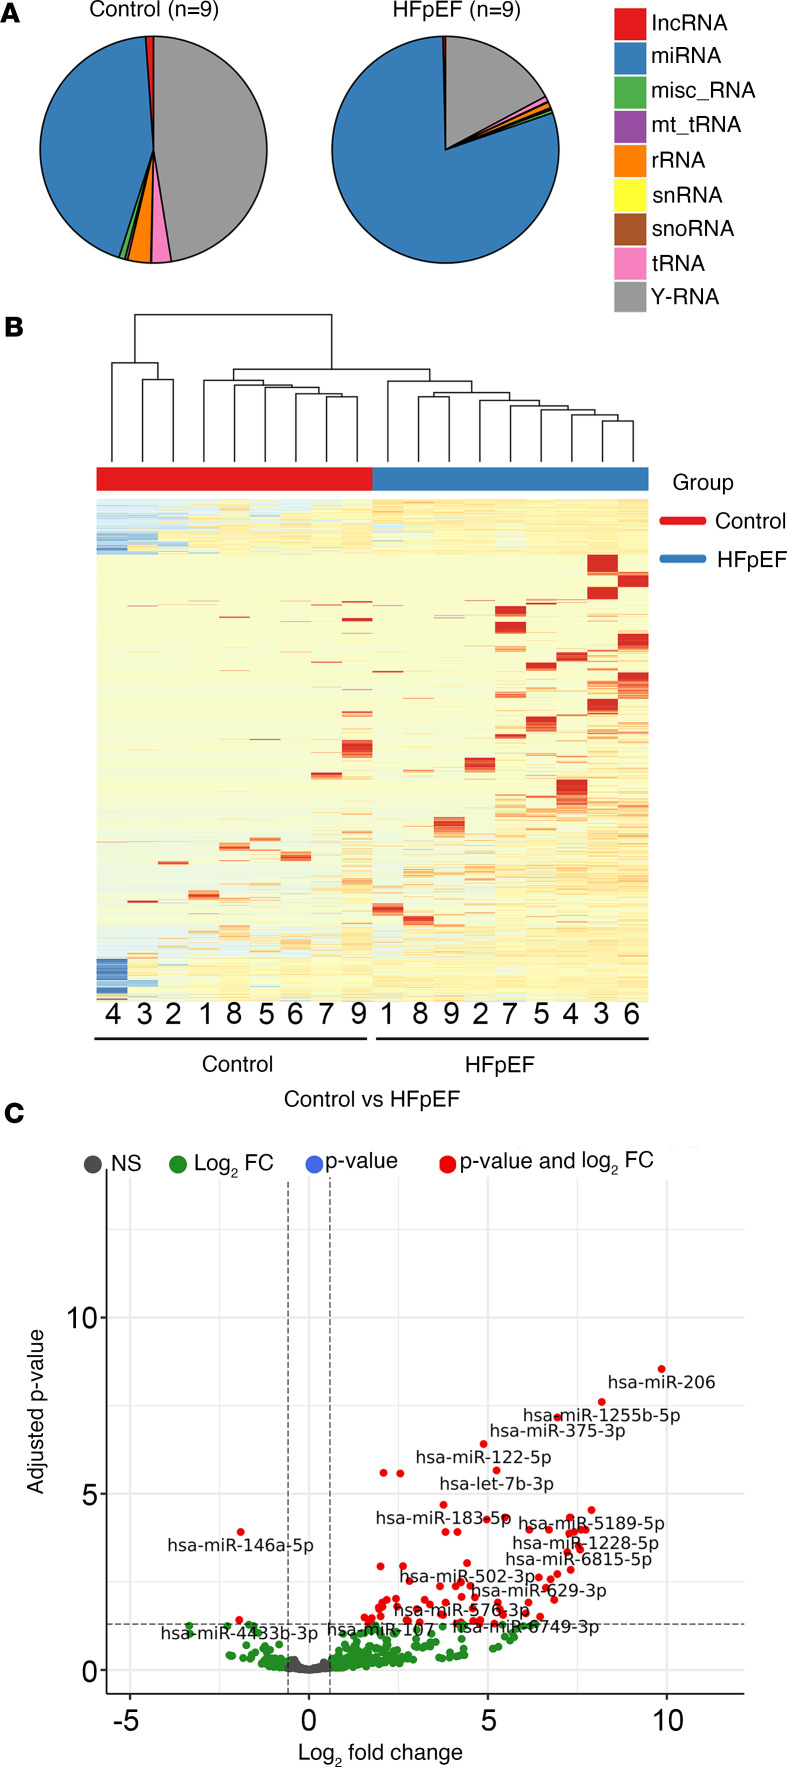
BACKGROUNDCardiorenal syndrome (CRS) - renal injury during heart failure (HF) - is linked to high morbidity. Whether circulating extracellular vesicles (EVs) and their RNA cargo directly impact its pathogenesis remains unclear.METHODSWe investigated the role of circulating EVs from patients with CRS on renal epithelial/endothelial cells using a microfluidic kidney-on-chip (KOC) model. The small RNA cargo of circulating EVs was regressed against serum creatinine to prioritize subsets of functionally relevant EV-miRNAs and their mRNA targets investigated using in silico pathway analysis, human genetics, and interrogation of expression in the KOC model and in renal tissue. The functional effects of EV-RNAs on kidney epithelial cells were experimentally validated.RESULTSRenal epithelial and endothelial cells in the KOC model exhibited uptake of EVs from patients with HF. HF-CRS EVs led to higher expression of renal injury markers (IL18, LCN2, HAVCR1) relative to non-CRS EVs. A total of 15 EV-miRNAs were associated with creatinine, targeting 1,143 gene targets specifying pathways relevant to renal injury, including TGF-β and AMPK signaling. We observed directionally consistent changes in the expression of TGF-β pathway members (BMP6, FST, TIMP3) in the KOC model exposed to CRS EVs, which were validated in epithelial cells treated with corresponding inhibitors and mimics of miRNAs. A similar trend was observed in renal tissue with kidney injury. Mendelian randomization suggested a role for FST in renal function.CONCLUSIONPlasma EVs in patients with CRS elicit adverse transcriptional and phenotypic responses in a KOC model by regulating biologically relevant pathways, suggesting a role for EVs in CRS.TRIAL REGISTRATIONClinicalTrials.gov NCT03345446.FUNDINGAmerican Heart Association (AHA) (SFRN16SFRN31280008); National Heart, Lung, and Blood Institute (1R35HL150807-01); National Center for Advancing Translational Sciences (UH3 TR002878); and AHA (23CDA1045944).

Keywords: Cardiology; Fibrosis; Heart failure; Nephrology; Noncoding RNAs.


Figures

Figure 1
Figure 1. Study schema.
c-DGUC, cushion gradient differential ultracentrifugation; SEC, size-exclusion chromatography.
Figure 2
Figure 2. Characterization of EVs from human plasma.
(A) Representative microfluidic resistive pulse sensing showing concentration and size distribution profiles of the EV population isolated by c-DGUC and SEC. (B) Representative Western blot of the expression of CD63, CD81, Alix, Syntenin, and 58K Golgi protein, as determined in the pooled EV samples isolated by both c-DGUC and SEC. (C) EVs isolated by both c-DGUC and SEC were visualized using TEM (scale bar used = 200 nm). Full-length, uncut gels are published in the online supplemental material.
Figure 3
Figure 3. Successful dosing of EVs on KOC.
Dil-stained EVs from a healthy control were visualized after 3-day perfusion period using fluorescence microscopy. (A) Representative images of the fluorescently labeled EVs (red), overlaid with a phase contrast image of the chip, mainly seen in the vascular endothelial (bottom) channel (scale bar = 100 μm). (B) Representative fluorescent confocal images of the EVs, cells in the vascular endothelial channel (bottom) and cells in the epithelial (top) channel (scale bar = 100 μm).
Figure 4
Figure 4. Differential expression of kidney injury marker genes and proteins in KOC model following 72 hours of incubation with EVs.
(A and B) Increased mRNA expression of IL18 (A) or LCN2 (B) in the KOC cells treated with EVs from HFpEFCRS compared with groups treated with EVs from HFpEFNO CRS or Healthy Controls. “No EVs Control” KOC was exposed to PBS alone. EVs used for the treatment were isolated by c-DGUC. Three technical replicate chips were prepared for each biological replicate (n = 6) of each experimental group. (C and D) mRNA expression of IL18 and LCN2 were significantly increased in renal epithelial and endothelial cells of the KOC treated with HFpEFCRS EVs compared with KOCs treated with EVs from HFpEFNO CRS or Healthy Controls. (E) Increased mRNA expression of HAVCR1 in the kidney cells treated with EVs from HFpEFCRS compared with groups treated with EVs from HFpEFNO CRS or Healthy Control. (F) Cystatin C ELISA showing higher expression in the group treated with EVs from HFpEFCRS compared with groups treated with EVs from HFpEFNO CRS or Healthy Control. EVs used for treatment (CF) were isolated by SEC method. GAPDH was used as internal loading control for all quantitative RT-PCR experiments. Each biological replicate (n = 3 for Healthy Control and HFpEFNO CRS; n = 4 for HFpEFCRS) of each experimental group had 3 technical replicates (averaged for each data point). Results were analyzed by 1-way ANOVA with Tukey’s post hoc test and expressed as ±SEM of 3 independent experiments. *, P < 0.05; ***, P < 0.001.
Figure 5
Figure 5. Summary of small RNA-Seq results.
(A) Pie charts showing the differential distribution of noncoding RNAs according to RNA-Seq in 9 pairs of Healthy Control and HFpEF groups. lncRNA, long noncoding RNA; misc_RNA, miscellaneous RNA, mt_tRNA, mitochondrial tRNA; snRNA, small nuclear RNA; snoRNA, small nucleolar RNA. (B) Hierarchical clustering was performed for Healthy Control and HFpEF comparison (n = 9 for each group) based on the differentially expressed genes. The horizontal axis is composed of all the samples analyzed in the study, and vertical axis includes all differentially expressed genes. Top, control samples are denoted in red squares and HFpEF samples in blue squares. Dark blue to dark red color gradient illustrates lower to higher expression. (C) Volcano plot was created by all differentially expressed miRNAs. The y axis shows the adjusted P value, and the x axis displays the log2 fold-change value. The red dots represent the differentially expressed miRNAs with FDR-adjusted P ≤ 0.05 and absolute fold-change ≥ 1.5, while green dots represent nonsignificantly modulated miRNAs.
Figure 6
Figure 6. Tissue enrichment analysis using long RNA EV transcriptome.
(A) Violin plot showing the tissue enrichment of the topmost upregulated transcripts in creatinine-high (red) and creatinine-low (blue) plasma EVs. (B) Dot plot expression of the top 6 enriched tissues with their respective tissue-specific transcripts in creatinine-high (red) and creatinine-low (blue) plasma EVs. TPM, transcripts per million.
Figure 7
Figure 7. Comparative pathway analysis.
Bar chart representing 9 most prominent pathways enriched in quantiles with differential EV-miRNA patterns in HF compared with Healthy Controls, as revealed by KEGG biological processes.
Figure 8
Figure 8. Concordant expression of the targets of hsa-miR-192-5p and miR-146a-5p in KOC.
(A) Box-and-whisker plot showing significantly higher expression (reads per million) of hsa-miR-192-5p in HFpEFCRS group compared with the HFpEFNO CRS. (BD) The mRNA expression of putative miR-192-5p targets BMP6, FST, and TIMP3 were significantly downregulated in group HFpEFCRS compared with HFpEFNO CRS group when analyzed by qRT-PCR. (E) Box-and-whisker plot showing significantly lower expression (reads per million) of hsa-miR-146a-5p in HFpEFCRS group compared with the HFpEFNO CRS group. (F and G) EGFR and SMAD4 were significantly upregulated in the KOCs treated by EVs from HFpEFCRS compared with HFpEFNO CRS group in epithelial cells. GAPDH was used as internal loading control for all experiments. Three independent chips (technical replicates) were prepared for each biological replicate (n = 3 for Healthy Control and HFpEFNO CRS; n = 4 for HFpEFCRS) of each experimental group (averaged for each data point). Box plots represent the first quartile, median, and third quartile, with whiskers indicating minimum and maximum values. Results were analyzed by unpaired t test for A and E or 1-way ANOVA with Tukey’s post hoc test for BD, F, and G and expressed as ±SEM of 3 independent experiments. *, P < 0.05; **, P < 0.01; ***, P < 0.001.
Figure 9
Figure 9. Concordant expression of the target of hsa-miR-21-5p in KOC.
(A) Box-and-whisker plot showing significantly higher expression (reads per million) of hsa-miR-21-5p in EVs from HFpEFCRS group compared with the HFpEFNO CRS group. (B) SMAD7 mRNA was significantly downregulated in the KOC cells treated by EVs from HFpEFCRS group compared with Healthy Control group. GAPDH was used as internal loading control. Three independent chips (technical replicates) were prepared for each biological replicate (n = 3 for Healthy Control and HFpEFNO CRS; n = 4 for HFpEFCRS) of each experimental group (averaged for each data point). Box plots represent the first quartile, median, and third quartile, with whiskers indicating minimum and maximum values. Results were analyzed by unpaired t test for A and 1-way ANOVA with Tukey’s post hoc test for B and expressed as ±SEM of 3 independent experiments. *, P < 0.05 **, P < 0.01; ***, P < 0.001.
Figure 10
Figure 10. Antagonizing HFpEFCRS EV–mediated miRNA effects attenuates kidney injury.
(A) Experimental schema of miRNA cocktail 1 (comprising miRNA inhibitors of miR-192-5p and 21-5p and mimic of miR146a-5p) designed to antagonize the effects of key CRS cargo miRNAs on recipient cells (created with BioRender.com). (BD) Amelioration of all 3 kidney injury markers (IL18, LCN2, HAVCR1) in the “HFpEFCRS+MiRNAs cocktail 1 treated group” compared with “HFpEFCRS+Control cocktail 1 treated group.” (EJ) QRT-PCR analyses showed marked upregulation of BMP6, FST, TIMP3, and SMAD7 and significant downregulation of EGFR and SMAD4 in the “HFpEFCRS+MiRNAs cocktail 1 treated group” compared with “HFpEFCRS+Control cocktail 1 treated group.” GAPDH was used as internal loading control. n = 3 for Healthy Control+Control cocktail 1 treated group; n = 4 for HFpEFCRS+Control cocktail 1 treated group; n = 3 for HFpEFCRS+miRNAs cocktail 1 treated group. Results were analyzed by unpaired t test and expressed as ±SEM of 3 independent experiments. **, P < 0.01; ***, P < 0.001.
Figure 11
Figure 11. MiRNA cocktail 2 mimics the effects the HFpEFCRS on renal epithelial cells.
(A) Experimental schema of miRNA cocktail 2 comprising mimics of miR-192-5p and miR-21-5p and miRNA inhibitor of 146a-5p designed to mimic the effects of CRS EVs on recipient renal epithelial cells (created with BioRender.com). (BD) mRNA expression of kidney injury markers (IL18, LCN2, HAVCR1) markedly upregulated in the “Healthy Control EVs+MiRNAs cocktail 2 treated group” compared with “Healthy Controls+Control cocktail 2 treated group.” (EJ) QRT-PCR analyses showed marked downregulation of BMP6, FST, TIMP3, and SMAD7 and marked upregulation of EGFR and SMAD4 in the “Healthy Control+miRNAs cocktail 2 treated group” compared with “Healthy Control+Control cocktail 2 treated group.” GAPDH was used as internal loading control. n = 3 replicates for each group. Results were analyzed by unpaired t test and expressed as ±SEM of 3 independent experiments. *, P < 0.05; **, P < 0.01.
Figure 12
Figure 12. Graphical representation of deleterious effects of plasma EVs promoting kidney injury in human CRS via targeting TGF-β signaling pathways (created with BioRender.com).

Similar articles

Cited by

References

    1. McKie PM, et al. Impaired natriuretic and renal endocrine response to acute volume expansion in pre-clinical systolic and diastolic dysfunction. J Am Coll Cardiol. 2011;58(20):2095–2103. doi: 10.1016/j.jacc.2011.07.042. - DOI - PMC - PubMed
    1. Rangaswami J, et al. Cardiorenal syndrome: classification, pathophysiology, diagnosis, and treatment strategies: a scientific statement from the American Heart Association. Circulation. 2019;139(16):e840–e878. doi: 10.1161/CIR.0000000000000664. - DOI - PubMed
    1. Yogasundaram H, et al. Cardiorenal syndrome and heart failure-challenges and opportunities. Can J Cardiol. 2019;35(9):1208–1219. doi: 10.1016/j.cjca.2019.04.002. - DOI - PMC - PubMed
    1. Di Lullo L, et al. Cardiorenal syndrome in acute kidney injury. Semin Nephrol. 2019;39(1):31–40. doi: 10.1016/j.semnephrol.2018.10.003. - DOI - PubMed
    1. Mentz RJ, et al. Decongestion strategies and renin-angiotensin-aldosterone system activation in acute heart failure. JACC Heart Fail. 2015;3(2):97–107. doi: 10.1016/j.jchf.2014.09.003. - DOI - PMC - PubMed

Publication types

MeSH terms

Associated data