. 2023 Sep 14;18(9):e0291547.
doi: 10.1371/journal.pone.0291547. eCollection 2023.

South Asian maternal and paternal lineages in southern Thailand and the role of sex-biased admixture

Affiliations

South Asian maternal and paternal lineages in southern Thailand and the role of sex-biased admixture

Wipada Woravatin et al. PLoS One. .

Abstract

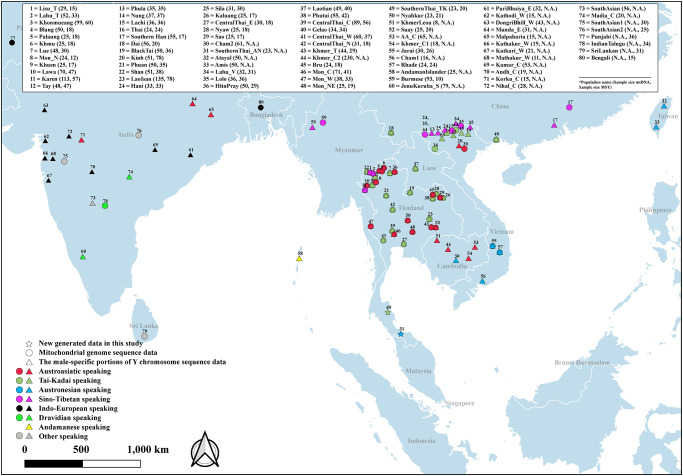
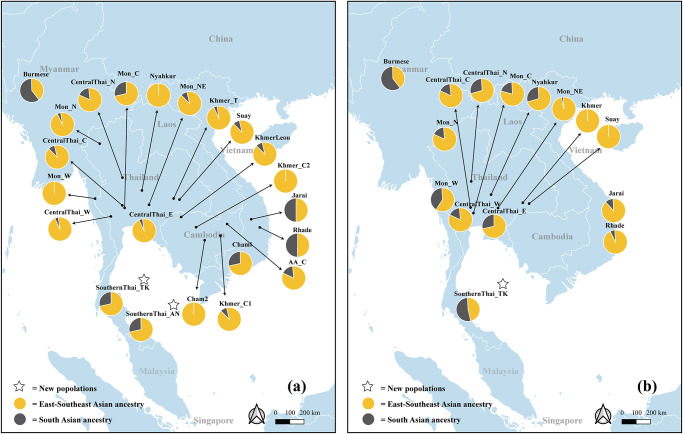
Previous genome-wide studies have reported South Asian (SA) ancestry in several Mainland Southeast Asian (MSEA) populations; however, additional details concerning population history, in particular the role of sex-specific aspects of the SA admixture in MSEA populations can be addressed with uniparental markers. Here, we generated ∼2.3 mB sequences of the male-specific portions of the Y chromosome (MSY) of a Tai-Kadai (TK)-speaking Southern Thai group (SouthernThai_TK), and complete mitochondrial (mtDNA) genomes of the SouthernThai_TK and an Austronesian (AN)-speaking Southern Thai (SouthernThai_AN) group. We identified new mtDNA haplogroups, e.g. Q3, E1a1a1, B4a1a and M7c1c3 that have not previously reported in Thai populations, but are frequent in Island Southeast Asia and Oceania, suggesting interactions between MSEA and these regions. SA prevalent mtDNA haplogroups were observed at frequencies of ~35-45% in the Southern Thai groups; both of them showed more genetic relatedness to Austroasiatic (AA) speaking Mon than to any other group. For MSY, SouthernThai_TK had ~35% SA prevalent haplogroups and exhibited closer genetic affinity to Central Thais. We also analyzed published data from other MSEA populations and observed SA ancestry in some additional MSEA populations that also reflects sex-biased admixture; in general, most AA- and AN-speaking groups in MSEA were closer to SA than to TK groups based on mtDNA, but the opposite pattern was observed for the MSY. Overall, our results of new genetic lineages and sex-biased admixture from SA to MSEA groups attest to the additional value that uniparental markers can add to studies of genome-wide variation.


Conflict of interest statement

NO authors have competing interests.

Figures

Fig 1
Fig 1. Map showing the locations of 88 populations from Southeast and South Asia that were analyzed for mtDNA (74 populations) and MSY (55 populations) variation.
The map was generated using the Quantum GIS, QGIS Development Team (2023), QGIS Geographic Information System. Open Source Geospatial Foundation (https://www.qgis.org) and boundaries were adapted and modified from https://public.opendatasoft.com/explore/dataset/worldadministrative-boundaries/export/.
Fig 2
Fig 2. Frequency of shared mtDNA (a) and MSY (b) haplotypes within and between populations.
The font color of the population name indicates language family and the colored bar at the top indicates geographic region; the heat plot shows the frequency of shared types according to the key on the right. The new populations analyzed in this study are indicated by stars.
Fig 3
Fig 3. Heat plot of Φst values based on mtDNA (a) and MSY (b) haplotypes.
The “*”symbol indicates Φst values that are not significantly different from zero (P > 0.05). See legend of Fig 2 for other details.
Fig 4
Fig 4. The three-dimensional MDS plot based on the Φst distance matrix of 74 populations for mtDNA.
The stress value is 0.1196.
Fig 5
Fig 5. The three-dimensional MDS plot based on the Φst distance matrix of 55 populations for MSY sequences.
The stress value is 0.1095.
Fig 6
Fig 6. Pie charts of South Asian ancestry in Southeast Asian populations.
(a) mtDNA, 22 populations; (b) MSY, 15 populations. The map was generated using the Quantum GIS, QGIS Development Team (2023), QGIS Geographic Information System. Open Source Geospatial Foundation (https://www.qgis.org) and was not taken from another source. and boundaries were adapted and modified from https://public.opendatasoft.com/explore/dataset/worldadministrative-boundaries/export/.
Fig 7
Fig 7. The BSPs based on mtDNA for the SouthernThai_TK (a) and SouthernThai_AN (b), and based on MSY for the SouthernThai_TK (c).
Blue lines are the median estimated effective population size (y axis) through time from the present in years (x axis). The 95% highest posterior density limits are indicated by light grey shading.

References

    1. Aghakhanian F, Yunus Y, Naidu R, et al.. Unravelling the genetic history of Negritos and indigenous populations of Southeast Asia. Genome Biol Evol. 2015;7:1206–1215. doi: 10.1093/gbe/evv065 - DOI - PMC - PubMed
    1. McColl H, Racimo F, Vinner L, et al.. The prehistoric peopling of Southeast Asia. Science. 2018;361:88–92. doi: 10.1126/science.aat3628 - DOI - PubMed
    1. Göllner T, Larena M, Kutanan W, et al.. Unveiling the Genetic History of the Maniq, a Primary Hunter-Gatherer Society. Genome Biology and Evolution. 2022;14:evac021. doi: 10.1093/gbe/evac021 - DOI - PMC - PubMed
    1. Jinam TA, Hong L-C, Phipps ME, et al.. Evolutionary history of continental southeast Asians: “early train” hypothesis based on genetic analysis of mitochondrial and autosomal DNA data. Mol Biol Evol. 2012;29:3513–3527. doi: 10.1093/molbev/mss169 - DOI - PubMed
    1. Kutanan W, Kampuansai J, Changmai P, et al.. Contrasting maternal and paternal genetic variation of hunter-gatherer groups in Thailand. Sci Rep. 2018;8:1536. doi: 10.1038/s41598-018-20020-0 - DOI - PMC - PubMed

Publication types

Substances

LinkOut - more resources