. 2023 Sep 14;18(9):e0290652.
doi: 10.1371/journal.pone.0290652. eCollection 2023.

Measuring the efficacy of a vaccine during an epidemic

Affiliations

Measuring the efficacy of a vaccine during an epidemic

Antonio Scala et al. PLoS One. .

Abstract

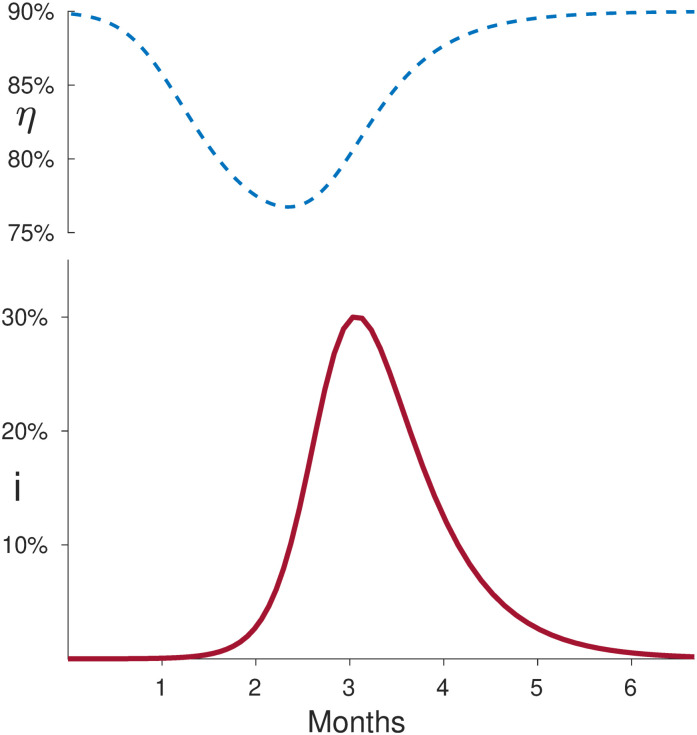
The urgency to develop vaccines during the COVID-19 pandemic has resulted in the acceleration of clinical trials. Specifically, a broad spectrum of efficacy levels has been reported for various vaccines based on phase III cohort studies. Our study demonstrates that conducting large cohort phase III clinical trials during the peak of an epidemic leads to a significant underestimation of vaccine efficacy, even in the absence of confounding factors. Furthermore, we find that this underestimation increases with the proportion of infectious individuals in the population during the experiment and the severity of the epidemic, as measured by its basic reproduction number.


Conflict of interest statement

The authors have declared that no competing interests exist.

Figures

Fig 1
Fig 1. Measured effectiveness η (Eq 9) versus the attack rate c.
The epidemic is modelled with a SIR model with basic reproduction number R0=3 and mean infectious period τ = 15 days corresponding to a transmission rate β = 0.2 days−1. The continuous black line corresponds to the expected values of η (Eq 3) for trials of a duration T = 2 months and real efficacy ϵ = 0.90. Curves are obtained by varying the initial time t of the trial; thus, each c corresponds to a period [t, t + T]. Lower values of c correspond to the initial and final phases of the epidemics where the fraction of infectious individuals is low, while high values of c correspond to experiments performed near the peak of the epidemic. We observe that η is affected by a systematic error (i.e. η < ϵ) that makes it underestimate the real efficacy ϵ; when the fraction of infectious individuals is high, the error is larger, while when it is low, ηϵ and the error is proportional to βc (see Eq 4). To evaluate the statistical errors, we model the process of getting infected by a stochastic process (Eq 8) and simulate possible values of η for cohorts of n = 4 × 10⁴ individuals, i.e. of a size of the same order of the Pfizer trial [16]). As expected, the results of the stochastic simulations (red dots in the figure) fall in a region with a distance of order 10−2 around the theoretical curve of Eq 3, i.e. a region of order ×1/n as expected for a trial with cohorts of independent, non-interacting individuals.
Fig 2
Fig 2. Minimum efficacy vs basic reproduction number.
According to Eq 3, the measured effectiveness η (Eq 9) reaches a minimum ηmin for clinical trials near the epidemic peak. The figure reports the theoretical values of the worst effectiveness’ estimate ηmin versus the basic reproduction number R0 when modelling the epidemic with a SIR of mean infectious period τ = 15 days and considering clinical trials of length T = 2 months. The three curves correspond to a true efficacy of ϵ = 0.90 (continuous line), ϵ = 0.93 (dashed line) and ϵ = 0.96 (dotted line). The curves show that the lower a vaccine’s efficacy ϵ, the worse it is underestimated by the effectiveness η (Eq 9).
Fig 3
Fig 3. Measured effectiveness and fraction of infected individuals versus time.
We consider an SIR model with R0=3 and τ = 15 days. Upper panel: the effectiveness η(t) measured as Eq 9 on a series of T = 2 months trials starting at different times t for a vaccine with true efficacy ϵ = 90%. As expected, η(t)∼ϵ when the initial fraction i of infected is very low. η(t) decreases as i grows and reaches a minimum during the infection peak. In fact, for the same number of infected at the beginning of a trial, the measured effectiveness will be lower if the epidemic is growing since the attack rate in Eq 9 will be higher.

References

    1. Shah A, Marks PW, Hahn SM. Unwavering Regulatory Safeguards for COVID-19 Vaccines. JAMA. 2020;324(10):931. doi: 10.1001/jama.2020.15725 - DOI - PubMed
    1. Collins FS, Stoffels P. Accelerating COVID-19 Therapeutic Interventions and Vaccines (ACTIV): An Unprecedented Partnership for Unprecedented Times. JAMA. 2020;323(24):2455. doi: 10.1001/jama.2020.8920 - DOI - PubMed
    1. WHO. Draft landscape and tracker of COVID-19 candidate vaccines; 2021. Available from: https://www.who.int/publications/m/item/draft-landscape-of-covid-19-cand....
    1. Halloran ME, Longini IM, Struchiner CJ. Design and analysis of vaccine studies. Statistics for biology and health. New York: Springer; 2010.
    1. Last JM, Association IE, editors. A dictionary of epidemiology. 4th ed. New York: Oxford University Press; 2001.