. 2023 Sep 14;18(9):e0289896.
doi: 10.1371/journal.pone.0289896. eCollection 2023.

Macular retinal circulation in healthy eyes examined by optical coherence tomography angiography extended interscan time analysis

Affiliations

Macular retinal circulation in healthy eyes examined by optical coherence tomography angiography extended interscan time analysis

Masaharu Ishikura et al. PLoS One. .

Abstract

Purpose: To examine whether extended interscan time (IST) on optical coherence tomography angiography (OCTA) can detect slow retinal blood flow, which is undetectable on default IST, in the healthy macula.

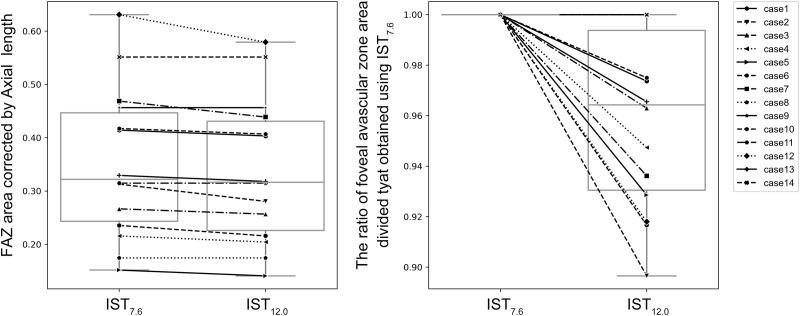
Methods: OCTA (OCT-A1, Canon Inc.) scanning of a macular area measuring 4 × 4 mm2 of 14 healthy eyes of 14 healthy volunteers with no history or evidence of systemic and macular diseases was performed. ISTs were set at 7.6 (IST7.6, default setting), 12.0 (IST12.0), and 20.6 msec (IST20.6). Ten OCTA images were acquired at each IST, and an averaged image was created. For each averaged OCTA image obtained at IST7.6, IST12.0, and IST20.6, we defined the area surrounded by the innermost capillary ring as the foveal avascular zone (FAZ). We qualitatively evaluated the delineation of the capillaries consisting of the FAZ and quantitatively measured the FAZ area at each IST.

Results: Extensions from IST7.6 to IST12.0 and IST20.6 could newly delineated retinal capillaries that were undetectable at the default IST; new capillaries were detected in 10 (71%) eyes at IST12.0 and 11 (78%) eyes at IST20.0. The FAZ areas were 0.334 ± 0.137 mm2, 0.320 ± 0.132 mm2, and 0.319 ± 0.129 mm2 for IST7.6, IST12.0, and IST20.0, respectively; the FAZ areas at IST12.0 and IST20.0 were significantly decreased compared with that at IST7.6 (p = 0.004 and 0.002, respectively).

Conclusion: In OCTA for healthy participants, extensions of the ISTs newly detected retinal capillaries with slow blood flow around FAZ. The FAZ shapes varied with different ISTs. Thus, the blood flow dynamics are not physiologically uniform around FAZ. Compared with conventional OCTA, this protocol enables a more detailed evaluation of retinal circulation and provides a better understanding of the physiological circulatory status of the healthy retina, and may enable the assessment of circulation in the very early stages in diseased eyes.


Conflict of interest statement

This work was supported in part by a grant-in-aid for scientific research (No. 20K09771) from the Japan Society for the Promotion of Science (Tokyo, Japan), Alcon Japan, Ltd. (Tokyo, Japan), and Canon Inc. (Tokyo, Japan). There are no patents, products in development or marketed products associated with this research to declare. This does not alter our adherence to PLOS ONE policies on sharing data and materials.

Figures

Fig 1
Fig 1. Capillaries are depicted more clearly with extension (IST7.6, IST12.0, and IST20) of the interscan time; OCTA images of the healthy macular area in the healthy eye.
A, The averaged OCTA image of a 4 × 4 mm2 macular area created by averaging ten OCTA images obtained at IST7.6. B, The averaged OCTA image of a 0.8 × 0.8 mm2 area around the FAZ magnified from image A. C, Binarized image of the capillaries from image B created using the software made by Canon Inc. D, The area of FAZ obtained from image C. E, The OCT B-scan image and decorrelation signal of B. No decorrelation signal is observed (white arrow). F, The averaged OCTA image of a 4 × 4 mm2 macular area created by averaging ten OCTA images obtained at IST12.0. G, The averaged OCTA image of a 0.8 × 0.8 mm2 area around the FAZ magnified from image E. H, Binarized image of the capillaries from image F created using the software made by Canon Inc. An additional capillary is depicted in image G, compared with the OCTA image obtained at IST7.6 (White arrow). I, The area of FAZ obtained from image G. J: The OCT B-scan image and decorrelation signal of G. A decorrelation signal not depicted in E is observed (white arrow). K The OCT B-scan image and G decorrelation signal: No decorrelation signal is confirmed (white arrow). The averaged OCTA image of a 4 × 4 mm2 macular area was created by averaging ten OCTA images obtained at IST20.6. M, The averaged OCTA image of a 0.8 × 0.8 mm2 area around FAZ magnified from image I. N, A binarized image of the capillaries from image J is created using software made by Canon Inc. An additional capillary is depicted in image G compared with the OCTA images obtained at IST7.6 and IST12.0 (White arrow). O, The area of FAZ obtained from image K. P, The OCT B-scan image and decorrelation signal of M. A decorrelation signal not depicted in E is observed (white arrow).
Fig 2
Fig 2. Capillaries become more intense with each extended interscan time (IST7.6, IST12.0, and IST20.6); OCTA images of the healthy macular area in the healthy eye.
A, The averaged OCTA image of a 4 × 4 mm2 macular area created by averaging ten OCTA images obtained at IST7.6. B, The averaged OCTA image of a 0.8 × 0.8 mm2 area around the FAZ magnified from image A. C, Binarized image of the capillaries from image B created using the software made by Canon Inc. D, The area of FAZ obtained from image C. E, The OCT B-scan image and decorrelation signal of B. No decorrelation signal is observed (white arrow). F, The averaged OCTA image of a 4 × 4 mm2 macular area created by averaging ten OCTA images obtained at IST12.0. G, The averaged OCTA image of a 0.8 × 0.8 mm2 area around the FAZ magnified from image E. The capillary is more intense at IST12.0 than that at IST7.6 (White arrow). H, Binarized image of the capillaries from image F created using the software made by Canon, Inc. I, The area of FAZ obtained from image G. J: The OCT B-scan image and decorrelation signal of G. A decorrelation signal not depicted in E is observed (white arrow). The averaged OCTA image of a 4 × 4 mm2 macular area is created by averaging ten OCTA images obtained at IST20.6. L, The averaged OCTA image of a 0.8 × 0.8 mm2 area around FAZ magnified from image I. The capillaries are more intense at IST20.6 than that at IST12.0 (White arrows). M, A binarized image of capillaries from image J is created using software made by Canon Inc. N, The area of FAZ obtained from image K. O The OCT B-scan image and L decorrelation signal The decorrelation signal increased compared to that in E and J (white arrow).
Fig 3
Fig 3. Comparison of the FAZ areas obtained at IST7.6 and IST12.0.
In the graph on the left, the vertical axis represents the FAZ area corrected by the axial length obtained at IST7.6 and IST12.0, whereas the horizontal axis represents IST. In the graph on the right, the vertical axis represents the area of FAZ obtained at IST7.6 and IST12.0 divided by the area of FAZ obtained at IST7.6; the horizontal axis represents IST. The FAZ areas decreased significantly at IST12.0 compared with that at IST7.6.
Fig 4
Fig 4. Comparison of FAZ areas obtained at IST7.6 and IST20.6.
In the graph on the left, the vertical axis represents the FAZ area corrected by the axial length obtained at IST7.6 and IST20.6, whereas the horizontal axis represents IST. In the graph on the right, the vertical axis represents the area of FAZ obtained at IST7.6 and IST20.6 divided by the area of FAZ obtained at IST7.6; the horizontal axis represents IST. The FAZ areas decreased significantly at IST20.6 compared with that at IST7.6.

References

    1. Flower RW, Hochheimer BF. A clinical technique and apparatus for simultaneous angiography of the separate retinal and choroidal circulations. Invest Ophthalmol Vis Sci. 1973;12: 248–261. - PubMed
    1. Novotny HR, Alvis DL. A method of photographing fluorescence in circulating blood in the human retina. Circulation. 1961;24: 82–86. doi: 10.1161/01.cir.24.1.82 - DOI - PubMed
    1. Kwiterovich KA, Maguire MG, Murphy RP, Schachat AP, Bressler NM, Bressler SB, et al.. Frequency of adverse systemic reactions after fluorescein angiography. Results of a prospective study. Ophthalmology. 1991;98: 1139–1142. doi: 10.1016/s0161-6420(91)32165-1 - DOI - PubMed
    1. Kwan AS, Barry C, McAllister IL, Constable I. Fluorescein angiography and adverse drug reactions revisited: the Lions Eye experience. Clin Exp Ophthalmol. 2006;34: 33–38. doi: 10.1111/j.1442-9071.2006.01136.x - DOI - PubMed
    1. Makita S, Hong Y, Yamanari M, Yatagai T, Yasuno Y. Optical coherence angiography. Opt Express. 2006;14: 7821–7840. doi: 10.1364/oe.14.007821 - DOI - PubMed

Publication types