. 2023 Sep 19;120(38):e2306551120.
doi: 10.1073/pnas.2306551120. Epub 2023 Sep 14.

Hierarchical bubble size distributions in coarsening wet liquid foams

Affiliations

Hierarchical bubble size distributions in coarsening wet liquid foams

Nicolò Galvani et al. Proc Natl Acad Sci U S A. .

Abstract

Coarsening of two-phase systems is crucial for the stability of dense particle packings such as alloys, foams, emulsions, or supersaturated solutions. Mean field theories predict an asymptotic scaling state with a broad particle size distribution. Aqueous foams are good model systems for investigations of coarsening-induced structures, because the continuous liquid as well as the dispersed gas phases are uniform and isotropic. We present coarsening experiments on wet foams, with liquid fractions up to their unjamming point and beyond, that are performed under microgravity to avoid gravitational drainage. As time elapses, a self-similar regime is reached where the normalized bubble size distribution is invariant. Unexpectedly, the distribution features an excess of small roaming bubbles, mobile within the network of jammed larger bubbles. These roaming bubbles are reminiscent of rattlers in granular materials (grains not subjected to contact forces). We identify a critical liquid fraction [Formula: see text], above which the bubble assembly unjams and the two bubble populations merge into a single narrow distribution of bubbly liquids. Unexpectedly, [Formula: see text] is larger than the random close packing fraction of the foam [Formula: see text]. This is because, between [Formula: see text] and [Formula: see text], the large bubbles remain connected due to a weak adhesion between bubbles. We present models that identify the physical mechanisms explaining our observations. We propose a new comprehensive view of the coarsening phenomenon in wet foams. Our results should be applicable to other phase-separating systems and they may also help to control the elaboration of solid foams with hierarchical structures.

Keywords: Ostwald ripening; coarsening; foams.


Conflict of interest statement

The authors declare no competing interest.

Figures

Fig. 1.
Fig. 1.
Excess of small bubbles. (A) Image of foam surface (ϕ=15%) in the Scaling State regime. Yellow stars have been superimposed on the image to highlight the small bubbles corresponding to the sharp peak in the distribution shown in (B). (B) Probability density function of normalized bubble radius ρ=R/R at different foam ages as indicated, for a foam with liquid fraction ϕ=15%. The curve corresponding to age > 2,000 s represents the Scaling State regime, for which the normalized distribution no longer evolves. Inset: evolution of the proportion of small bubbles as a function of time. The number fraction fsmall is obtained by dividing the number of bubbles with radius R<Rt by the total number of bubbles in the sample (see Section B for details). A change in Rt by ±5% induces a variation of fsmall smaller than the point size. (C) Probability density function of normalized bubble radius at different ages as indicated, for a sample with liquid fraction ϕ=8% studied on ground.
Fig. 2.
Fig. 2.
Roaming transition: (A) Evolution of the area of individual bubbles as a function of foam age measured as the time elapsed since the end of the foam sample production, for ϕ=15%. The area At=πRt2 denotes the bubble area at the wall when its shrinking abruptly slows down (Text). Each label corresponds to a different bubble. (B) The transition to the very small shrinking rate was observed to occur when the foam bubble has become so small that it fits inside the interstice between neighboring larger bubbles. The corresponding geometrical transition can therefore be described as follows: When its radius is larger than Rt, the small bubble is a foam bubble, in the fact that it shares thin liquid films with its neighbors. In contrast, as its radius reaches values smaller than Rt, the bubble loses its contacts with its neighbors: it becomes a roaming bubble and its shrinking rate is strongly decreased. (C) Coefficient xn=Rt/R32 as a function of ϕ. Filled orange disks: values deduced from the tracking of individual bubbles. Error bars show ±3SD, to highlight the observed variability. Black stars/drawings: calculation of xn from the size of a hard sphere (in red) that can be inserted into the interstice formed by three spheres at the wall, assuming either a compact bubble cage (Bottom) or slight loosening (Top) of the latter. The dotted line corresponds to Eq. 4 with ξ=2.2.
Fig. 3.
Fig. 3.
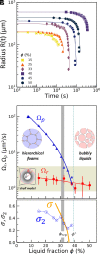
Roaming bubble dissolution: (A) Radius evolution of dissolving roaming bubbles where each curve represents a single bubble. The solid lines correspond to fits of Eq. 5. (B) Average shrinking rate of roaming bubbles Ωr as a function of liquid fraction compared to the growth rate of average bubble size in the foam Ωp (Eq. 1, data from ref. 34). The lines are guides to the eye. Ωr values fall within the range (highlighted in green) predicted by the shell model (SI Appendix, Eq. 1), schematically illustrated by the inside drawing. Error bars correspond to ±1SD. The growth rate Ωp is strongly dependent on the liquid fraction, at the difference of the dissolution rate Ωr. (C) Measured shape parameter σ2 of the jammed bubbles size distribution (SI Appendix, Eq. 6) as a function of liquid fraction (blue circles). The (orange) continuous line represents the maximum packing volume fraction predicted for a lognormal distribution of spheres with shape parameter σ (19, 47). The gray vertical area highlights the range where σ and σ2 coincide, from which we deduce ϕrcp 30 to 32%. This also corresponds to the range of liquid fractions where Ωr is comparable to Ωp in B.
Fig. 4.
Fig. 4.
Bubble size distributions of normalized radius ρ=R/R for each liquid fraction as labeled. The data are represented by black continuous lines. The green dashed lines represent the bilognormal PDFs (SI Appendix, Eq. 6) fitted to the data. The red (resp. blue) shaded area corresponds to the roaming bubble PDF wL(r;m1,σ1) (resp. to the foam bubble PDF (1w)L(ρ;m2,σ2)) with the parameters given in SI Appendix, Fig. S5. In the plots for ϕ up to 38%, the width of the roaming bubble distributions is characterized by ρt, defined in SI Appendix, Eq. 8. For ϕ=15%, the dotted line is the PDF predicted for wet foams by Markworth (50) based on Lemlich’s model (51) for that ϕ. As a comparison, for ϕ=50%, the dotted line is the LSW prediction (15) (ϕ=1).

References

    1. Wang K., Glicksman M., Phase coarsening in thin films. JOM 67, 1905–1912 (2015).
    1. Voorhees P. W., Ostwald ripening of two-phase mixtures. Annu. Rev. Mater. Sci. 22, 197–215 (1992).
    1. Nanev C. N., Recent experimental and theoretical studies on protein crystallization. Cryst. Res. Technol. 52, 1600210 (2017).
    1. Noorduin W. L., Vlieg E., Kellogg R. M., Kaptein B., From Ostwald ripening to single chirality. Angew. Chem. Int. Ed. 48, 9600–9606 (2009). - PubMed
    1. Asua J. M., Ostwald ripening of reactive costabilizers in miniemulsion polymerization. Euro. Polym. J. 106, 30–41 (2018).