Meta-Analysis
. 2023 Sep 14;20(9):e1004286.
doi: 10.1371/journal.pmed.1004286. eCollection 2023 Sep.

Estimating the proportion of clinically suspected cholera cases that are true Vibrio cholerae infections: A systematic review and meta-analysis

Affiliations
Meta-Analysis

Estimating the proportion of clinically suspected cholera cases that are true Vibrio cholerae infections: A systematic review and meta-analysis

Kirsten E Wiens et al. PLoS Med. .

Erratum in

Abstract

Background: Cholera surveillance relies on clinical diagnosis of acute watery diarrhea. Suspected cholera case definitions have high sensitivity but low specificity, challenging our ability to characterize cholera burden and epidemiology. Our objective was to estimate the proportion of clinically suspected cholera that are true Vibrio cholerae infections and identify factors that explain variation in positivity.

Methods and findings: We conducted a systematic review of studies that tested ≥10 suspected cholera cases for V. cholerae O1/O139 using culture, PCR, and/or a rapid diagnostic test. We searched PubMed, Embase, Scopus, and Google Scholar for studies that sampled at least one suspected case between January 1, 2000 and April 19, 2023, to reflect contemporary patterns in V. cholerae positivity. We estimated diagnostic test sensitivity and specificity using a latent class meta-analysis. We estimated V. cholerae positivity using a random-effects meta-analysis, adjusting for test performance. We included 119 studies from 30 countries. V. cholerae positivity was lower in studies with representative sampling and in studies that set minimum ages in suspected case definitions. After adjusting for test performance, on average, 52% (95% credible interval (CrI): 24%, 80%) of suspected cases represented true V. cholerae infections. After adjusting for test performance and study methodology, the odds of a suspected case having a true infection were 5.71 (odds ratio 95% CrI: 1.53, 15.43) times higher when surveillance was initiated in response to an outbreak than in non-outbreak settings. Variation across studies was high, and a limitation of our approach was that we were unable to explain all the heterogeneity with study-level attributes, including diagnostic test used, setting, and case definitions.

Conclusions: In this study, we found that burden estimates based on suspected cases alone may overestimate the incidence of medically attended cholera by 2-fold. However, accounting for cases missed by traditional clinical surveillance is key to unbiased cholera burden estimates. Given the substantial variability in positivity between settings, extrapolations from suspected to confirmed cases, which is necessary to estimate cholera incidence rates without exhaustive testing, should be based on local data.


Conflict of interest statement

JL is a paid statistical advisor for PLOS Medicine.

Figures

Fig 1
Fig 1. PRISMA flow diagram.
Diagram illustrating literature selection process, including databases searched, literature screened, and full texts reviewed for eligibility. Reasons for exclusion are indicated along with the number of studies that fell within each category. PCR, polymerase chain reaction; RDT, rapid diagnostic test.
Fig 2
Fig 2. V. cholerae positivity by study methodology and outbreak context.
Proportion of suspected cholera cases that were confirmed positive by (A) diagnostic test type, (B) quality of sampling methods, where “high” includes all suspected cases or a random or stratified sample and “low” includes convenience or unreported sampling methods, (C) age minimum in suspected case definition, where “0” indicates that no minimum age was set, and (D) whether surveillance was initiated in response to an outbreak or whether it was routine surveillance or non-outbreak. Each point is an observation included in the analysis dataset. There is more than one observation per study when the study reported data for more than one sampling method, surveillance type, and/or country. Boxes represent the median and IQR of positivity for each group. Lines extend from the top and bottom of box to the largest positivity value no further than 1.5 * IQR from the box. IQR, interquartile range; PCR, polymerase chain reaction; RDT, rapid diagnostic test.
Fig 3
Fig 3. Estimated underlying V. cholerae positivity.
(A) Posterior distributions of pooled percent sensitivity and specificity of culture (top), PCR (middle), and RDT (bottom) for detecting V. cholerae O1/O139 infections in suspected cholera cases. Dashed lines represent median values of each distribution. (B) The “Unadjusted” dot is mean V. cholerae positivity (lines represent 95% CrI) from random effects meta-analysis without adjustments for test performance. The “Adjusted for test performance” and “Stratum: …” dots are estimated mean V. cholerae positivity (lines represent 95% CrIs), adjusted for sensitivity/specificity of the tests. High-quality stratified estimates correspond to post-stratified estimates of V. cholerae positivity for studies that use high quality sampling methods and whether an age minimum was set in the suspected case definition, as well as whether surveillance was initiated in response to an outbreak. CrI, credible interval; PCR, polymerase chain reaction; RDT, rapid diagnostic test.
Fig 4
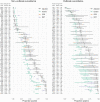
Fig 4. Forest plot of study estimates and underlying positivity.
Black points indicate mean study-level underlying positivity and 95% CrI. Teal, orange, and purple points indicate the proportion positive reported by study for culture, PCR, and RDT, respectively, and corresponding error bars indicate 95% CI for a binomial probability using the normal approximation [147]. Studies are labeled by country ISO3 code, quality of sampling methods, (high or low), and whether a minimum age was set in the suspected cholera case definition, (yes or no). Studies are split into outbreak and non-outbreak for ease of interpretation. CI, confidence interval; CrI, credible interval; PCR, polymerase chain reaction; RDT, rapid diagnostic test.

References

    1. Ali M, Nelson AR, Lopez AL, Sack DA. Updated global burden of cholera in endemic countries. PLoS Negl Trop Dis. 2015;9:e0003832. doi: 10.1371/journal.pntd.0003832 - DOI - PMC - PubMed
    1. Lessler J, Moore SM, Luquero FJ, McKay HS, Grais R, Henkens M, et al. Mapping the burden of cholera in sub-Saharan Africa and implications for control: an analysis of data across geographical scales. Lancet. 2018;391:1908–1915. doi: 10.1016/S0140-6736(17)33050-7 - DOI - PMC - PubMed
    1. Azman AS, Lauer SA, Bhuiyan TR, Luquero FJ, Leung DT, Hegde ST, et al. Vibrio cholerae O1 transmission in Bangladesh: insights from a nationally representative serosurvey. Lancet Microbe. 2020;1:e336–e343. doi: 10.1016/S2666-5247(20)30141-5 - DOI - PMC - PubMed
    1. Mosley WH, Benenson AS, Barui R. A serological survey for cholera antibodies in rural East Pakistan. Bull World Health Organ. 1968;38:327–334. - PMC - PubMed
    1. Weil AA, Begum Y, Chowdhury F, Khan AI, Leung DT, LaRocque RC, et al. Bacterial shedding in household contacts of cholera patients in Dhaka. Bangladesh Am J Trop Med Hyg. 2014;91:738–742. doi: 10.4269/ajtmh.14-0095 - DOI - PMC - PubMed

Publication types