. 2023 Sep 15;381(6663):eadh0301.
doi: 10.1126/science.adh0301. Epub 2023 Sep 15.

Conserved γδ T cell selection by BTNL proteins limits progression of human inflammatory bowel disease

Affiliations

Conserved γδ T cell selection by BTNL proteins limits progression of human inflammatory bowel disease

Robin J Dart et al. Science. .

Abstract

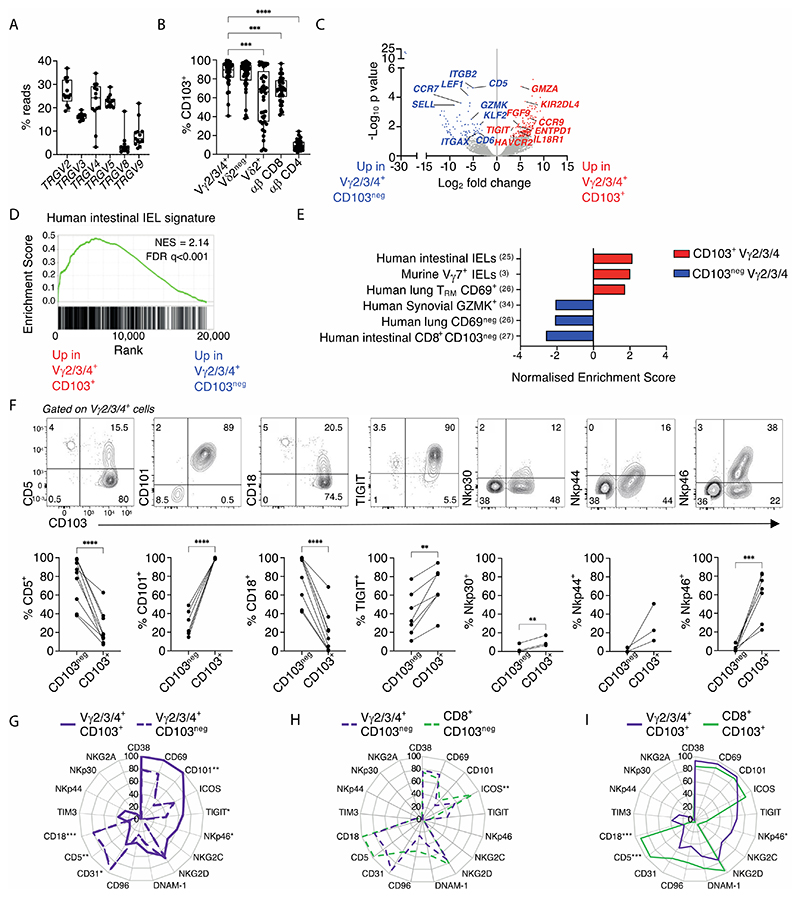
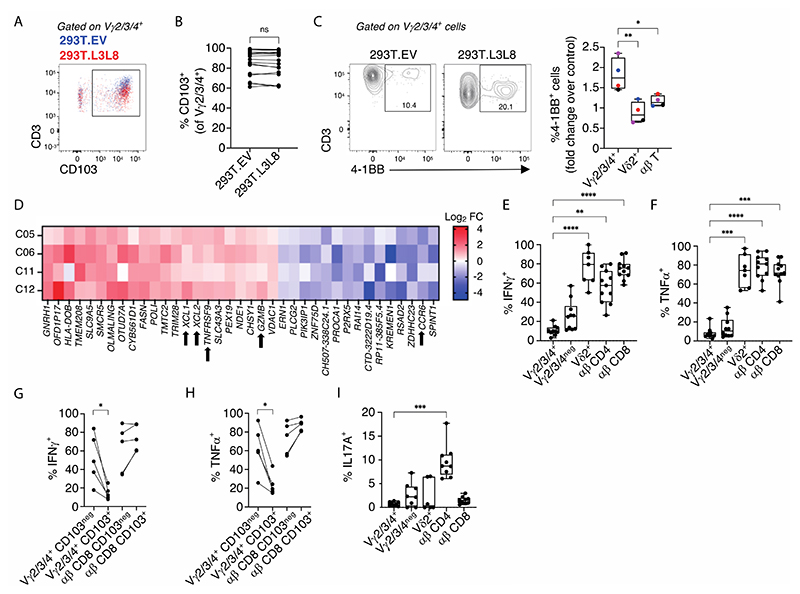
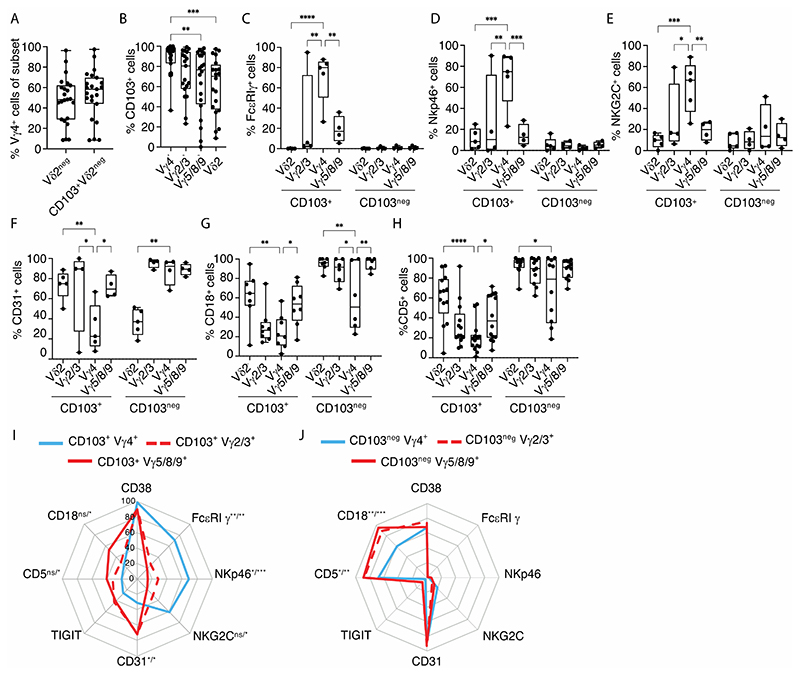
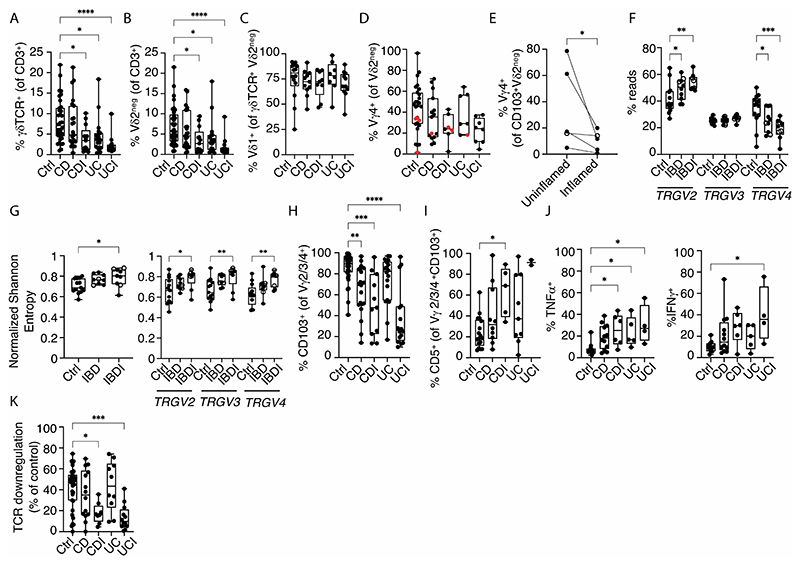
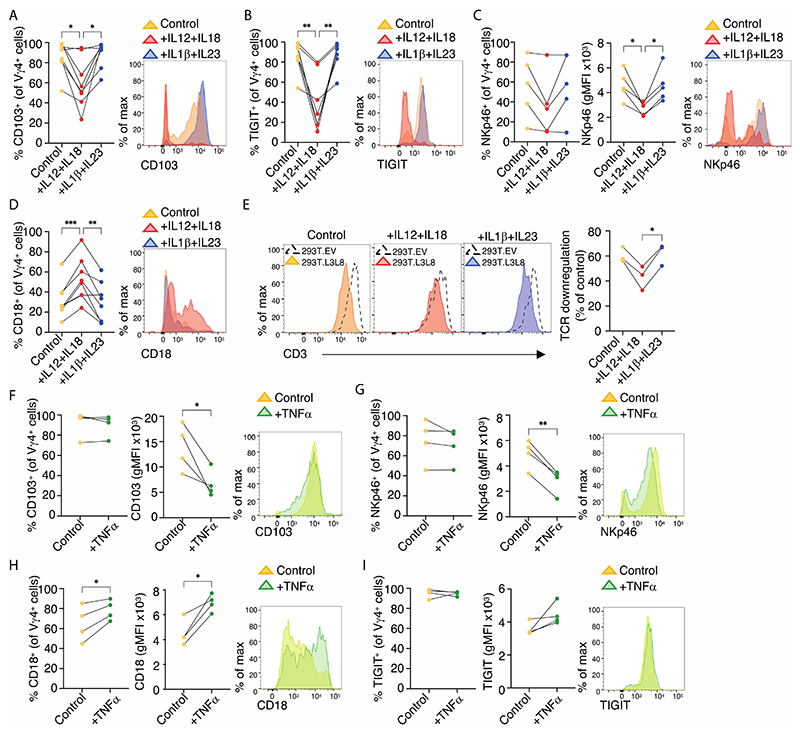
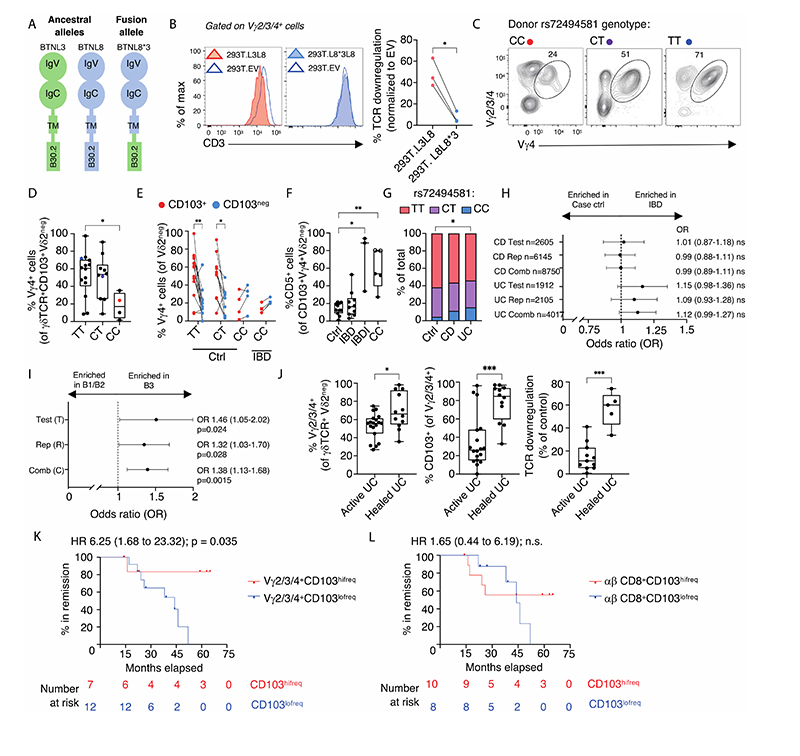
Murine intraepithelial γδ T cells include distinct tissue-protective cells selected by epithelial butyrophilin-like (BTNL) heteromers. To determine whether this biology is conserved in humans, we characterized the colonic γδ T cell compartment, identifying a diverse repertoire that includes a phenotypically distinct subset coexpressing T cell receptor Vγ4 and the epithelium-binding integrin CD103. This subset was disproportionately diminished and dysregulated in inflammatory bowel disease, whereas on-treatment CD103+γδ T cell restoration was associated with sustained inflammatory bowel disease remission. Moreover, CD103+Vγ4+cell dysregulation and loss were also displayed by humans with germline BTNL3/BTNL8 hypomorphism, which we identified as a risk factor for penetrating Crohn's disease (CD). Thus, BTNL-dependent selection and/or maintenance of distinct tissue-intrinsic γδ T cells appears to be an evolutionarily conserved axis limiting the progression of a complex, multifactorial, tissue-damaging disease of increasing global incidence.


Conflict of interest statement

Competing interests: R.J.D., I.Z., P.V., N.J.P. and A.C.H. are inventors on patent application WO2019053272A1 submitted by King’s College London that covers the use of “compositions and methods for enhancing gamma delta T cells in the gut”. R.J.D., I.Z., P.V., and A.C.H. are inventors on patent application WO2019234136A1 submitted by King’s College London and Gamma Delta Therapeutics that covers the use of “BTNL3/8 targeting constructs for delivery of payloads to the gastrointestinal system”. P.V. and A.C.H. are inventors on patent application WO2021171002A1 and WO2021171003A1 submitted by Gamma Delta Therapeutics entitled “Ex vivo gamma delta T cell populations”. R.J.D. has received speaking/consulting fees from Janssen, Takeda, Tillotts. All unrelated to this manuscript., C.A.L. declares research support and/or fees for development and delivery ofnon-promotional education from Janssen, Dr Falk, Takeda, Abbvie, AstraZeneca, Eli Lilly, Orion, Pfizer, Roche, Sanofi Aventis, Ferring, UCB, Biogen and Genentech Inc. All unrelated to this manuscript. P.M.I. declares research support and/or fees for development and delivery of non-promotional education from AbbVie, Arena, Boehringer-Ingelheim, BMS, Celgene, Celltrion, Falk Pharma, Ferring, Genentech, Galapagos, Gilead, Hospira, MSD, Janssen, Lilly, Pfizer, Pharmacosmos, Prometheus, Roche, Sandoz, Samsung Bioepis, Takeda, Tillotts, Topivert, Sapphire Medical, Shire, VH2, Vifor Pharma, Warner Chilcott. All unrelated to this manuscript. A.C.H. is a scientific consultant for Prokarium and eGenesis and Takeda, and receives research funds from Takeda Pharmeceuticals. All other authors report no conflict of interest.

Figures

Figure 1
Figure 1. Human gut γδ T cells are diverse and predominantly intraepithelial cells with distinct phenotypes.
(A). TRGV gene usage in control colonic biopsies measured by mRNA TCR deep sequencing (n=13). (B) Flow cytometric analysis of CD103 expression on the indicated γδ and αβ T cell subsets. (n=38-43). Median, IQR and min-max range shown. Symbols represent individual participants. Kruskal-Wallis test with Dunn’s correction against + Vγ2/3/4+ cells was used for analysis, ***p<0.001; ****p<0.0001. (C). Volcano plot of + neg + differentially expressed genes between CD103+ and CD103neg Vγ2/3/4+ bulk sorted cells + from control donors (n=4, C36, C37, C39, C88). Red – significantly upregulated in CD103+; blue – significantly upregulated in CD103neg; grey – non-significant. Corrected for multiple comparisons (FDR<0.05). (D). Gene Set Enrichment Analysis (GSEA) of the human + + CD103 Vγ2/3/4 signature from C. in a published human natural intraepithelial lymphocyte (IEL) signature dataset (25). NES – normalized enrichment score. (E). Summary graph of GSEA for CD103+ Vγ2/3/4 (red) and CD103neg Vγ2/3/4+ (blue) gene signatures in published datasets, (FDR<0.01). (F). Flow cytometric analysis of the expression of the indicated + neg+ markers (y axis) on CD103+ and CD103neg Vγ2/3/4+ cells. Representative flow plots (top) and summary data (bottom) are shown (n=3 -9). Connected symbols represent individual participants. Paired t-tests, **p<0.01; ***p<0.001; ****p<0.0001 (G-I). Radar plot of the + + + neg cell surface phenotype of (G) Vγ2/3/4+ CD103+ versus Vγ2/3/4+ CD103neg T cells; (H) Vγ2/3/4+ CD103neg versus CD8+ CD103neg αβ T cells; (I) Vγ2/3/4+ CD103 versus+ versus CD8+ CD103+ αβ T cells. (n=3-9 individuals per group) Plotted values represent mean of included participants. Multiple paired t-tests with Bonferroni-Dunn correction, *p<0.05; **p<0.01; ***p<0.001; ****p<0.0001.+
Figure 2
Figure 2. Vγ2/3/4+ cells make functional responses to BTNL3+BTNL8 stimulation but do not make classical effector cytokine responses.
(A). Example flow plot of CD3 expression neg on CD103neg and CD103+ Vγ2/3/4+ cells following overnight co-culture with 293T.EV (blue) or 293T.L3L8 cells (red). (B). Flow cytometric analysis of CD103 expression on intestinal Vγ2/3/4+ cells from control donors after co-culture as in A (n=18). Connected symbols represent individual participants. Paired t-test, ns – not significant (C). Flow cytometric analysis of 4-1BB expression on indicated colonic cell subsets (x axis) after co-culture as in A. Example flow plots (left) and summary graph (right) shown (n=4). Median, IQR and min-max range shown. Coloured symbols represent matched frequencies from individual participants. Repeated measures one-way ANOVA with Dunnett’s correction against Vγ2/3/4+ cells was used for analysis, *p<0.05; **p<0.01. (D). Significantly differentially expressed genes (x axis) in Vγ2/3/4+ cells co-cultured as in A. Data expressed as Log2 fold change (FC) for each donor (y axis). (E,F). Flow cytometric analysis of (E) IFNγ and (F) TNFα expression by the indicated colonic cell types (x axis) from control donors (n=7 -11) after 4h P+I stimulation. Median, IQR and min-max range shown. Symbols represent individual + participants. Kruskal-Wallis test with Dunn’s correction against Vγ2/3/4+ cells was used for analysis, **p<0.01; ***p<0.001; ****p<0.0001. (G,H). Flow cytometric analysis of (G) ++ TNFα and (H) IFNγ production by Vγ2/3/4+ γδ and CD8+ αβ T cells (x axis) (n=5) and split by their CD103 expression (legend) following 4h of P+I stimulation. Connected symbols represent individual participants. Multiple paired t-tests with Bonferroni-Dunn correction, *p<0.05. (I). Flow cytometric analysis of IL17A expression as in E and F (n=6-9). Median, IQR and min-max range shown. Symbols represent individual participants. Kruskal-Wallis + with Dunn’s correction against Vγ2/3/4+ cells was used for analysis, ***p<0.001.
Figure 3
Figure 3. Vγ4 cells are phenotypically distinct from other γδ cells
(A). Flow cytometric analysis of %Vγ4+ cells (y axis) in the indicated γδ subsets (x axis) from control biopsies (n=23). (B). Flow cytometric analysis of CD103 expression on the indicated γδ subsets (x axis) from control biopsies (n=19-23). Kruskal-Wallis test with Dunn’s correction against Vγ4+ cells was used for analysis, **p<0.01; ****p<0.0001. (C-H). Flow cytometric analysis of (C) % FcεRIγ+ (n=4-5); (D) % Nkp46+ (n=4-5); (E) % NKG2C+ (n=4-5); (F) % CD31+ (n=4-5); (G) % CD18+ (n=6-8); (H) % CD5+ (n=10-14) cells on the indicated γδ subsets (x axis, CD103+ and CD103neg) from control gut tissue. Two-way ANOVA with Dunnett correction against Vγ4+ cells was used for analysis, *p<0.05; **p<0.01; ***p<0.001;****p<0.0001. (A-H) Median, IQR and min-max range shown. Symbols represent individual participants. (I,J). Radar plot of (I) the surface phenotype of CD103+ Vγ4+ versus CD103+ Vγ2/3+ versus CD103+ Vγ5/8/9+ γδ T cells; and (J) CD103neg Vγ4+ versus CD103neg Vγ2/3+ versus CD103neg Vγ5/8/9+ γδ T cells from control donors (n=4-14). Plotted values represent mean of included participants. Two-way ANOVA + with Dunnett correction against Vγ4 cells was used for analysis, *p<0.05; **p<0.01; ***p<0.001; ns – not significant. Significance displayed as “versus Vγ2/3+ / versus + Vγ5/8/9+”.
Figure 4
Figure 4. Phenotypic and clonotypic changes of the intestinal γδ T cells compartment in IBD.
(A-C). Flow cytometric analysis of (A) % γδTCR+, and (B) % Vδ2neg cells of total T lymphocytes isolated from control (n=34), CD (n=23), CDI (n=13), UC (n=19) and UCI (n=14) donors; and (C) % Vδ1+ of Vδ2neg γδ T cells isolated from control (n=14), CD (n=11), CDI (n=9), UC (n=8) and UCI (n=12) donors. Kruskal-Wallis test with Dunn’s correction against control donors was used for analysis, *p<0.05; ****p<0.0001. (D). Flow cytometric analysis of % Vγ4+ cells of Vδ2neg colonic γδ T cells from control (n=27), CD (n=15), CDI (n=7), UC (n=7), UCI (n=8) biopsies. Red dots – BTNL genotype discussed subsequently. (E). Flow cytometric analysis of % Vγ4 cells of CD103+ Vδ2neg colonic γδ T cells from paired uninflamed and inflamed tissue from IBD donors sampled at the same endoscopy (n=5). Connected symbols represent individual participants. Open circles – CD donor; Filled circles – UC donors. Ratio paired t-test, *p<0.05. (F). TRGV2, TRGV3, TRGV4 gene usage as proportion of total TRGV2/3/4 reads from TCR deep sequencing of whole biopsies mRNA (Ctrl n=13; IBD n=9, IBDI n=9). Open circles - CD donors; filled circles - UC donors. Twoway ANOVA with Dunnett correction against control donors was used for analysis, *p<0.05; **p<0.01. (G). Total γδTCR (left) and TRGV2/3/4 (right) diversity measured by normalized Shannon entropy derived from TCR deep sequencing of whole biopsies mRNA from control (n=13), IBD (n=9) and IBDI (n=9) donors. Open circles – CD donors; filled circles – UC donors. Two-way ANOVA with Dunnett correction against control donors was used for analysis, *p<0.05; **p<0.01; ***p<0.001. (H). Flow cytometric analysis of CD103 expression on Vγ2/3/4+ colonic γδ T cells derived from control (n=43), CD (n=22), CDI (n=11), UC (n=18), UCI (n=17) donors. Kruskal-Wallis test with Dunn’s correction against control donors was used for analysis, **p<0.01; ***p<0.001; ****p<0.0001. (I). Flow cytometric analysis of CD5 expression on CD103+ Vγ4+ colonic γδ T cells derived from control (n=17), CD (n=10), CDI (n=5), UC (n=9), UCI (n=2) donors. Kruskal-Wallis test with Dunn’s correction against control donors was used for analysis, *p<0.05. (J). Flow cytometric analysis of TNFα (left) and IFNγ (right) expression by Vγ2/3/4+ colonic lymphocytes obtained from control (n=11), CD (n=12), CDI (n=6), UC (n=5) and UCI (n=4) donors following 4h of P+I stimulation. Kruskal-Wallis test with Dunn’s correction against control donors was used for analysis, *p<0.05. (K). Flow-cytometric analysis of %TCR downregulation by human colonic Vγ2/3/4+ lymphocytes derived from control (n=34), CD (n=14), CDI (n=8), UC (n=10) and UCI (n=12) donors, after overnight co-culture with 293T.EV or 293T.L3L8 cells. Kruskal-Wallis test with Dunn’s correction against control donors was used for analysis, *p<0.05; ***p<0.001. All box and whisker plots: median, IQR and min-max range shown. Symbols represent individual participants.+
Figure 5
Figure 5. The cytokine milieu can affect the phenotype of intestinal Vγ4+ cells.
(A-D). Flow cytometric analysis of (A) CD103 (n=8), (B) TIGIT (n=8), (C) NKp46 (n=5), and (D) CD18 (n=8) expression on Vγ4+ colonic lymphocytes cultured for 7 days in IL2+IL15 (control); IL2+IL15+IL12+IL18 and IL2+IL15+IL1β+IL23. Summary data (left) and representative histograms (right) shown. Connected symbols represent individual participants. Repeated measures one-way ANOVA with Dunnett’s correction against IL12+IL18 treatment was used for analysis, *p<0.05; **p<0.01; ***p<0.001. (E). Flow cytometric analysis of Vγ2/3/4+ colonic lymphocytes cultured for 7 days as in A-D and subsequently co-cultured overnight with 293T.EV and 293T.L3L8 cells (n=3). Representative flow plots of CD3 expression and summary graph (far right) of percent TCR downregulation relative to 293T.EV control are shown. Repeated measures one-way ANOVA with Bonferroni correction, *p<0.05. (F-I). Flow cytometric analysis of (F) CD103, (G) NKp46, (H) CD18 + and (I) TIGIT expression on Vγ4 colonic lymphocytes cultured for 7 days in IL2+IL15 (control) and IL2+IL15+TNFα (n=4). Summary data (left, centre) and representative histograms (right) shown. gMFI - geometric mean fluorescent intensity. Connected symbols represent individual participants. Paired t-test, *p<0.05; **p<0.01.
Figure 6
Figure 6. A genetic influence on the Vγ4-BTNL axis.
(A). Graphical representation of full length BTNL3, BTNL8 and BTNL8*3 fusion protein structure. TM – transmembrane. (B). Flow cytometric analysis of human colonic Vγ2/3/4+ cells co-cultured overnight with 293T.EV, 293T.L3L8 and 293T. L8L8*3 (n=3). Example flow plots of CD3 expression and summary graph (far right) of %TCR downregulation relative to 293T.EV control are shown. Connected symbols represent individual participants. Paired t-test, *p<0.05. (C). Example neg flow cytometry plots of % Vγ4+ cells of CD103+ Vγ2neg γδ T cells obtained from control biopsies. rs72494581 status indicated above plots. Coloured dots correspond to data points neg displayed in panel D. (D). Flow cytometric analysis of % Vγ4+ cells of CD103+ Vγ2neg γδ T cells according to their rs72494581 SNP genotype in control donors. CC (n=4), CT (n=10), TT (n=14). Median, IQR and min-max range shown. Symbols represent individual participants. Kruskal-Wallis test with Dunn’s correction against control donors was used for neg analysis, *p<0.05. (E). Flow cytometric analysis of % Vγ4+ cells (y axis) of CD103+ Vγ2neg (red) or CD103neg Vγ2neg (blue) populations in control donors with different rs72494581 genotype (x axis) and IBD donors with the CC genotype. Square – UC donor. CC Ctrl (n=4),CC IBD (n=4), CT Ctrl (n=10), TT Ctrl (n=14). Connected symbols represent individual participants. Wilcoxon matched-pair test, *p<0.05; **p<0.01. (F). Flow cytometric analysis of % CD5+ cells of Vγ4+ CD103+ Vδ2neg lymphocytes from control (n=11), IBD (n=10) and IBDI (n=3) TT and CT donors, and control (n=3) and uninflamed IBD (n=2, open circles) CC donors. Median, IQR and min-max range shown. Symbols represent individual participants. Kruskal-Wallis test with Dunn’s correction against control donors was used for analysis, *p<0.05; **p<0.01. (G). Frequency of the rs72494581 genotype within the local cohort (ctrl n=115 ; CD n=64 ; UC n=52). Fisher’s exact test, *p<0.05. (H). Odds ratios (OR) for development of CD or UC compared to 1950s birth cohort data. OR (95% confidence intervals) presented according to the minor allele (CC) and risk of developing disease. (I). OR for development of B3 versus B1/B2 CD. OR (95% confidence intervals) presented according to the minor allele (CC) and risk of developing disease complications (T n=1817; R n=4491; C n=6308). H,I. Test - test set; Rep – replication set; Comb – combined set. (J). Flow cytometric analysis of: percent Vγ2/3/4+ cells (left); % CD103+ Vγ2/3/4+ cells (middle); and % TCR downregulation by γδ lymphocytes after overnight co-culture with 293T.EV or 293T.L3L8 cells (right) in the same donors. Colonic biopsies were obtained from inflamed (n=11 -19) and previously inflamed (healed) areas (n=5-12). Median and inter-quartile range shown (box) with minimum and maximum values (whiskers). Symbols represent individual participants. Mann-Whitney U test, *p<0.05; ***p<0.001. (K,L). Hazard ratio (HR) analysis of IBD patients in remission with intestinal (K) CD103hifreq Vγ2/3/4+ cells (CD n=3; UC n=4) and CD103lofreq Vγ2/3/4+ cells (CD n=8; UC n=4); and (L) CD103hifreq CD8+ αβ T cells (CD n=4; UC n=6) and CD103lofreq CD8+ αβ T cells (CD n=6; UC n=2) in colonic biopsies at time of sampling. Subjects followed until the end of the study or relapse. Log rank test, Hazard ratio log rank, ns – not significant.

Comment in

References

    1. Fernando MMA, et al. Defining the Role of the MHC in Autoimmunity: A Review and Pooled Analysis. PLOS Genetics. 2008;4:e1000024. - PMC - PubMed
    1. Hayday AC. Paul’s Fundamental Immunology. Wolters Kluwer/Lippincott Williams Wikins; Philadelphia: 2022. Gamma Delta T Cells; pp. 1054–1101. chap. 35.
    1. Di Marco Barros R, et al. Epithelia Use Butyrophilin-like Molecules to Shape Organ-Specific gammadelta T Cell Compartments. Cell. 2016;167:203–218.:e217. - PMC - PubMed
    1. Jandke A, et al. Butyrophilin-like proteins display combinatorial diversity in selecting and maintaining signature intraepithelial gammadelta T cell compartments. Nature communications. 2020;11:3769 - PMC - PubMed
    1. Barbee SD, et al. Skint-1 is a highly specific, unique selecting component for epidermal T cells. Proceedings of the National Academy of Sciences. 2011;108:3330–3335. - PMC - PubMed