Hydroxychloroquine in Stage 1 Type 1 Diabetes
- PMID: 37708415
- PMCID: PMC10620539
- DOI: 10.2337/dc23-1096
Hydroxychloroquine in Stage 1 Type 1 Diabetes
Abstract
Objective: Innate immune responses may be involved in the earliest phases of type 1 diabetes (T1D).
Research design and methods: To test whether blocking innate immaune cells modulated progression of the disease, we randomly assigned 273 individuals with stage 1 T1D to treatment with hydroxychloroquine (n = 183; 5 mg/kg per day to a maximum of 400 mg) or placebo (n = 90) and assessed whether hydroxychloroquine treatment delayed or prevented progression to stage 2 T1D (i.e., two or more islet autoantibodies with abnormal glucose tolerance).
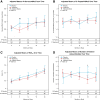
Results: After a median follow-up of 23.3 months, the trial was stopped prematurely by the data safety monitoring board because of futility. There were no safety concerns in the hydroxychloroquine arm, including in annual ophthalmologic examinations. Preplanned secondary analyses showed a transient decrease in the glucose average area under the curve to oral glucose in the hydroxychloroquine-treated arm at month 6 and reduced titers of anti-GAD and anti-insulin autoantibodies and acquisition of positive autoantibodies in the hydroxychloroquine arm (P = 0.032).
Conclusions: We conclude that hydroxychloroquine does not delay progression to stage 2 T1D in individuals with stage 1 disease. Drug treatment reduces the acquisition of additional autoantibodies and the titers of autoantibodies to GAD and insulin.
© 2023 by the American Diabetes Association.
Conflict of interest statement
Figures


References
-
- Bluestone JA, Buckner JH, Herold KC. Immunotherapy: building a bridge to a cure for type 1 diabetes. Science 2021;373:510–516 - PubMed
Publication types
MeSH terms
Substances
Grants and funding
- U01 DK085476/DK/NIDDK NIH HHS/United States
- U01 DK106993/DK/NIDDK NIH HHS/United States
- U01 DK106984/DK/NIDDK NIH HHS/United States
- U01 DK107013/DK/NIDDK NIH HHS/United States
- P30 DK036836/DK/NIDDK NIH HHS/United States
- U01 DK103282/DK/NIDDK NIH HHS/United States
- UC4 DK106993/DK/NIDDK NIH HHS/United States
- U01 DK061042/DK/NIDDK NIH HHS/United States
- U01 DK085461/DK/NIDDK NIH HHS/United States
- U01 DK085509/DK/NIDDK NIH HHS/United States
- U01 DK085466/DK/NIDDK NIH HHS/United States
- U01 DK061058/DK/NIDDK NIH HHS/United States
- UL1 TR001863/TR/NCATS NIH HHS/United States
- U01 DK085453/DK/NIDDK NIH HHS/United States
- U01 DK107014/DK/NIDDK NIH HHS/United States
- U01 DK106994/DK/NIDDK NIH HHS/United States
- P30 DK020595/DK/NIDDK NIH HHS/United States
- U01 DK085504/DK/NIDDK NIH HHS/United States
LinkOut - more resources
Full Text Sources
Medical

