. 2023 Sep 13;31(9):1539-1551.e6.
doi: 10.1016/j.chom.2023.08.010.

Identification of genes required for Plasmodium gametocyte-to-sporozoite development in the mosquito vector

Affiliations

Identification of genes required for Plasmodium gametocyte-to-sporozoite development in the mosquito vector

Chiamaka Valerie Ukegbu et al. Cell Host Microbe. .

Abstract

Malaria remains one of the most devastating infectious diseases. Reverse genetic screens offer a powerful approach to identify genes and molecular processes governing malaria parasite biology. However, the complex regulation of gene expression and genotype-phenotype associations in the mosquito vector, along with sexual reproduction, have hindered the development of screens in this critical part of the parasite life cycle. To address this, we developed a genetic approach in the rodent parasite Plasmodium berghei that, in combination with barcode sequencing, circumvents the fertilization roadblock and enables screening for gametocyte-expressed genes required for parasite infection of the mosquito Anopheles coluzzii. Our results confirm previous findings, validating our approach for scaling up, and identify genes necessary for mosquito midgut infection, oocyst development, and salivary gland infection. These findings can aid efforts to study malaria transmission biology and to develop interventions for controlling disease transmission.

Keywords: crystalloid; gametocyte expression; host-parasite interactions; malaria transmission; oocyst; ookinete gliding motility; ookinete vesicle trafficking; salivary gland invasion; signature-tagged mutagenesis; sporozoite infectivity.


Conflict of interest statement

Declaration of interests The authors declare no competing interests.

Figures
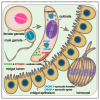
Graphical abstract
Graphical abstract
Figure 1
Figure 1. Transcriptional enrichment in P. berghei gametocytes
Volcano plot showing differential gene expression measurements between the ANKA 2.34 WT and ANKA 2.33 non-gametocyte-producing P. berghei lines 1 hpi in the A. coluzzii midgut. Red and green dots represent the 274 genes that are regulated by at least 1.6-fold, respectively, in the ANKA 2.34 WT line compared with the ANKA 2.33 line. Gray dots represent genes that do not show significant regulation. 189 genes (red dots) were enriched in the ANKA 2.34 compared with the ANKA 2.33 line and include genes involved in sexual and sporogonic development such as PPLP2, DOZI, P25, P28, IMC1h, and LAP2. Eighty-five genes (green) were identified to be downregulated and include genes encoding putative blood stage proteins such as AMA1 and the merozoite surface proteins MSP1 and MSP7. Genes in bold are those selected for further characterization.
Figure 2
Figure 2. STM genetic and experimental design
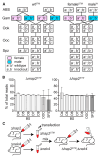
(A) Parasite genotypes after mutagenesis in WT parasites (WTSTM) or female-donor line (femaleSTM, e.g., Δmap2STM and Δhap2STM) crossed to WT male-donor line (maleWT, e.g., Δnek4WT). Example of two STM mutant loci (a and b) shown. (B) Growth dynamics of Δmap2 and Δhap2 in mouse blood stages (BSs) 4–8 days post transfection with STM pool and in oocyst and salivary gland sporozoites after crossing to Δnek4 during A. coluzzii infection. Percentage of map2 and hap2 barcode counts in total barcode counts shown. Whiskers show SEM. (C) Experimental approach schematic with mutagenesis carried out in Δhap2 (Δhap2STM), mixed with Δnek4 to infect mice, and followed by mosquito infections with derived transheterozygous parasites. ABSs, asexual blood stages; BSs, blood stages; Gam, gametes; Ook, ookinetes; Ooc, oocysts; Spz, sporozoites.
Figure 3
Figure 3. Results of STM screen
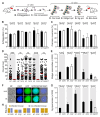
(A) Fitness of blood stage STM mutants in WT (left) and Δhap2 (right) genetic backgrounds shown as relative barcode abundance (ratio of each to total barcode counts) at days 5–8 (D5–D8) to day 5 (D5) post mouse infection. f day 5 (f D5) is frequency of each barcode in every 1,000 barcodes in day 5 (D5). (B) Stability of STM mutants in WT genetic background throughout 9 mouse-to-mouse passages (P1–P9) shown as relative barcode abundance in each passage (Pn) to the first passage (P1). f P1 is frequency of each barcode in every 1,000 barcodes in P1. (C) Developmental progression of STM mutants in WT or Δhap2 genetic backgrounds in A. coluzzii mosquitoes shown as relative barcode abundance in oocysts or sporozoites to blood stages, and sporozoites to oocysts. f BS is frequency of each barcode in every 1,000 barcodes in blood stages. Abundance differences in heatmaps are color-coded as in key; gray-shaded boxes represent barcodes with starting frequencies < 0.01; black boxes indicate zero or near zero count ratios. Statistical analysis done with Student’s t test, with p values shown as dots prior to multiple testing correction and as stars post multiple testing correction. ABSs, asexual blood stages; BSs, blood stages; Gam, gametocytes or gametes; Ook, ookinetes; Ooc, oocysts; Spz, sporozoites; WT, c507.
Figure 4
Figure 4. Phenotypic characterization of P. berghei knockout mutant parasites
(A) Schematic representation of experimental assays. (B) Exflagellating male gametocyte percentage, compared with that of WT controls. Student’s t test used for statistical analysis. (C) Female gamete to ookinete conversion percentage, compared with WT controls. Statistical analysis done with Student’s t test. (D) Oocyst load in A. coluzzii midguts 8 days pbf, compared with WT controls. Red lines show median. Mann-Whitney is used for statistical analysis. (E) Sporozoite (Spz) numbers in A. coluzzii midguts of mutant parasites and WT controls. Student’s t test used for statistical analysis. (F) Fluorescence microscopy images of GFP-expressing Δcro oocysts compared with WT controls in A. coluzzii midguts 15 days pbf. DNA stained with DAPI. BF, bright field. Scale bars: 5 μM. (G) Sporozoite (Spz) numbers in A. coluzzii salivary glands (Sg) of mutant parasites, compared with WT controls. Student’s t test used for statistical analysis. (H) Mouse infection from bite-back of mosquitoes infected with mutant parasites or WT controls. Each mouse shown as a rectangle, columns indicate independent replicates. Infected mice shown in yellow, and non-infected mice shown in blue. In all panels: WT, c507 line; ns, not significant; n, number of biological replicates; whiskers show SEM; *p < 0.05, **p < 0.001, ***p < 0.0001.
Figure 5
Figure 5. STONES and ROVER role in ookinete gliding motility
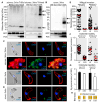
(A) Western blot analysis in stones::3xha line using an α-HA antibody under reducing conditions on Triton X-100 soluble (TriSol) and Triton X-100 insoluble (TriInsol) fractions. STONES::3xHA-specific signals indicated with black arrowheads. GFP and P28 used as loading and stage-specific controls, respectively; BS, mixed blood stages; Gc(–), inactivated purified in vitro cultured gametocytes; Gc(+), activated purified in vitro cultured gametocytes; Ook, purified in vitro cultured ookinetes. (B) Western blot analysis in rover::3xha line using α-HA antibody under reducing conditions on whole-cell lysates. ROVER::3xHA-specific signals are indicated with black arrowheads. Abbreviations as above. (C) Immunofluorescence assays on stones::3xha in vitro cultured ookinetes Triton X-100 permeabilized (top two rows) and non-permeabilized (bottom row). Ookinetes stained with α-HA and α-P28 antibodies. DNA stained with DAPI. BF, bright field. Scale bars: 5 μM. (D) Immunofluorescence assays on rover::3xha in vitro cultured ookinetes stained with α-HA and α-P28 antibodies. DNA stained with DAPI. BF, bright field. Scale bars: 5 μM. (E) Numbers of melanized ookinetes in CTL4 knockdown A. coluzzii infected with Δsto, Δrov, and c507 WT controls. Red lines indicate median. Statistical analysis done with the Mann-Whitney test. ***p < 0.0001; n, number of biological replicates. (F) Speed of in vitro cultured Δsto, Δrov, and c507 WT ookinetes measured with time-lapse microscopy (1 frame/5 s for 10 min). Horizontal red lines show median, and red whiskers show SEM. Statistical analysis done with the Mann-Whitney test; ***p < 0.0001; n, number of biological replicates. (G) Sporozoites numbers in A. coluzzii salivary glands (Sg) after hemocoel injection of Δsto, Δrov, and c507 WT in vitro cultured ookinetes whiskers show SEM. Statistical analysis done with Student’s t test (unpaired two-tailed, equal variance); ns, not significant; n, number of biological replicates. (H) Bite-back mouse infection with mosquitoes infected with Δsto, Δrov, and c507 WT controls. Each mouse shown as a rectangle, and columns indicate independent biological replicates. Infected mice shown in yellow.
Figure 6
Figure 6. CRYSP and CRONE expression and localization
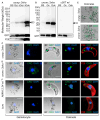
(A) Western blot analysis of crysp::3xha and c507 WT control using α-HA antibody under reducing conditions on whole-cell lysates. CRYSP::3xHA band is indicated with black arrowhead. GFP and P28 used as loading and stage-specific controls, respectively. BS, mixed blood stages; Gc(–), inactivated purified in vitro cultured gametocytes; Gc(+), activated and purified in vitro cultured gametocytes; Ook, purified in vitro cultured ookinetes. (B) Western blot analysis of crone::3xha (left) and c507 WT control (right) using an α-HA antibody under reducing conditions on whole-cell lysates. CRONE::3xHA band is indicated with black arrowhead. Abbreviations as above. (C) Immunofluorescence assays of crysp::3xha purified gametocytes and ookinetes stained with α-HA and α-P28 antibodies. DNA stained with DAPI. BF, bright field. Scale bars: 2.5 μM. (D) Immunofluorescence assays of crone::3xha purified gametocytes and ookinetes stained with α-HA and α-P28 antibodies. DNA stained with DAPI. BF, bright field. Scale bars: 2.5 μM. (E) Immunofluorescence images of crysp::3xha and crone::3xha cultured ookinetes stained with α-HA. BF, bright field. (F) Immunofluorescence assays of ANKA 2.34 WT and Δcro purified gametocytes and ookinetes stained with α-CRONE and α-P28 antibodies. DNA stained with DAPI. BF, bright field. Scale bars: 2.5 μM.

References

    1. Akinosoglou KA, Bushell ES, Ukegbu CV, Schlegelmilch T, Cho JS, Redmond S, Sala K, Christophides GK, Vlachou D. Characterization of Plasmodium developmental transcriptomes in Anopheles gambiae midgut reveals novel regulators of malaria transmission. Cell Microbiol. 2015;17:254–268. doi: 10.1111/cmi.12363. - DOI - PMC - PubMed
    1. Ukegbu CV, Cho JS, Christophides GK, Vlachou D. Transcriptional silencing and activation of paternal DNA during Plasmodium berghei zygotic development and transformation to oocyst. Cell Microbiol. 2015;17:1230–1240. doi: 10.1111/cmi.12433. - DOI - PMC - PubMed
    1. Modrzynska K, Pfander C, Chappell L, Yu L, Suarez C, Dundas K, Gomes AR, Goulding D, Rayner JC, Choudhary J, et al. A knockout screen of ApiAP2 genes reveals networks of interacting transcriptional regulators controlling the plasmodium life cycle. Cell Host Microbe. 2017;21:11–22. doi: 10.1016/j.chom.2016.12.003. - DOI - PMC - PubMed
    1. Yuda M, Iwanaga S, Shigenobu S, Mair GR, Janse CJ, Waters AP, Kato T, Kaneko I. Identification of a transcription factor in the mosquito-invasive stage of malaria parasites. Mol Microbiol. 2009;71:1402–1414. - PubMed
    1. Hall N, Karras M, Raine JD, Carlton JM, Kooij TW, Berriman M, Florens L, Janssen CS, Pain A, Christophides GK, et al. A comprehensive survey of the Plasmodium life cycle by genomic, transcriptomic, and proteomic analyses. Science. 2005;307:82–86. - PubMed

LinkOut - more resources