. 2023 Sep 14;14(1):5682.
doi: 10.1038/s41467-023-41424-1.

Growth phase estimation for abundant bacterial populations sampled longitudinally from human stool metagenomes

Affiliations

Growth phase estimation for abundant bacterial populations sampled longitudinally from human stool metagenomes

Joe J Lim et al. Nat Commun. .

Abstract

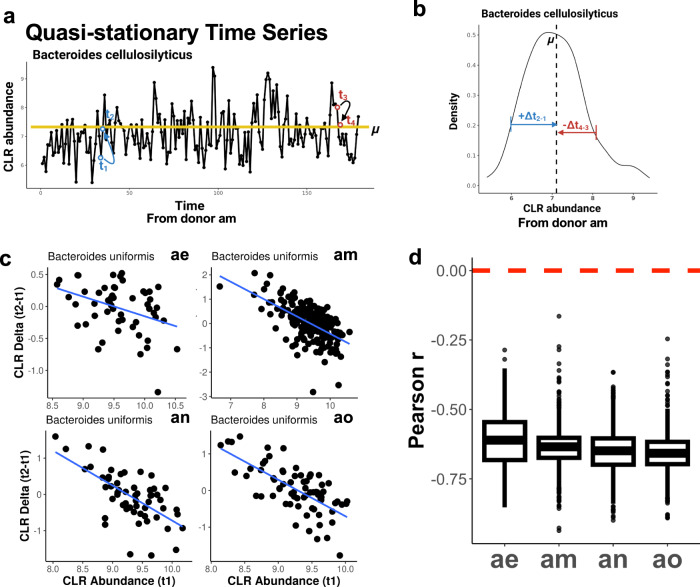
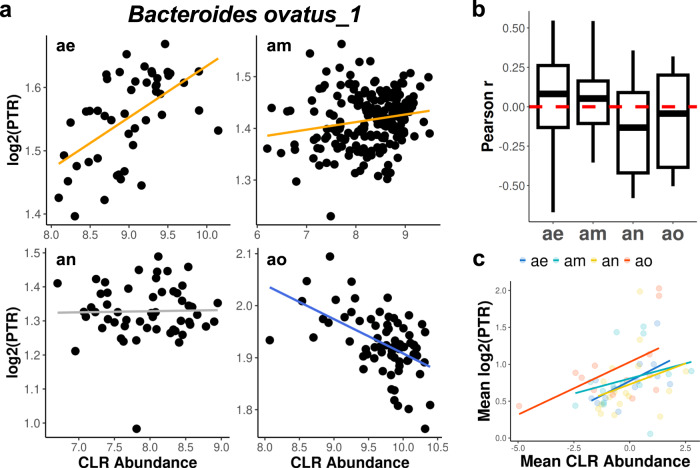
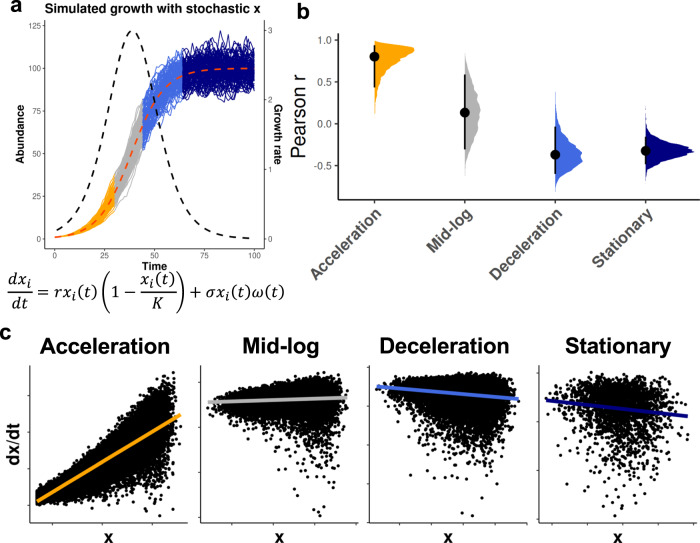
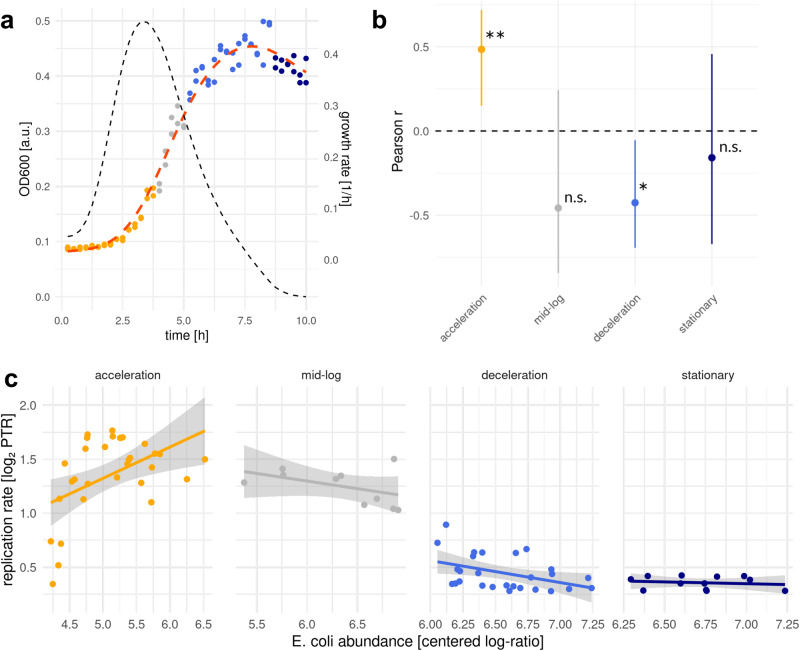
Longitudinal sampling of the stool has yielded important insights into the ecological dynamics of the human gut microbiome. However, human stool samples are available approximately once per day, while commensal population doubling times are likely on the order of minutes-to-hours. Despite this mismatch in timescales, much of the prior work on human gut microbiome time series modeling has assumed that day-to-day fluctuations in taxon abundances are related to population growth or death rates, which is likely not the case. Here, we propose an alternative model of the human gut as a stationary system, where population dynamics occur internally and the bacterial population sizes measured in a bolus of stool represent a steady-state endpoint of these dynamics. We formalize this idea as stochastic logistic growth. We show how this model provides a path toward estimating the growth phases of gut bacterial populations in situ. We validate our model predictions using an in vitro Escherichia coli growth experiment. Finally, we show how this method can be applied to densely-sampled human stool metagenomic time series data. We discuss how these growth phase estimates may be used to better inform metabolic modeling in flow-through ecosystems, like animal guts or industrial bioreactors.


Conflict of interest statement

The authors decalre no competing interests.

Figures

Fig. 1
Fig. 1. Conceptual figure showing internal bacterial population dynamics within a human gut and the observed steady-state abundance derived from stool sampling.
a Mammalian guts are continuous flow-through systems. Taxa grow in the large intestine with varying growth rates, carrying capacities, and steady-state population sizes, and may be in different growth phases at the time of stool sampling. For example, see dynamics for Taxa 1–3. Daily stool collections show variation in abundances, but this variation likely does not reflect internal growth dynamics in the gut. b Healthy BIO-ML stool donors (subject IDs: ae, am, an, and ao) with samples collected 3-5 days per week for a total of >50 time points. Red indicates presence of shotgun metagenomic sequencing data and gray represents absence of metagenomic data from consecutive daily time points.
Fig. 2
Fig. 2. Regression-to-the-mean effect in human microbial time series data.
a Yellow line represents the mean abundance (μ) of Bacteroides cellulosilyticus over time in donor am. Time points t1 and t3 indicate fluctuations below and above the mean abundance, and t2 and t4 show the return to the mean abundance. b Distribution of time series delta values (e.g., t2-t1) for Bacteroides cellulosilyticus in donor am, which is approximately normally distributed. c Delta vs. abundance for Bacteroides uniformis time series from donors ae, am, an, and ao. d Box plots (showing minima, 25th percentile, median, 75th percentile, and maxima) of Pearson r values for deltas vs. abundances across all taxa time series in all four donors. Red line indicates a Pearson correlation coefficient of 0.
Fig. 3
Fig. 3. Variable relationships between PTRs and CLR-normalized abundances across human gut microbial time series.
The ratio of sequencing coverage near the replication origin to the replication terminus for each species (i.e., peak-to-trough ratio, or PTR), was calculated using COPTR. a Log2(PTR) and CLR-normalized abundance relationships for Bacteroides ovatus_1 in donors ae, am, an, and ao. Orange and blue lines show significantly positive and negative linear regression coefficients (linear regression, FDR adjusted p-value < 0.05), respectively. Gray lines indicate no statistically significant association. Donor ae: p = 0.0005, donor am: p = 0.0317, donor an: p = 0.925, donor ao: p = 0.00005. b Box plots (showing minima, 25th percentile, median, 75th percentile, and maxima) of Pearson r values combined for all filtered taxa for each donor. c Mean log2(PTR) and mean CLR-normalized abundance for all abundant taxa in each donor (p-values for regressions run within each donor were combined using Fisher’s method; combined p-value = 0.005).
Fig. 4
Fig. 4. Diagram of the logistic growth equation.
a The logistic growth curve models abundance (x) with respect to time (top panel). Orange, gray, blue, and navy indicates acceleration, mid-log, deceleration, and stationary phases, respectively. The first derivative of the logistic growth curve shows the growth rate with respect to time (middle panel). The second derivative of the logistic growth curve shows growth acceleration with respect to time (bottom panel). b Expected relationships between abundance and growth rate at different locations along the logistic growth curve.
Fig. 5
Fig. 5. Distinguishing growth phases using the stochastic logistic growth model.
a Stochastic logistic growth curves with growth rate (r) = 1.2, carrying capacity (K) = 100, and noise level (n) = 0.1 across 100 iterations. Major growth phase groups in orange (acceleration), gray (mid-log), blue (deceleration), and navy (stationary). b Pearson r values between abundances and growth rates in each of the four growth phase windows across variable model parameterizations (r = 1–3, K = 10-1000) and a fixed noise level (σ = 0.1). Black circles represent the median and black bars show 95% confidence interval. c Scatter plots in log scale showing relationships between abundance and growth rate across the four growth phase regions defined in (a).
Fig. 6
Fig. 6. Relationship between growth rate and abundance in major growth phases in E.coli populations.
a Growth curve of E.coli (MG1655) using OD measurements. Colors describe major growth phases. Dotted black and red lines show the growth rate derived from OD measurements and mean growth trajectory, respectively. b Pearson r values between abundance and growth rate in each of the four growth phase windows. Asterisks show statistical significance from two-sided correlation tests without adjustment for multiple comparisons. **: p < 0.01 (acceleration: p = 0.007), *: p < 0.05 (deceleration: p = 0.003), n.s.: not significant (mid-log: 0.184, stationary: 0.622). Black circles represent the median and black bars show 95% confidence interval. Pooled duplicate samples (4 sets of replicate cultures) for 40 time points in total were used (see Methods). c Scatter plots in log scale showing relationships between abundance and replication rate (log2PTR) across the four growth phase regions defined in (a). Gray regions represent 95% confidence intervals.
Fig. 7
Fig. 7. In vivo growth phase estimation.
a We find variable relationships between log2(PTRs) and population abundances across taxa in each of the four donors, consistent with the growth phase patterns observed in sLGE simulations. Donors with higher defecation rates tended to have a larger fraction of taxa with positive log2(PTR)-abundance associations and fewer with negative associations, indicating acceleration and deceleration-stationary phases, respectively. Taxa in stationary phase were classified using an empirical threshold (average log2PTR < 0.358). Non-stationary taxa (i.e., above the stationary phase threshold, but lacking a significant correlation between log2(PTRs) and abundances) are likely in mid-log phase, but these taxa could also be in acceleration/deceleration phases (i.e., underpowered to detect the correlation). b We suggest that higher defecation rates (i.e., higher dilution rates) push bacterial populations towards earlier growth phases, which is consistent with our results in (a). c Growth phase estimates can be leveraged to identify taxa that are more-or-less amenable to metabolic modeling techniques, such as Flux Balance Analysis, which assumes exponential growth.

Similar articles

Cited by

References

    1. El Aidy S, Hooiveld G, Tremaroli V, Bäckhed F, Kleerebezem M. The gut microbiota and mucosal homeostasis: colonized at birth or at adulthood, does it matter? Gut Microbes. 2013;4:118–124. - PMC - PubMed
    1. Martin AM, Sun EW, Rogers GB, Keating DJ. The Influence Of The Gut Microbiome On Host Metabolism Through The Regulation Of Gut Hormone Release. Front. Physiol. 2019;10:428. - PMC - PubMed
    1. Zhang P, et al. Commensal homeostasis of gut microbiota-host for the impact of obesity. Front. Physiol. 2017;8:1122. - PMC - PubMed
    1. Stefan KL, Kim MV, Iwasaki A, Kasper DL. Commensal microbiota modulation of natural resistance to virus infection. Cell. 2020;183:1312–1324.e10. - PMC - PubMed
    1. Fischbach MA. Microbiome: focus on causation and mechanism. Cell. 2018;174:785–790. - PMC - PubMed

Publication types