. 2023 Sep 14;14(1):5683.
doi: 10.1038/s41467-023-41473-6.

Stromal heterogeneity may explain increased incidence of metaplastic breast cancer in women of African descent

Affiliations

Stromal heterogeneity may explain increased incidence of metaplastic breast cancer in women of African descent

Brijesh Kumar et al. Nat Commun. .

Abstract

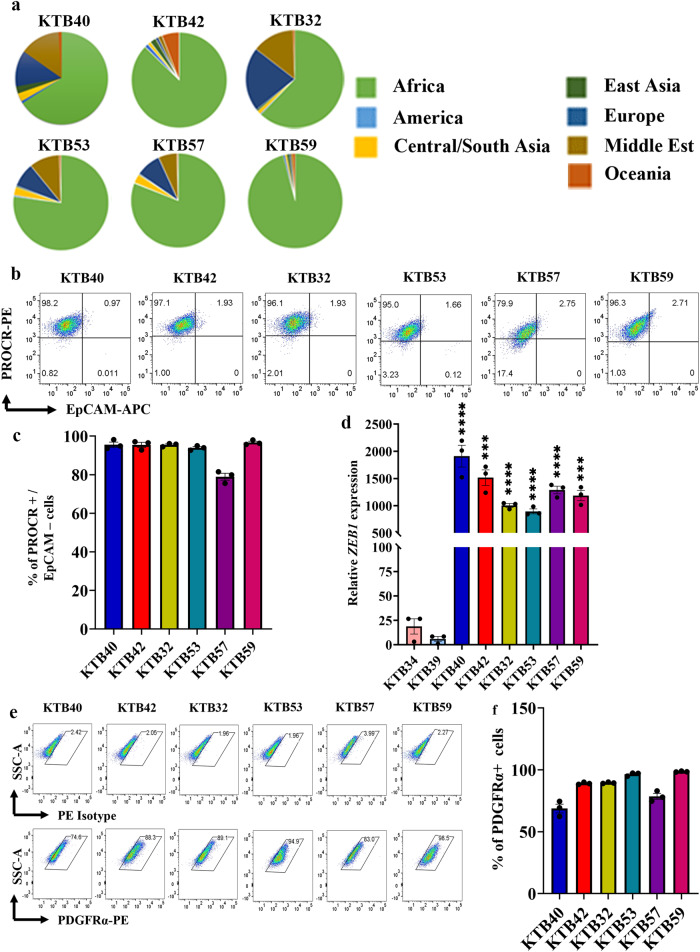
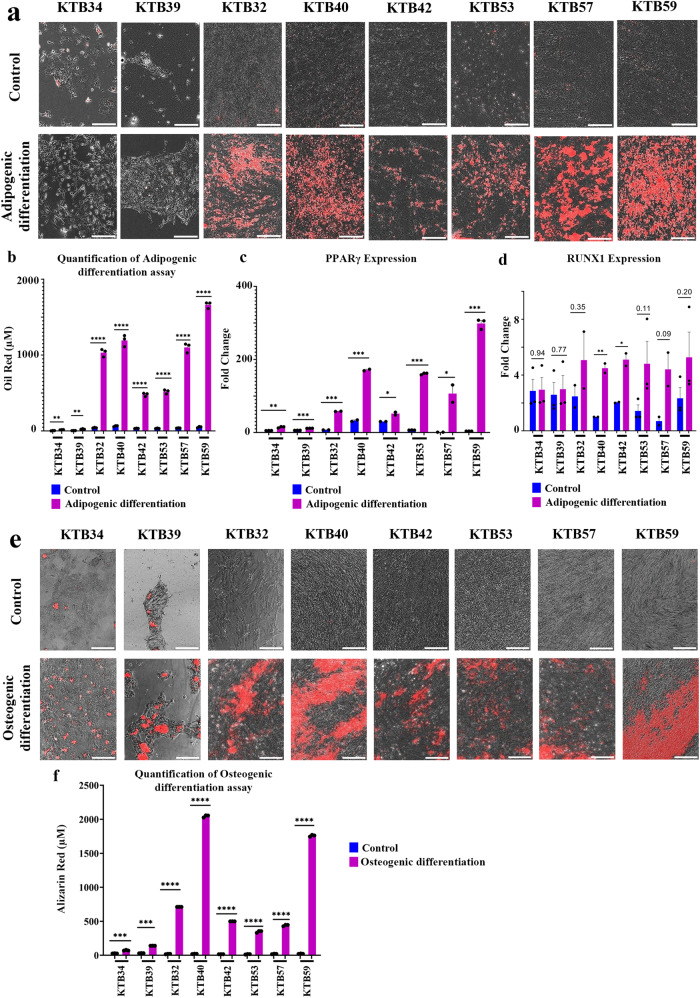
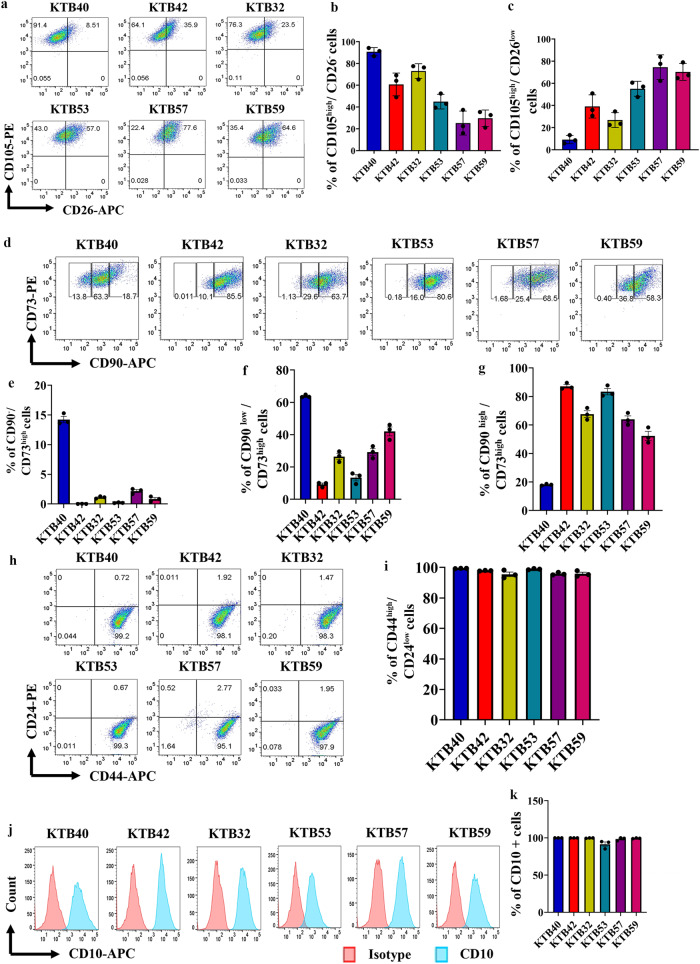
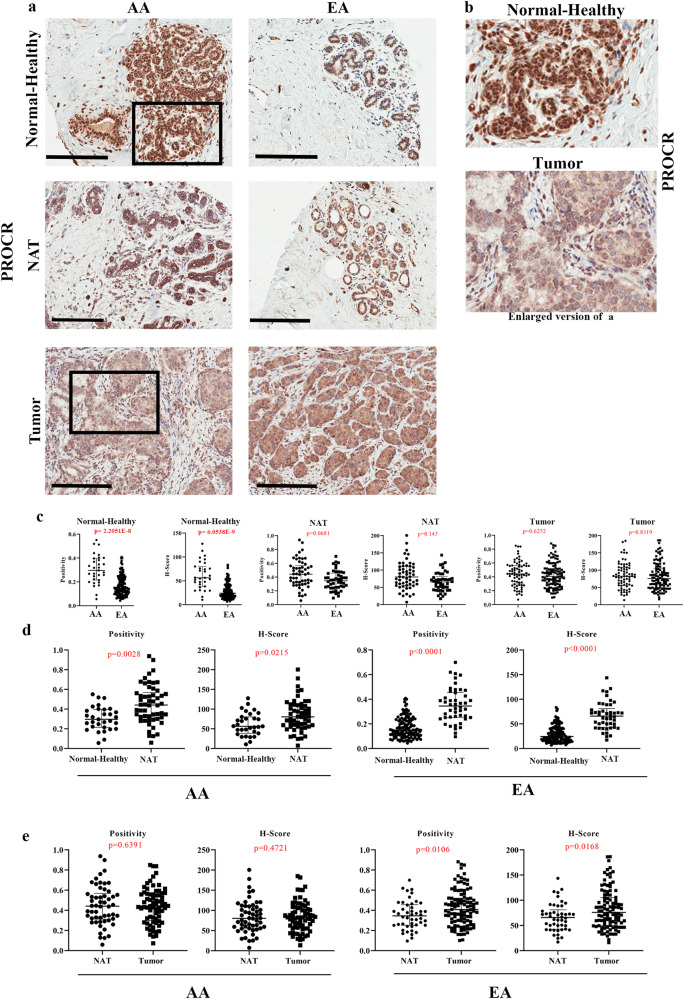
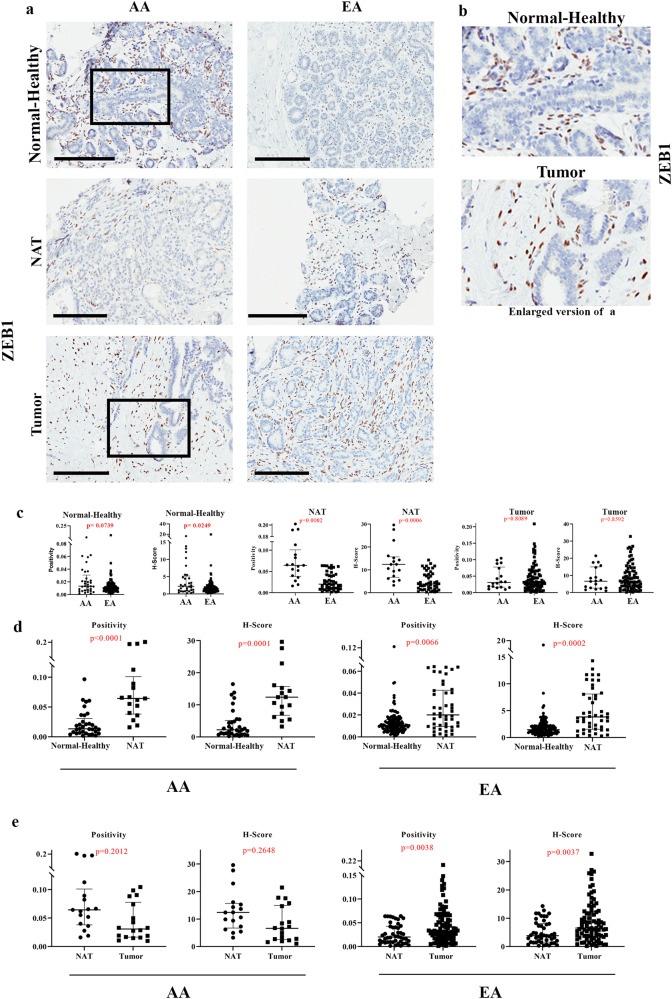
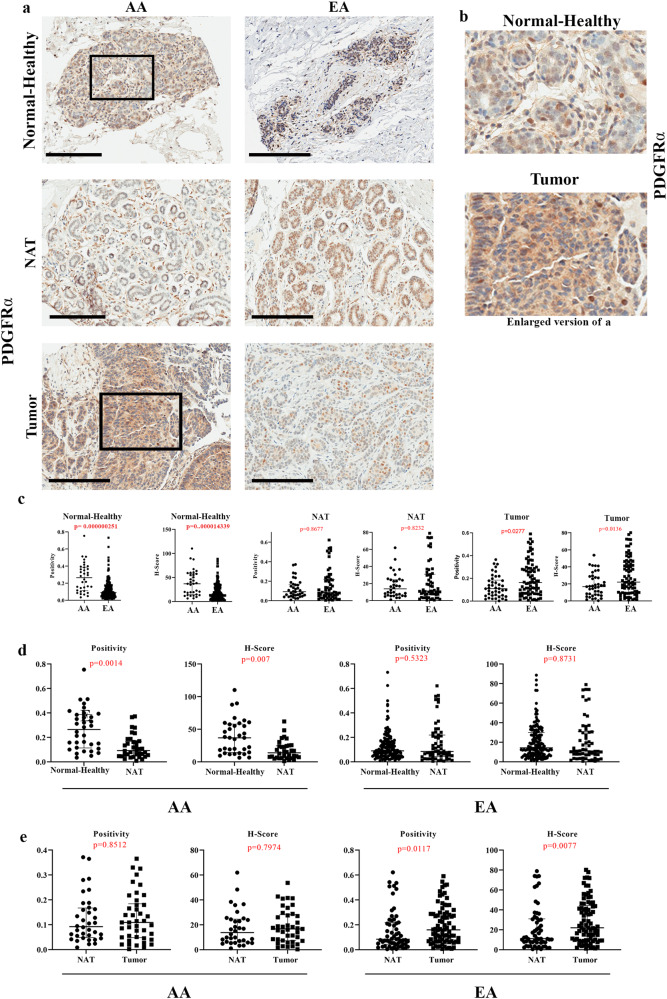
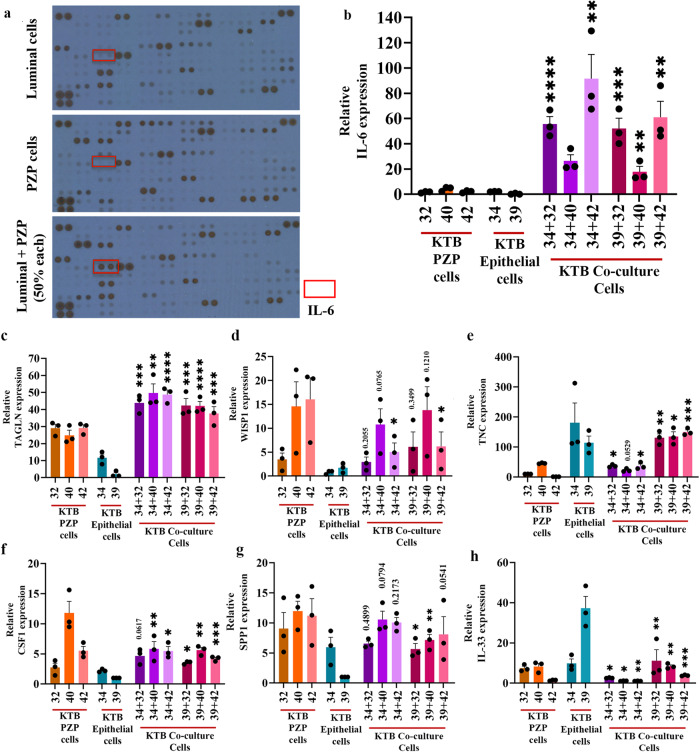
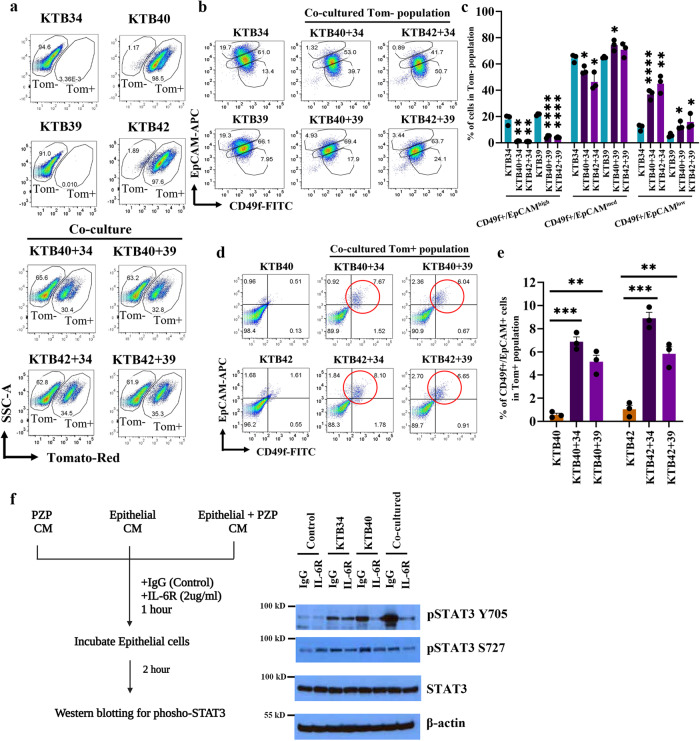
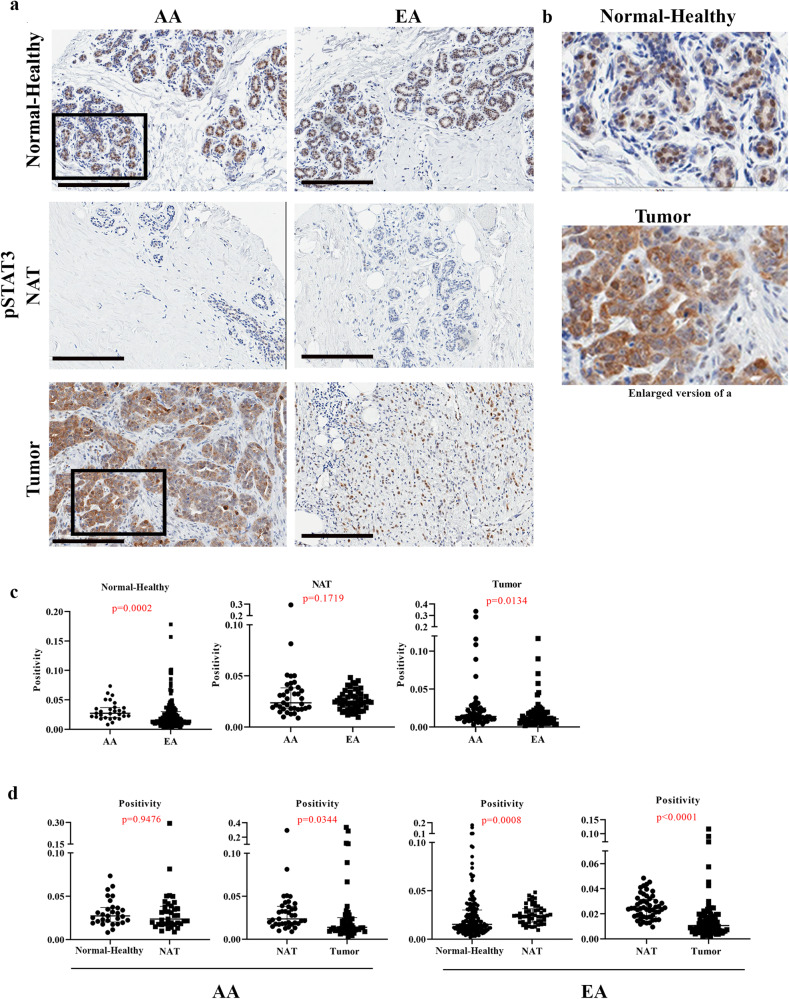
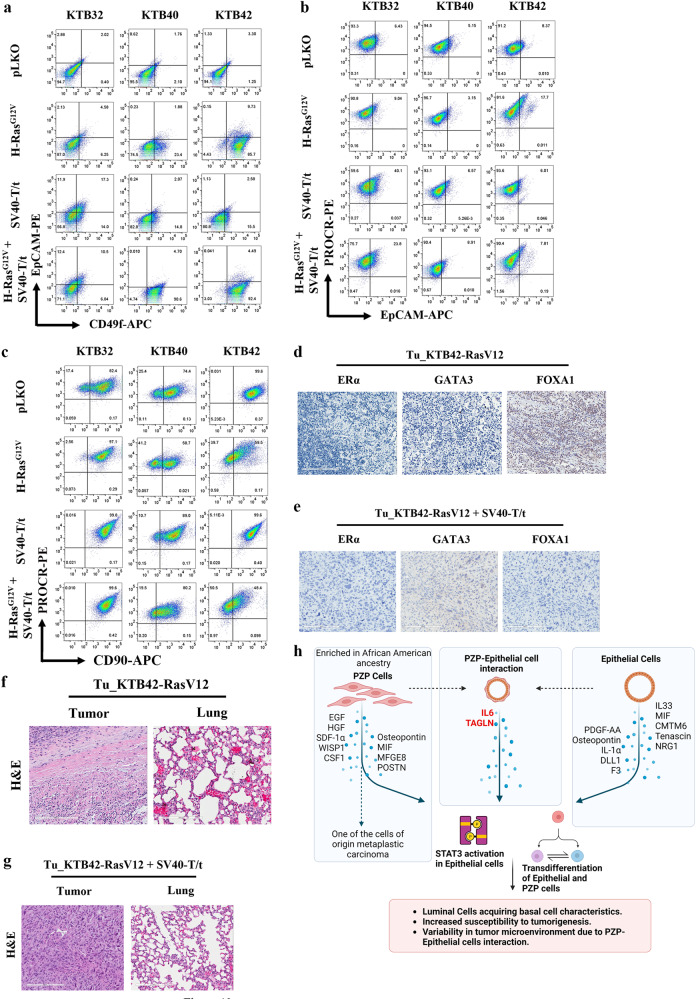
The biologic basis of genetic ancestry-dependent variability in disease incidence and outcome is just beginning to be explored. We recently reported enrichment of a population of ZEB1-expressing cells located adjacent to ductal epithelial cells in normal breasts of women of African ancestry compared to those of European ancestry. In this study, we demonstrate that these cells have properties of fibroadipogenic/mesenchymal stromal cells that express PROCR and PDGFRα and transdifferentiate into adipogenic and osteogenic lineages. PROCR + /ZEB1 + /PDGFRα+ (PZP) cells are enriched in normal breast tissues of women of African compared to European ancestry. PZP: epithelial cell communication results in luminal epithelial cells acquiring basal cell characteristics and IL-6-dependent increase in STAT3 phosphorylation. Furthermore, level of phospho-STAT3 is higher in normal and cancerous breast tissues of women of African ancestry. PZP cells transformed with HRasG12V ± SV40-T/t antigens generate metaplastic carcinoma suggesting that these cells are one of the cells-of-origin of metaplastic breast cancers.


Conflict of interest statement

The authors declare no competing interests.

Figures

Fig. 1
Fig. 1. Establishment of PROCR+/ZEB1+/PDGFRα+ (PZP) cell lines from the Normal-Healthy breast tissues of women of African ancestry.
a Genetic ancestry mapping of breast tissue donors (KTB40, KTB42, KTB32, KTB53, KTB57, and KTB59) using a panel of 41-SNP. b PROCR+/EpCAM cells are enriched in established cell lines from women of African ancestry (n = 3). Isotype controls are shown in Fig. S1d. c Quantitation of PROCR+/EpCAM cells (n = 3). d ZEB1 expression levels in various PROCR+/EpCAM cell lines compared to EpCAM+ (KTB34 and KTB39) luminal cell lines (n = 3). KTB40*p < 0.0001, KTB42*p = 0.0002, KTB32*p < 0.0001, KTB53*p < 0.0001, KTB57*p < 0.0001, KTB59*p = 0.0003. e PROCR+/ZEB1+ cell lines express PDGFRα as determined by flow cytometry (n = 3). f Quantitation of PDGFRα+ cells (n = 3). ***p < 0.001, ****p < 0.0001 by one-way ANOVA. All the data points are shown as mean ± SEM. Source data are provided as a Source Data file.
Fig. 2
Fig. 2. Trans-differentiating properties of PZP cells.
a PZP cells undergo adipogenic differentiation under appropriate growth condition. Neural lipids stain red upon Oil Red-O staining (n = 3). Epithelial cell lines did not undergo adipogenic differentiation. b Quantification of lipid levels in control and differentiated PZP adipocytes (n = 3). (KTB34*p = 0.0021, KTB39*p = 0.0023, KTB32*p < 0.0001, KTB40*p < 0.0001, KTB42*p < 0.0001, KTB53*p < 0.0001, KTB57*p < 0.0001, KTB59*p < 0.0001.) c Adipogenic differentiated PZP cells show elevated level of adipocyte differentiation marker PPARγ (n = 3). (KTB34*p = 0.0012, KTB39*p < 0.0001, KTB32*p < 0.0001, KTB40*p = 0.0004, KTB42*p = 0.0311, KTB53*p < 0.0001, KTB57*p = 0.0472, KTB59*p < 0.0001.) d Adipogenic differentiation of PZP cells was confirmed through RUNX1 overexpression (n = 3). (KTB40*p = 0.0093, KTB42*p = 0.0209.) e PZP cells undergo osteogenic differentiation under appropriate growth condition. Mineralization of matrix with Ca2+ was visualized by alizarin red staining (n = 3). f Quantification of alizarin red staining in control and differentiated PZP osteocytes (n = 3). (KTB34*p = 0.0003, KTB39*p < 0.0001, KTB32*p < 0.0001, KTB40*p < 0.0001, KTB42*p < 0.0001, KTB53*p < 0.0001, KTB57*p < 0.0001, KTB59*p < 0.0001.) *p < 0.05, **p < 0.01, ***p < 0.001, ****p < 0.0001. The data was analyzed using a two-tailed t-test. All the data points are shown as mean ± SEM. Source data are provided as a Source Data file.
Fig. 3
Fig. 3. Phenotypic characterization of PZP cells.
a PZP cell lines were stained with CD105 and CD26 antibodies to identify the lobular and interlobular origin of PZP cells (n = 3). Isotype controls are shown in Fig. S2a and e. b and c Quantification of CD105high/CD26 and CD105high/CD26low population of cells (n = 3). d PZP cell lines were stained with CD90 and CD73 antibodies to identify rare endogenous pluripotent somatic stem cells and potential mesenchymal stem cells (n = 3). Isotype controls are shown in Fig. S2. eg Quantification of CD90–−/CD73high, CD90low/CD73high, and CD90high/CD73high population of cells (n = 3). h PZP cell lines were stained with CD44 and CD24 antibodies to determine whether their phenotype overlaps with cancer stem cells (n = 3). Isotype controls are shown in Fig. S2. i Quantification of CD44high/CD24low population (n = 3). j PZP cell lines were stained with CD10 antibody to determine overlap with myoepithelial cell marker expression (n = 3). k Quantification of CD10+ population (n = 3). All the data points are shown as mean ± SEM. Source data are provided as a Source Data file.
Fig. 4
Fig. 4. PROCR expression pattern in Normal-Healthy, NATs, and breast tumors.
a Representative IHC of PROCR in Normal-Healthy, NATs, and/or tumors of women of AA and EA. b Enlarged view of PROCR expression in Normal-Healthy and tumor. c Differences in PROCR expression (positivity and H-score) between Normal-Healthy tissues of women of AA and EA. Differences in PROCR expression (positivity *p = 2.2051E−8 and H-score *p = 6.0538E−9) between Normal-Healthy tissues of AA and EA. The statistical test that was utilized to analyze the data was two-sided Wilcoxon Test. d Differences in PROCR expression (positivity and H-score) between Normal-Healthy and NATs of women of AA and EA (positivity *p = 4.588E−11 and H-score *p = 1.4572E−11). The data were analyzed using two-sided Wilcoxon test. e Differences in PROCR expression (positivity and H-score) between NATs and tumors of women of AA and EA. Data were analyzed using two-sided Wilcoxon test. (Normal-Healthy-AA (n = 31), and EA (n = 129); NAT -AA (n = 35) and EA (n = 31); Tumor -AA (n = 41) and EA (n = 62)). Depending on availability, two cores of same NAT and tumor were included in the TMA. Dot blots in this and subsequent relevant figures include values from both cores of the same sample. All the data points are shown as mean ± SD. Source data are provided as a Source Data file.
Fig. 5
Fig. 5. ZEB1 expression pattern in Normal-Healthy, NATs, and breast tumors.
a Representative IHC of ZEB1 in Normal-Healthy, NATs, and/or tumors of women of AA and EA. b Enlarged view of ZEB1 expression in Normal-Healthy and tumor. Note ZEB1+ cells surround epithelial cell clusters. c Differences in ZEB1 expression (positivity and H-score) between Normal-Healthy tissues of women of AA and EA. Differences in ZEB1 expression (positivity and H-score) among Normal-Healthy women of AA and EA analyzed using two-sided Wilcoxon test. d Differences in ZEB1 expression (positivity and H-score) between Normal-Healthy and NATs of women of AA (positivity *p = 0.000058998 and H-score *p = 0.000112101) and EA. The data were analyzed using two-sided Wilcoxon test. e Differences in ZEB1 expression (positivity and H-score) between NATs and tumors of women of AA and EA analyzed using two-sided Wilcoxon test. (Normal-Healthy-AA (n = 33), EA (n = 144); NAT -AA (n = 12) and EA (n = 31); Tumor -AA (n = 13) and EA (n = 53)). All the data points are shown as mean ± SD. Source data are provided as a Source Data file.
Fig. 6
Fig. 6. PDGFRα expression pattern in Normal-Healthy, NATs, and breast tumors.
a Representative IHC of PDGFRα in Normal-Healthy, NATs, and/or tumors of women of AA and EA. b Enlarged view of PDGFRα expression in Normal-Healthy and tumor. c Differences in PDGFRα expression (positivity and H-score) between Normal-Healthy tissues of women of AA and EA analyzed using two-sided Wilcoxon test (positivity *p = 0.000000251 and H-score *p = 0.000014339). d Differences in PDGFRα expression (positivity and H-score) between Normal-Healthy and NATs of women of AA and EA analyzed using two-sided Wilcoxon test. e Differences in PDGFRα expression (positivity and H-score) between NATs and tumors of women of AA and EA. The data were analyzed using two-sided Wilcoxon test. (Normal-Healthy-AA (n = 35), EA (n = 154),; NAT -AA (n = 24) and EA (n = 42); Tumor -AA (n = 29) and EA (n = 52).) All the data points are shown as mean ± SD. Source data are provided as a Source Data file.
Fig. 7
Fig. 7. PZP-Epithelial cells interaction alters gene expression.
a IL-6 expression was detected only when luminal and PZP cells were co-cultured. R&D systems cytokine/chemokine array was used to identify secreted factors by epithelial and PZP cells either alone or together (50% each). Expression of genes in PZP (KTB32, KTB40, KTB42), epithelial (KTB34, KTB39), and co-culture of PZP and epithelial cell lines. b IL-6 (n = 3), KTB34 + 32*p < 0.0001, KTB34 + 40*p = 0.0018; KTB34 + 42*p = 0.0018; KTB39 + 32*p = 0.0003; KTB39 + 40*p = 0.007; KTB39 + 42*p = 0.0016. c TAGLN (n = 3), KTB34 + 32*p = 0.0004; KTB34 + 40*p = 0.0011; KTB34 + 42*p < 0.0001; KTB39 + 32*p = 0.0001; KTB39 + 40*p < 0.0001; KTB39 + 42*p = 0.0002. d WISP1 (n = 3), KTB34 + 42*p = 0.0218; KTB39 + 42*p = 0.0456. e TNC (n = 3), KTB34 + 32*p = 0.0401; KTB34 + 42*p = 0.0353; KTB39 + 32*p = 0.0023; KTB39 + 40*p = 0.0158; KTB39 + 42*p = 0.0005. f CSF1 (n = 3), KTB34 + 40*p = 0.0059; KTB34 + 42*p = 0.0112; KTB39 + 32*p = 0.0135; KTB39 + 40*p = 0.0016; KTB39 + 42*p = 0.0008. g SPP1 (n = 3), KTB39 + 32*p = 0.0348; KTB39 + 40*p = 0012. h IL-33 (n = 3), KTB34 + 32*p = 0.0269, KTB34 + 40*p = 0.0164; KTB34 + 42*p = 0.0045; KTB39 + 32*p = 0.0078; KTB39 + 40*p = 0.0017; KTB39 + 42*p = 0.0005. Statistical significance (p values) was determined by comparing KTB32/40/42 (PZP cells), KTB34/KTB39 (epithelial cells) and respective co-cultured PZP + epithelial cells as indicated in the figure. *p < 0.05, **p < 0.01, ***p < 0.001, ****p < 0.0001 by One-way ANOVA. All the data points are shown as mean ± SEM. Source data are provided as a Source Data file.
Fig. 8
Fig. 8. The effects of PZP cells on trans-differentiation of epithelial cell lines.
a Gating of tomato- (Tom-) and tomato+ (Tom+) populations of KTB34, KTB39, and co-cultured KTB40/KTB42 and KTB34/KTB39 cell lines (n = 3). PZP cell lines are Tom+. b CD49f and EpCAM staining patterns of KTB34, KTB39, and co-cultured KTB40/KTB42 and KTB34/KTB39 cell lines (n = 3). Isotype controls are shown in Fig. S10b. c Quantification of CD49f+/EpCAMhigh, (KTB40 + 34*p = 0.002; KTB42 + 34*p = 0.0019; KTB40 + 39*p < 0.0001; KTB42 + 39*p < 0.0001), CD49f+/EpCAMmed (KTB40 + 34*p = 0.0186; KTB42 + 34*p = 0.0124; KTB40 + 39*p = 0.0183), and CD49f+/EpCAMlow (KTB40 + 34*p= 0.0006; KTB42 + 34*p = 0.0012; KTB40 + 39*p = 0.0185; KTB42 + 39*p = 0.0414) populations in Tom− cell population (n = 3). d CD49f and EpCAM staining patterns of KTB40, KTB42, and co-cultured KTB40/KTB42 and KTB34/KTB39 cell lines. Only Tom+ population was analyzed (n = 3). e Quantification of CD49f+/EpCAM+ population among Tom+ population (n = 3). (KTB40 + 34*p < 0.0001; KTB40 + 39*p = 0.0015; KTB42 + 34*p = 0.0002; KTB42 + 39*p = 0.0024) (f) pSTAT3 Y705, pSTAT3 S727, and STAT3 expression levels in KTB34 cells treated with CM obtained from KTB34, KTB40, and co-cultured KTB34 and KTB40 cells followed by IgG control and IL-6R neutralizing antibody treatment (n = 3). CM was treated with IgG or IL-6R neutralizing antibodies for 1 h and CM treatment lasted for 2 h. β–actin was used as an internal control (n = 3). In this representative experiment, the same batch of extracts was used to run four blots and each blot was probed with indicated antibodies separately. Statistical significance derived (*p < 0.05, **p < 0.01, ***p < 0.001, ****p < 0.0001) using Two-tailed t-test. All the data points are shown as mean ± SEM. Source data are provided as a Source Data file.
Fig. 9
Fig. 9. Phospho-STAT3 levels in Normal-Healthy, NATs, and breast tumors.
a Representative IHC of pSTAT3 in Normal-Healthy, NATs, and/or tumors of women of AA and EA. b Enlarged view of pSTAT3 expression in Normal-Healthy and tumor. c Differences in pSTAT3 positivity between Normal-Healthy, NATs and tumors of women of AA and EA. d Differences in pSTAT3 positivity between Normal-Healthy and NATs and between NATs and tumors of women of AA and EA analyzed using two-sided Wilcoxon test. (Normal-Healthy, AA = 23, EA = 164); NAT -AA (n = 24), EA (n = 31); Tumor -AA (n = 32), EA (n = 41).) All the data points are shown as mean ± SD. Source data are provided as a Source Data file.
Fig. 10
Fig. 10. PZP cells transformed with Ras and SV40-T/t antigens are tumorigenic.
a CD49f and EpCAM staining patterns of immortalized and transformed PZP (KTB32, KTB40 and KTB42) cell lines. CD49f+/EpCAM, CD49f+/EpCAM+ and CD49f /EpCAM+ cells correspond to stem/basal, progenitor and differentiated cells, respectively (n = 3). b PROCR and EpCAM staining patterns of immortalized and transformed PZP (KTB32, KTB40, and KTB42) cell lines (n = 3). c CD90 and PROCR staining patterns of immortalized and transformed PZP (KTB32, KTB40, and KTB42) cell lines (n = 3). d IHC analyses of luminal markers ERα, GATA3 and FOXA1 in tumors developed from KTB42-HRasG12V transformed cells (n = 5). e IHC analyses of luminal markers ERα, GATA3 and FOXA1 in tumors developed from the KTB42-HRasG12V + SV40-T/t antigen transformed cells (n = 5). f Tumor developed from KTB42-HRasG12V transformed cells did not show lung metastasis (n = 5). g Tumor developed from KTB42-HRasG12V + SV40-T/t antigen transformed cells did not show lung metastasis (n = 5). H&E staining shows the type of tumors. h Schematic view of study findings.

Similar articles

Cited by

References

    1. Newman LA, et al. Meta-analysis of survival in African American and white American patients with breast cancer: ethnicity compared with socioeconomic status. J. Clin. Oncol. 2006;24:1342–1349. doi: 10.1200/JCO.2005.03.3472. - DOI - PubMed
    1. Paik S, et al. A multigene assay to predict recurrence of tamoxifen-treated, node-negative breast cancer. N. Engl. J. Med. 2004;351:2817–2826. doi: 10.1056/NEJMoa041588. - DOI - PubMed
    1. Albain KS, et al. Race, Ethnicity, and Clinical Outcomes in Hormone Receptor-Positive, HER2-Negative, Node-Negative Breast Cancer in the Randomized TAILORx Trial. J. Natl. Cancer Inst. 2021;113:390–399. doi: 10.1093/jnci/djaa148. - DOI - PMC - PubMed
    1. Narod SA, Iqbal J, Giannakeas V, Sopik V, Sun P. Breast Cancer Mortality After a Diagnosis of Ductal Carcinoma In Situ. JAMA Oncol. 2015;1:888–896. doi: 10.1001/jamaoncol.2015.2510. - DOI - PubMed
    1. Zhao F, et al. Racial Disparities in Pathological Complete Response Among Patients Receiving Neoadjuvant Chemotherapy for Early-Stage Breast Cancer. JAMA Netw. Open. 2023;6:e233329. doi: 10.1001/jamanetworkopen.2023.3329. - DOI - PMC - PubMed

Publication types

Substances