. 2023 Sep 15;8(1):351.
doi: 10.1038/s41392-023-01575-5.

MDIG-mediated H3K9me3 demethylation upregulates Myc by activating OTX2 and facilitates liver regeneration

Affiliations

MDIG-mediated H3K9me3 demethylation upregulates Myc by activating OTX2 and facilitates liver regeneration

Jinpeng Du et al. Signal Transduct Target Ther. .

Abstract

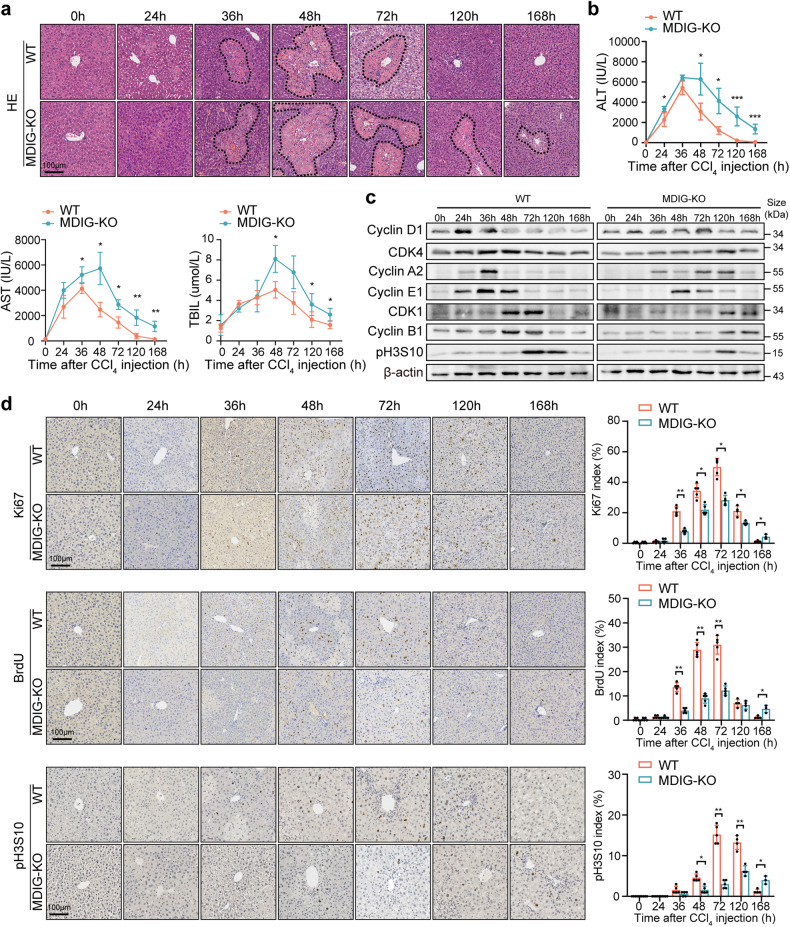
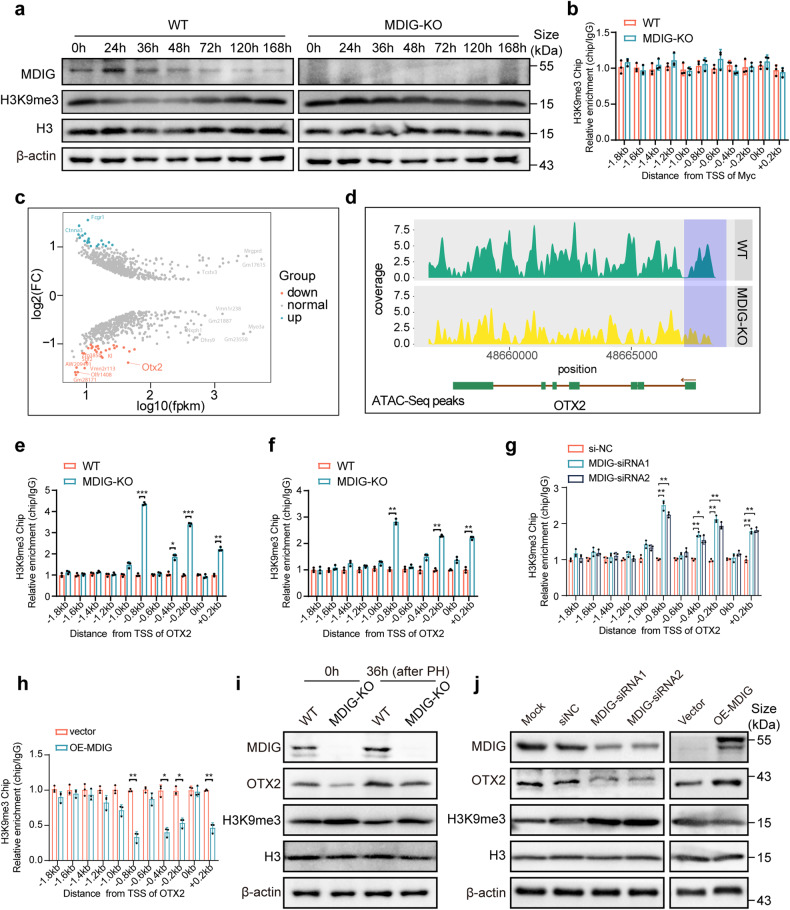
The mineral dust-induced gene (MDIG) comprises a conserved JmjC domain and has the ability to demethylate histone H3 lysine 9 trimethylation (H3K9me3). Previous studies have indicated the significance of MDIG in promoting cell proliferation by modulating cell-cycle transition. However, its involvement in liver regeneration has not been extensively investigated. In this study, we generated mice with liver-specific knockout of MDIG and applied partial hepatectomy or carbon tetrachloride mouse models to investigate the biological contribution of MDIG in liver regeneration. The MDIG levels showed initial upregulation followed by downregulation as the recovery progressed. Genetic MDIG deficiency resulted in dramatically impaired liver regeneration and delayed cell cycle progression. However, the MDIG-deleted liver was eventually restored over a long latency. RNA-seq analysis revealed Myc as a crucial effector downstream of MDIG. However, ATAC-seq identified the reduced chromatin accessibility of OTX2 locus in MDIG-ablated regenerating liver, with unaltered chromatin accessibility of Myc locus. Mechanistically, MDIG altered chromatin accessibility to allow transcription by demethylating H3K9me3 at the OTX2 promoter region. As a consequence, the transcription factor OTX2 binding at the Myc promoter region was decreased in MDIG-deficient hepatocytes, which in turn repressed Myc expression. Reciprocally, Myc enhanced MDIG expression by regulating MDIG promoter activity, forming a positive feedback loop to sustain hepatocyte proliferation. Altogether, our results prove the essential role of MDIG in facilitating liver regeneration via regulating histone methylation to alter chromatin accessibility and provide valuable insights into the epi-transcriptomic regulation during liver regeneration.


Conflict of interest statement

The authors declare no competing interests.

Figures

Fig. 1
Fig. 1
MDIG depletion impairs liver regeneration following 70% PH. a The ratios of liver weight/body weight at different time points after PH. b Immunohistochemistry results for Ki67, BrdU, and pH3S10 at different times following PH. c Western blot analysis of cell cycle markers at different times after PH in WT and MDIG-KO mice. Data were shown as mean ± SD, n = 4–6, unpaired Student’s t-test, *P < 0.05; **P < 0.01; ***P < 0.001. Scale bars, 100 μm
Fig. 2
Fig. 2
MDIG depletion impairs liver repair following the CCl4 challenge. a H&E staining showed liver repair was dramatically impaired in MDIG-KO liver. Necrotic areas were circled with dotted lines. b Serum ALT, AST, and TBIL levels at the indicated time points after the CCl4 challenge. c Western blot analysis of cell cycle markers at different times following the CCl4 challenge. d Immunohistochemistry results for Ki67, BrdU, and pH3S10 at different times following CCl4 challenge. Data were shown as mean ± SD, n = 3–5, unpaired Student’s t-test, *P < 0.05; **P < 0.01; ***P < 0.001. Scale bars, 100 μm
Fig. 3
Fig. 3
Loss of MDIG impairs liver regeneration by suppressing Myc expression. a A heat map of 1892 differentially expressed genes in WT and mutant livers at 36 h after PH. b KEGG pathway analysis of the primary altered genes indicated that the cell cycle pathway was significantly enriched during liver regeneration in the WT and MDIG-KO mice after 36 h PH. c Heat map of cell cycle-related genes from RNA-seq analysis of WT and MDIG-KO mice. The color bar showed the expression intensity. d Western blot for the indicated proteins in liver tissue lysates prepared from WT and MDIG-KO mice at 0 and 36 h after PH. e Western blot for the protein expression of Myc after MDIG knockdown or overexpression in Hepa1-6 and AML12 cells. f CCK8 assays revealed cell proliferation capacity after silencing Myc in MDIG-overexpressing Hepa1-6 and AML12 cells. g Colony formation assays (left) and EdU immunofluorescence assays (right) revealed cell proliferation capacity after silencing Myc in MDIG-overexpressing Hepa1-6 cells. h Western blot analysis showing the expression of MDIG and Myc after overexpressing Myc in MDIG-silencing Hepa1-6 cells. i CCK8 assays revealed cell proliferation capacity after overexpressing Myc in MDIG-silencing Hepa1-6 cells. j Colony formation assays revealed colony formation capacity after overexpressing Myc in MDIG-silencing Hepa1-6 cells. Data were shown as mean ± SD, unpaired Student’s t-test, *P < 0.05; **P < 0.01; ***P < 0.001
Fig. 4
Fig. 4
MDIG ablation reduces chromatin accessibility for OTX2 by increasing the H3K9 methylation of its promoter. a Western blot for the indicated protein expression in liver tissue lysates prepared from WT and MDIG-KO mice at different times after PH. b ChIP-qPCR was conducted to evaluate the enrichment of H3K9me3 in different promoter regions of Myc in liver tissue lysates prepared from WT and MDIG-KO mice at 36 h after PH. c Differential ATAC-seq peak analysis between the WT and MDIG-KO mice at 36 h after PH defined 1114 significantly enriched peaks corresponded to 1008 genes. d Genome browser view showing ATAC-seq signal around the OTX2 loci. The blue shadow represented the OTX2 promoter-open peak that was correlated with the OTX2 expression. e, f ChIP-qPCR was conducted to evaluate the enrichment of H3K9me3 in different promoter regions of OTX2 in liver tissue lysates prepared from WT and MDIG-KO mice at 36 h after PH (e) and CCl4 challenge (f). g, h ChIP-qPCR was conducted to evaluate the enrichment of H3K9me3 in different promoter regions of OTX2 in AML12 cells after silencing (g) or overexpressing (h) MDIG. i Western blot for the indicated protein expression in liver tissue lysates prepared from WT and MDIG-KO mice at 0 h and 36 h after PH. j Western blot for indicated protein expression after MDIG knockdown or overexpression in AML12 cells. Data were shown as mean ± SD, unpaired Student’s t-test, *P < 0.05; **P < 0.01; ***P < 0.001
Fig. 5
Fig. 5
OTX2 promotes cell proliferation by enhancing Myc expression. a Western blot analysis showing the expression of OTX2 and Myc after silencing or overexpressing OTX2 in AML12 and Hepa1-6 cells. b Top, the schematic indicated the sequence logo of OTX2 potential binding site in JASPAR software. Bottom, wildtype (wt) and deleted mutation (del) recognition sites of OTX2 in the Myc promoter region; PWT, wild-type OTX2 recognition site; Pdel1, deleted OTX2 recognition site 1; Pdel2, deleted OTX2 recognition site 2; Pdel3, deleted OTX2 recognition site 1 and site 2. c The relative activities of the Myc promoter and the deleted promoter after transfection of OTX2 and Vector. d ChIP-qPCR assays with anti-OTX2 or negative control (anti-IgG) antibodies showed OTX2 binding to the recognition site 2 of Myc promoter in AML12 and Hepa1-6 cells. ChIP enrichments were normalized to the input signal. e ChIP-qPCR assays to analyze OTX2 occupancy at Myc promoter in liver tissue lysates prepared from WT and MDIG-KO mice at 36 h after PH or CCl4 challenge. f Western blot analysis showing the expression of OTX2 and Myc after silencing Myc in AML12 and Hepa1-6 cells overexpressing OTX2. g CCK8 assays revealed cell proliferation capacity after silencing Myc in OTX2-overexpressing AML12 and Hepa1-6 cells. h Colony formation assays (left) and EdU immunofluorescence assays (right) revealed cell proliferation capacity after silencing Myc in OTX2-overexpressing Hepa1-6 cells. i Western blot analysis showing the expression of OTX2 and Myc after overexpressing Myc in OTX2-silencing Hepa1-6 cells. j CCK8 assays revealed cell proliferation capacity after overexpressing Myc in OTX2-silencing Hepa1-6 cells. Data were shown as mean ± SD, unpaired Student’s t-test, *P < 0.05; **P < 0.01; ***P < 0.001
Fig. 6
Fig. 6
MDIG promotes Myc expression by upregulation of OTX2. a Western blot for the indicated protein expression after MDIG knockdown or overexpression in Hepa1-6 cells. b Western blot analysis for the indicated protein expression after silencing OTX2 in MDIG-overexpressing AML12 and Hepa1-6 cells. C CCK8 assays revealed cell proliferation capacity after silencing OTX2 in MDIG-overexpressing AML12 and Hepa1-6 cells. d Colony formation assays and e EdU immunofluorescence assays revealed cell proliferation capacity after silencing OTX2 in MDIG-overexpressing Hepa1-6 cells. f Western blot for the indicated protein expression after overexpressing OTX2 in MDIG-silencing Hepa1-6 cells. g CCK8 assays revealed cell proliferation capacity after overexpressing OTX2 in MDIG-silencing Hepa1-6 cells. h Colony formation assays revealed colony formation capacity after overexpressing OTX2 in MDIG-silencing Hepa1-6 cells. i EdU immunofluorescence assays revealed cell proliferation capacity after overexpressing OTX2 in MDIG-silencing Hepa1-6 cells. Data were shown as mean ± SD, unpaired Student’s t-test, *P < 0.05; **P < 0.01; ***P < 0.001
Fig. 7
Fig. 7
MDIG contributes to liver regeneration through the Myc-MDIG-positive feedback loop. a Top, the schematic indicated the sequence logo of Myc potential binding site in JASPAR software. Bottom, schematic outlined of the putative binding of Myc to MDIG gene promoter region. b ChIP-qPCR assays with anti-Myc or negative control (anti-IgG) antibodies showed Myc binding to the recognition sites 2 and 4 of MDIG promoter in Hepa1-6 cells. ChIP enrichments were normalized to the input signal. c Western blot analysis showing the expression of Myc and MDIG after silencing or overexpressing Myc in Hepa1-6 cells. d ChIP-qPCR assays with an anti-Myc or negative control (anti-IgG) antibodies showed increased occupancy of Myc at the recognition sites 2 and 4 of MDIG promoter at 48 h after PH. ChIP enrichments were normalized to the signal from 0 h samples. e Western blot for the indicated protein expression after overexpressing Myc in MDIG-silencing AML12 cells. f CCK8 assays revealed cell proliferation capacity after overexpressing Myc in MDIG-silencing AML12 cells. g A proposed model illustrating promoted effects of MDIG on liver regeneration (This graphic figure was created in BioRender.com). Data were shown as mean ± SD, unpaired Student’s t-test, ***P < 0.001

References

    1. Campana L, Esser H, Huch M, Forbes S. Liver regeneration and inflammation: from fundamental science to clinical applications. Nat. Rev. Mol. Cell Biol. 2021;22:608–624. - PubMed
    1. Michalopoulos GK, DeFrances MC. Liver regeneration. Science. 1997;276:60–66. - PubMed
    1. Taub R. Liver regeneration 4: transcriptional control of liver regeneration. FASEB J. 1996;10:413–427. - PubMed
    1. Apte U, et al. Enhanced liver regeneration following changes induced by hepatocyte-specific genetic ablation of integrin-linked kinase. Hepatology. 2009;50:844–851. - PMC - PubMed
    1. Lim C, et al. Tumour progression and liver regeneration–insights from animal models. Nat. Rev. Gastroenterol. Hepatol. 2013;10:452–462. - PubMed

Publication types