. 2023 Sep 14;14(1):5675.
doi: 10.1038/s41467-023-41482-5.

Time space and single-cell resolved tissue lineage trajectories and laterality of body plan at gastrulation

Affiliations

Time space and single-cell resolved tissue lineage trajectories and laterality of body plan at gastrulation

Ran Wang et al. Nat Commun. .

Abstract

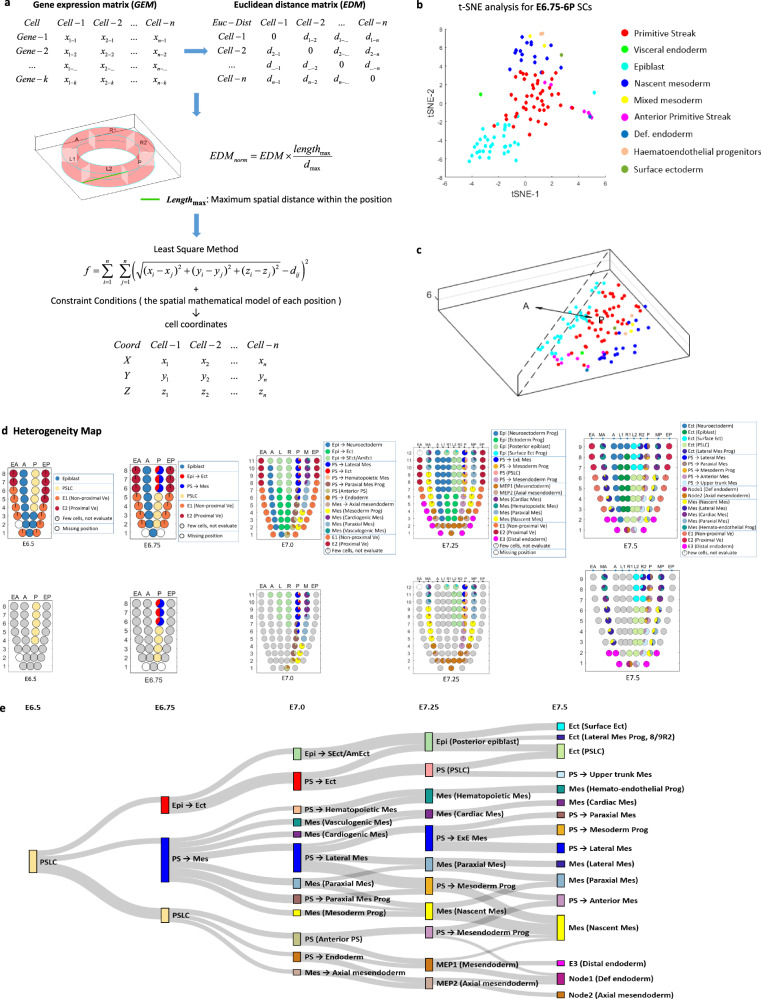
Understanding of the molecular drivers of lineage diversification and tissue patterning during primary germ layer development requires in-depth knowledge of the dynamic molecular trajectories of cell lineages across a series of developmental stages of gastrulation. Through computational modeling, we constructed at single-cell resolution, a spatio-temporal transcriptome of cell populations in the germ-layers of gastrula-stage mouse embryos. This molecular atlas enables the inference of molecular network activity underpinning the specification and differentiation of the germ-layer tissue lineages. Heterogeneity analysis of cellular composition at defined positions in the epiblast revealed progressive diversification of cell types. The single-cell transcriptome revealed an enhanced BMP signaling activity in the right-side mesoderm of late-gastrulation embryo. Perturbation of asymmetric BMP signaling activity at late gastrulation led to randomization of left-right molecular asymmetry in the lateral mesoderm of early-somite-stage embryo. These findings indicate the asymmetric BMP activity during gastrulation may be critical for the symmetry breaking process.


Conflict of interest statement

The authors declare no competing interests.

Figures

Fig. 1
Fig. 1. Generation of a spatio-temporal molecular atlas of the germ layers of gastrula-stage mouse embryo.
a Spatial domain of cell populations in the epiblast/ectoderm, mesoderm, and endoderm of E6.5–E7.5 embryos, defined by the position-specific expression of zipcode gene transcripts. Geo-seq sampling positions: epiblast/ectoderm—A, anterior; L, left lateral; R, right lateral; L1/R1, left/right anterior lateral, L2/R2, left/right posterior lateral; M, mesoderm—MA, anterior mesoderm; MP, posterior mesoderm; E, endoderm—EA, anterior endoderm; EP, posterior endoderm. Number: descending series indicating positions in the proximal-distal axis. Germ layer domains: Epi: epiblast, Epi1, 2, 3: epiblast domain 1, 2, and 3; M: mesoderm, M1, M2: mesoderm domain 1 and 2; MEP, putative mesendoderm progenitors; E: endoderm, E1, E2, E3: endoderm domain 1, 2, and 3; PS, primitive streak. b The structure of the Population Tracing algorithm for imputing the developmental connectivity of cell populations across stages of gastrulation (see the detail of mathematical operations in Methods and Supplementary Fig. 2f). c The developmental trajectory of sub-populations within each germ layer tissue domain descending from blastomeres of the preimplantation E2.5 morula stage embryo to the germ layers of E7.5 late-gastrulation stage embryo. d 3D Model of the epiblast/ectoderm displaying the cell populations by imputed positional coordinates (see Methods for details of the mathematical modeling). The exemplar 3D corn plots show the spatiotemporal distribution of the Mixl1-expressing population in the primitive streak; the proximal-distal span of the Mixl1+ domain defines the developmental stage of the gastrulating embryo. The color legend indicates the level of expression determined by the transcript counts. e A flow diagram of the 4-step spatial mapping protocol. (1) Multi-Dimension Single-Cell (MDSC) Mapping allocates single cells to their imputed position. (2) The Annulus Model simulates the Geo-seq positions. Single cells that mapped to a Geo-seq position were distributed uniformly across the interior space of the position in each annulus section. (3) Bubble Sort algorithm displays the cells in relation to the gradient of gene expression level or signaling intensity. (4) The optimization algorithm refines and visualizes the spatial distribution pattern of cell types by optimal coordinates at each Geo-seq position.
Fig. 2
Fig. 2. A single-cell resolution 4D molecular atlas of mouse gastrulation.
a The pipeline of multi-dimension single-cell (MDSC) mapping. The SRCCs of the expression values of the zipcodes of each single cell against all reference samples of the reference embryo were calculated, followed by the application of a spatial smoothing algorithm to impute the high-confidence (closest) location (see “Methods”). The mapping of cells to position 8P was shown as an example. b Verification of the results of MDSC Mapping of single cells isolated from a known position in an E7.0 embryo. The number on each corn indicates the number of cells mapped to the Geo-seq position in the germ layers. PCC values and confidence intervals are shown for the simulation. c Uniform manifold approximation and projection (UMAP) plot showing the data structure of the “Gastrulation Atlas” comprising 32,940 cells from E6.5 to E7.5 embryos, with the exclusion of extraembryonic cells. Twenty-five cell types are annotated (see color legend). Def. endoderm definitive endoderm, PGC primordial germ cells. d Fraction of cell type per time point, displaying a progressive increase in cell-type complexity during gastrulation. e MDSC Mapping results of exemplar cell types for E6.5, E6.75, E7.0, E7.25, and E7.5 embryos. The number in each corn indicates the number of cells mapped to the specific Geo-seq position. f The spatiotemporal distribution of all the single cells identified in the Gastrulation Atlas of E6.5–E7.5 mouse embryos. Cell types are annotated as in (c). g The spatiotemporal distribution of single cells annotated as “nascent mesoderm” in the epiblast and mesoderm of E6.5–E7.5 embryos. h The spatio-temporal distribution of Pou3f1-expressing cells in E6.5–E7.5 embryos. The color legend indicates the level of expression determined by the transcript counts.
Fig. 3
Fig. 3. Mathematical modeling for single-cell spatial distribution and the collation of spatio-temporal heterogeneity map.
a The mathematical model for re-ordering the spatial distribution of the single cells within a Geo-seq position by Euclidean-distance derived optimal coordinates (see Methods). b t-distributed stochastic neighbor embedding (t-SNE) plot showing the single cells mapped to position-6P at E6.75. Cell types are annotated (see legend). c The imputed spatial distribution of single cell types within position-6P at E6.75. Cell types are annotated as in (b). d Heterogeneity Map. Corn plots (top row) show the composition of cell types (shown as a pie chart in each corn) at different Geo-seq positions in the germ layers across the five-time points of gastrulation. Corn plots (bottom row) show the heterogeneity of cell populations descending from the primitive steak-like cells in different Geo-seq positions in the germ layers of the gastrulation stage embryo. e The molecular trajectory of the descendants of primitive streak-like cells of the E6.5 posterior epiblast in the germ layers of E6.75, E7.0, E7.25, and E7.5 embryo, imputed using the Population Tracing algorithm. Cell types are listed in Supplementary Fig. 8. The rectangle represents the spatialized cell type (color indicating the cell types), with the size indicating the propensity of branching trajectory, and the width of the edge indicates the strength of correlation between the connected cell types.
Fig. 4
Fig. 4. Heterogeneity of cell types and developmental trajectories of single cells in the proximal-lateral ectoderm of E7.5 embryo.
af t-SNE plots showing the heterogeneous cell clusters in position-9R2 and -8R2. Cells are annotated by position (a, c, e) and cell type (b, d, f). Dashed arrows (in a, c, e) denote the heterogeneous cell clusters in position-9R2 and -8R2 versus other lateral positions. Panel ad showed the single cells of proximal-lateral ectoderm positions in sections 9 (a, b) and 8 (c, d). Panel e, f showed the single cells of proximal-lateral ectoderm, primitive streak, and mesoderm positions in section 9. g The spatial distribution of single cells in the Annulus Model of ectoderm at Geo-seq section 8/9. hk t-SNE plots (h, j) and the molecular trajectories (i, k) of single cells (imputed using the population tracing algorithm) at position-8R2/9R2 (h, i) and position-8L2/9L2 (j, k) in E7.5–E8.5 embryos. Developmental time points (stage) and cell types (see legend) are indicated in the t-SNE plots. Cell types in E7.75–E8.5 embryos are annotated according to the ‘Gastrulation Atlas’.
Fig. 5
Fig. 5. Left–right asymmetry at the late-gastrulation stage.
a The strategy of laser capture microdissection of cell samples of E7.5 embryos. For the ectoderm and endoderm germ layers, the same Geo-seq strategy was applied as in Supplementary Fig. 1. The mesoderm germ layer was partitioned into MAL (anterior left mesoderm), MAR (anterior right mesoderm), MPL (posterior left mesoderm) and MPR (posterior right mesoderm) areas for sampling. Sampling areas are shown in histology images; scale bar, 60 μm. Three biologically independent sequencing replicates were prepared. b Corn plots showing the spatial pattern of expression of Pou3f1 and Sox7. Hollow circles indicate missing samples. c Heat map showing the differentially expressed genes (DEGs) of the left lateral mesoderm (n = 518) and right lateral mesoderm (n = 881) (one-sided test, p < 0.05, fold change >1.5). The enriched gene ontology (GO) terms for each group were listed on the right (p < 0.01). d The enrichment for target and response genes of development-related signaling pathways in the left and right mesoderm. Signaling activity: red, activating (A); green, inhibitory (I). The significance of −log10(FDR) value in each cell was calculated by one-sided Fisher’s exact test followed by Benjamini–Hochberg correction. e Deconvolution analysis inferred the proportion of left and right lateral mesoderm cell populations and visualized on a t-SNE plot. Cells are colored by inferred positions: MA-L, MP-L, MA-R, and MP-R. f t-SNE plots showing the distribution of Lefty2-expressing cells in the left mesoderm and Hand1- and Smad6-expressing cells in the right mesoderm. g Corn plots showing the distribution of Lefty2-expressing cells in the left mesoderm and Hand1- and Smad6-expressing cells in the right mesoderm. h RNAscope analysis validated the bilaterally asymmetric expression of Lefty2, Hand1, and Smad6 in the selected transverse sections (S-numbered, reference: (g)). The right panels summarize the quantified signal intensity and statistical results, data are presented as mean values ± S.E.M, n = 10 for Lefty2, n = 9 for Hand1, n = 5 for Smad6, n represents biologically independent samples subject to RNAscope analyses. Student’s t-test was performed, *** represents p-value < 0.001, the exact p-values for Lefty2, Hand1, Smad6 group were 0.00011, 1e−6, 0.00086, respectively.
Fig. 6
Fig. 6. The temporal roles of gastrulation stage BMP signaling pathway in regulating left–right asymmetry.
a Experimental strategy of ex vivo culture and analysis of embryos following chemical inhibition of BMP activity for 3, 6, 9, 12, and 15 h beginning on E7.0. b Whole-mount RNAscope analysis of embryos after 30 h of ex vivo culture, showing the expression of Nodal in the lateral mesoderm and the node (ventral view). The frequency of left-sided expression of Nodal is shown for Group A (untreated control) and Group B (3 h treatment), and the frequency of abnormal (bilateral) expression of Nodal is shown for Groups C (6 h treatment), D (9 h treatment), E (12 h treatment), and F (15 h treatment). c Table showing the pattern of Nodal expression in the cultured embryos collected at 30 h in vitro (equivalent to E8.25). A chi-squared test was performed to determine the statistical significance. d Whole-mount in situ hybridization of Dand5/Cerl2 in cultured embryos from indicated experimental groups. Three biologically independent samples for each group were examined for consistency of gene expression pattern. e Experimental strategy of ex vivo culture and analysis of embryos following chemical inhibition of BMP activity for 6 h beginning at E7.25 (Group G and H), E7.5 (Group I and J), and E7.75 (Group K and L) stages. f Whole-mount in situ hybridization of Lefty2 after ex vivo culture (equivalent to E8.25), showing the expression of Lefty2 in the lateral mesoderm (ventral view). The frequency and embryo number of annotated patterns of Lefty2 are shown for each group. g Table showing the pattern of Lefty2 expression in the cultured embryos collected at equivalent E8.25 stages. A chi-squared test was performed to determine the statistical significance. h Whole-mount in situ hybridization of Dand5/Cerl2 in cultured embryos from indicated experimental groups. Three biologically independent samples for each group were examined for consistency of gene expression pattern.
Fig. 7
Fig. 7. The role of the BMP signaling pathway in regulating left–right asymmetry during gastrulation.
a Experimental strategy of ex vivo culture and analysis of embryos following siRNA microinjection beginning at E7.0 stage. Group M: Injection of control siRNA; Group N: Injection of siRNA mixture in the right-side mesoderm; Group O: Injection of siRNA mixture in the left-side mesoderm. b Whole-mount in situ hybridization of Lefty2 after ex vivo culture (equivalent to E8.25), showing the expression of Lefty2 in the lateral mesoderm (ventral view). The frequency and embryo number of annotated patterns of Lefty2 are shown for each group. c Table showing the pattern of Lefty2 expression in the cultured embryos collected at equivalent E8.25 stages. A chi-squared test was performed to determine the statistical significance. d Whole-mount in situ hybridization of Dand5/Cerl2 in cultured embryos (equivalent to E8.25) from indicated experimental groups. Three biologically independent samples for each group were examined for consistency of gene expression pattern. e Schematic diagram showing the workflow of GEO-seq for microinjected embryos. f Heatmap showing the DEGs of the proximal-left mesoderm (n = 120) and proximal-right mesoderm (n = 122) (p < 0.01, fold change > 1.5) in the siRNA-KD embryos. Replicates: Rep-1, Rep-2. The enriched gene ontology (GO) terms for each group were listed on the right. g The enrichment for target/response genes of development-related signaling pathways in the proximal-left and proximal-right mesoderm of siRNA microinjected embryos. Signaling activity: red, activating (A); green, inhibitory (I). The significance of the −log10(FDR) value in each cell was calculated by one-sided Fisher’s exact test followed by Benjamini–Hochberg correction.

Similar articles

Cited by

References

    1. Lawson KA, Meneses JJ, Pedersen RA. Clonal analysis of epiblast fate during germ layer formation in the mouse embryo. Development. 1991;113:891–911. - PubMed
    1. Tam PP. Regionalisation of the mouse embryonic ectoderm: allocation of prospective ectodermal tissues during gastrulation. Development. 1989;107:55–67. - PubMed
    1. Quinlan GA, Williams EA, Tan SS, Tam PP. Neuroectodermal fate of epiblast cells in the distal region of the mouse egg cylinder: implication for body plan organization during early embryogenesis. Development. 1995;121:87–98. - PubMed
    1. Nowotschin S, et al. The emergent landscape of the mouse gut endoderm at single-cell resolution. Nature. 2019;569:361–367. - PMC - PubMed
    1. Tam PP, Beddington RS. The formation of mesodermal tissues in the mouse embryo during gastrulation and early organogenesis. Development. 1987;99:109–126. - PubMed

Publication types