

Bidirectional genetic overlap between autism spectrum disorder and cognitive traits
- PMID: 37709755
- PMCID: PMC10502136
- DOI: 10.1038/s41398-023-02563-7
Bidirectional genetic overlap between autism spectrum disorder and cognitive traits
Abstract
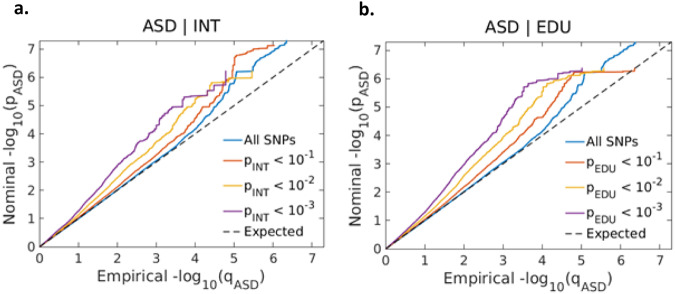
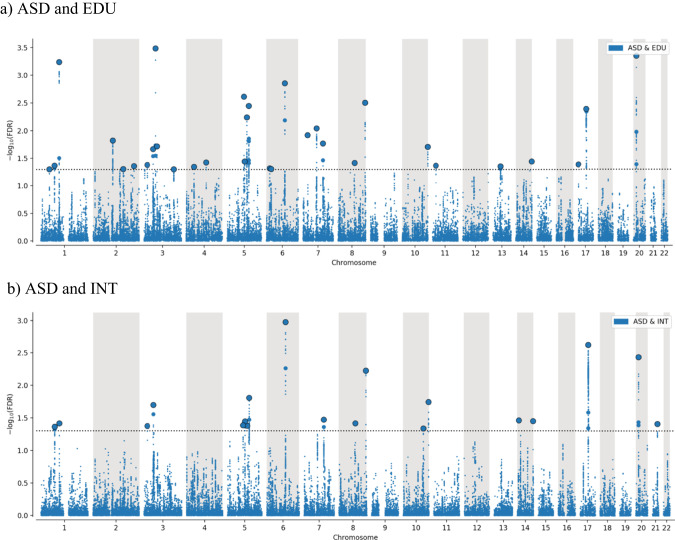
Autism spectrum disorder (ASD) is a highly heritable condition with a large variation in cognitive function. Here we investigated the shared genetic architecture between cognitive traits (intelligence (INT) and educational attainment (EDU)), and risk loci jointly associated with ASD and the cognitive traits. We analyzed data from genome-wide association studies (GWAS) of INT (n = 269,867), EDU (n = 766,345) and ASD (cases n = 18,381, controls n = 27,969). We used the bivariate causal mixture model (MiXeR) to estimate the total number of shared genetic variants, local analysis of co-variant annotation (LAVA) to estimate local genetic correlations, conditional false discovery rate (cond/conjFDR) to identify specific overlapping loci. The MiXeR analyses showed that 12.7k genetic variants are associated with ASD, of which 12.0k variants are shared with EDU, and 11.1k are shared with INT with both positive and negative relationships within overlapping variants. The majority (59-68%) of estimated shared loci have concordant effect directions, with a positive, albeit modest, genetic correlation between ASD and EDU (rg = 0.21, p = 2e-13) and INT (rg = 0.22, p = 4e-12). We discovered 43 loci jointly associated with ASD and cognitive traits (conjFDR<0.05), of which 27 were novel for ASD. Functional analysis revealed significant differential expression of candidate genes in the cerebellum and frontal cortex. To conclude, we quantified the genetic architecture shared between ASD and cognitive traits, demonstrated mixed effect directions, and identified the associated genetic loci and molecular pathways. The findings suggest that common genetic risk factors for ASD can underlie both better and worse cognitive functioning across the ASD spectrum, with different underlying biology.
© 2023. Springer Nature Limited.
Conflict of interest statement
Dr. Dale is a Founder of and holds equity in CorTechs.ai, and serves on its Scientific Advisory Board. He is a member of the Scientific Advisory Board of Human Longevity, Inc. and receives funding through research agreements with General Electric Healthcare and Medtronic, Inc. The terms of these arrangements have been reviewed and approved by UCSD in accordance with its conflict of interest policies. Dr. Andreassen is a consultant for Cortechs.ai and received speakers honorarium from Lundbeck and Sunovion. The remaining authors have no competing interests.
Figures

References
-
- Battle DE. Diagnostic and statistical manual of mental disorders (DSM) Codas. 2013;25:191–2. - PubMed
-
- Billeiter KB, Froiland JM. Diversity of intelligence is the norm within the autism spectrum: full scale intelligence scores among children with ASD. Child Psychiatry Hum Dev. 2023;54:1094–101. - PubMed
-
- Ben-Itzchak E, Watson LR, Zachor DA. Cognitive ability is associated with different outcome trajectories in autism spectrum disorders. J Autism Dev Disord. 2014;44:2221–9. - PubMed
-
- Masataka N. Implications of the idea of neurodiversity for understanding the origins of developmental disorders. Phys Life Rev. 2017;20:85–108. - PubMed
