. 2023 Sep 14;14(9):608.
doi: 10.1038/s41419-023-06126-y.

CXCR1 drives the pathogenesis of EAE and ARDS via boosting dendritic cells-dependent inflammation

Affiliations

CXCR1 drives the pathogenesis of EAE and ARDS via boosting dendritic cells-dependent inflammation

Wei Zhuang et al. Cell Death Dis. .

Abstract

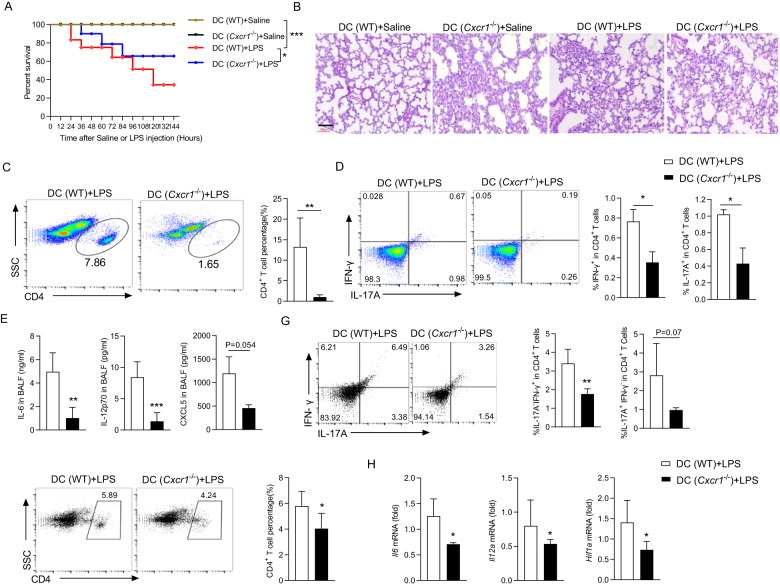
Chemokines secreted by dendritic cells (DCs) play a key role in the regulation of inflammation and autoimmunity through chemokine receptors. However, the role of chemokine receptor CXCR1 in inflammation-inducing experimental autoimmune encephalomyelitis (EAE) and acute respiratory distress syndrome (ARDS) remains largely enigmatic. Here we reported that compared with healthy controls, the level of CXCR1 was aberrantly increased in multiple sclerosis (MS) patients. Knockout of CXCR1 not only ameliorated disease severity in EAE mice but also suppressed the secretion of inflammatory factors (IL-6/IL-12p70) production. We observed the same results in EAE mice with DCs-specific deletion of CXCR1 and antibody neutralization of the ligand CXCL5. Mechanically, we demonstrated a positive feedback loop composed of CXCL5/CXCR1/HIF-1α direct regulating of IL-6/IL-12p70 production in DCs. Meanwhile, we found CXCR1 deficiency in DCs limited IL-6/IL-12p70 production and lung injury in LPS-induced ARDS, a disease model caused by inflammation. Overall, our study reveals CXCR1 governs DCs-mediated inflammation and autoimmune disorders and its potential as a therapeutic target for related diseases.


Conflict of interest statement

The authors declare no competing interests.

Figures

Fig. 1
Fig. 1. CXCR1 deficiency suppresses EAE development.
A CXCR1 mRNA expression in peripheral blood leukocytes in healthy controls (n = 21) and MS patients (n = 35) (left panel). Scatterplots showing the correlation between mRNA level of CXCR1 and EDSS in MS patients (right panel). WT and Cxcr1−/− mice were immunized with MOG35–55 peptides in CFA adjuvant and pertussis toxin to induce EAE. B Clinical scores of EAE in immunized WT and Cxcr1−/− mice (left panel), and linear regression analysis (right panel) of the recipient mice depicted (n = 6). The data are expressed as the mean ± SEM. *p < 0.05, vs. WT group (Mann–Whitney U test). C H&E staining and LFB staining of spinal cord paraffin sections from the WT and Cxcr1−/− mice 28 days after EAE induction. Scale bars, 200 μm. D Pooled data are presented from (C). E Representative flow cytometry data showing intracellular production of IFN-γ and IL-17A in CD4+ T cells from the spinal cord and brain of WT and Cxcr1−/− mice on 28 days after EAE induction. Pooled data are presented in the right panel. F ELISA analysis of cytokines (IL-12p70, IL-6, and TGF-β1) in the serum from WT and Cxcr1−/− mice 12 days after EAE induction. G mRNA levels of Il12a, Il6, and Tgfb1 in the brain from WT and Cxcr1−/− mice on days 0 and 21 after EAE induction. H ELISA analysis of IL-6, IL-12p70, and TGF-β1 in supernatant of DCs sorted from WT and Cxcr1−/− mice 12 days after EAE induction and restimulated with MOG35–55 for 48 h. Data are mean ± SEM. *p < 0.05, **p < 0.01, ***p < 0.001 vs. WT group (one-tailed Student’s t-test). Data are representative of three independent experiments with similar results.
Fig. 2
Fig. 2. CXCR1 modulates the production of inflammatory cytokines in DCs.
A DCs sorted from WT and Cxcr1−/− mice and treated with LPS (100 ng/ml) for 24 h. IL-6 and IL-12p70 in DCs supernatant were examined by ELISA. B Representative flow cytometry data showing intracellular production of IFN-γ and IL-17A in CD4+ T cells from DC-T cell coculture system in vitro. C Pooled data are presented from (B). D ELISA detection of IFN-γ and IL-17A in supernatants of cocultured DC-T cells. E DCs from WT or Cxcr1−/− mice were stimulated with LPS for 24 h and cultured in a transwell to naïve CD4+ T cell differentiation. F Representative flow cytometry data showing intracellular production of IFN-γ and IL-17A in CD4+ T cells. G, H The percentage of positive cells and protein levels of IL-17A (G) and IFN-γ (H) in cocultured DC-T cells or their supplemented. Pooled data are presented in the right panel. I Schematic diagram of cell adoptive transfer. J Representative flow cytometry data showing intracellular production of IFN-γ and IL-17A in CD4+ T cells 7 days after transfer. Pooled data are presented in the right panel. Data are mean ± SEM (n = 5–6). *p < 0.05, **p < 0.01, ***p < 0.001 vs. WT or indicated group. (one-tailed Student’s t-test). Data are representative of three independent experiments with similar results.
Fig. 3
Fig. 3. CXCR1 deficiency in DC ameliorates EAE progression.
WT or DC conditional knockout mice (DC (WT) or DC (Cxcr1−/−)) were immunized with MOG35–55 peptides in CFA adjuvant and pertussis toxin to induce EAE. A Mean clinical scores of EAE in DC (WT) and DC (Cxcr1−/−) mice (left panel), and linear regression analysis (right panel) of the recipient mice depicted (n = 5). The data are expressed as the mean ± SEM. *p < 0.05, vs. DC (WT) group (Mann–Whitney U test). B Representative flow cytometry data showing intracellular production of IFN-γ and IL-17A in CD4+ T cells from the spinal cord and brain of DC (WT) and DC (Cxcr1−/−) mice 28 days after EAE induction. Pooled data are presented in the right panel. C H&E staining and LFB staining (D) of spinal cord paraffin sections from the DC (WT) and DC (Cxcr1−/−) mice 28 days after EAE induction. Scale bars, 200 μm. Pooled data are presented in the right panel. E IL-12p70, IL-6, and TGF-β1 levels in the serum of DC (WT) and DC (Cxcr1−/−) mice 12 days after EAE induction were detected by ELISA. F Expression of Il12a, Il6, and Tgfb1 mRNA in the spinal cord and brain from the DC (WT) and DC (Cxcr1−/−) mice 28 days after EAE induction. Data are mean ± SEM. *p < 0.05, **p < 0.01, ***p < 0.001 vs. DC(WT) group (one-tailed Student’s t-test).
Fig. 4
Fig. 4. Inhibition of CXCL5 action attenuates EAE progression.
A Schematic diagram of EAE mice treated with CXCL5 neutralizing antibody (anti-CXCL5) or isotype control (IgG). B Clinical scores (left panel) and linear regression analysis (right panel) of the recipient mice. The data are expressed as the mean ± SEM (n = 7). **p < 0.01, ***p < 0.001 vs. IgG group (Mann–Whitney U test). C LFB staining and D H&E staining of spinal cord paraffin sections from the IgG and anti-CXCL5 (5 μg) treated mice 28 days after EAE induction. Pooled data are presented in the right panel. E Pooled data are presented from (C, D). F Frequencies of CD4+ T cells and G expression of IFN-γ and IL-17A from the spinal cord and brain 28 days after EAE induction. H Pooled data are presented from (G). *p < 0.05, **p < 0.01, ***p < 0.001 vs. IgG group (one-tailed Student’s t-test). I Schematic diagram of DC (WT) or DC (Cxcr1−/−) mice that were induced EAE and treated with 1.6 μg anti-CXCL5 or IgG. J Clinical scores (left panel) and linear regression analysis (right panel) of the recipient mice. The data are expressed as the mean ± SEM (n = 7). **p < 0.01, ***p < 0.001 vs. IgG group (Mann–Whitney U test).
Fig. 5
Fig. 5. CXCL5/CXCR1/HIF-1α feedback loop positively regulates the production of IL-6 and IL-12p70 in DCs.
DCs were sorted from spleens of WT mice and treated with LPS (100 ng/ml) for 24 h in the presence of anti-CXCL5 antibody or IgG isotype control. A Concentrations of IL-6 and IL-12p70 in culture supernatants of DCs were detected by ELISA. B Flow cytometry analyzed the expression of HIF-1α (left), Pooled data are presented from (right). C DCs were sorted from spleens of WT or Cxcr1−/− mice and stimulated by LPS or not for 24 h. The expression of HIF-1α was examined by Immunoblot analysis. D, E Four different groups of mice (WT, Cxcr1−/−, DC(WT) and DC(Cxcr1−/−)) were immunized with MOG 35–55 peptide in CFA adjuvant and pertussis toxin to induce EAE for 28 days. The spinal cord and brain lysates were probed for HIF-1α protein level by Immunoblot analysis. F Purified DCs were sorted from spleens of WT or Cxcr1−/− mice and treated for 24 h with LPS (100 ng/ml) in the presence or absence of the HIF-1α agonist (CoCl2, 200 μM). Concentrations of IL-6 and IL-12p70 in supernatants were detected by ELISA. G Purified DCs were treated for 24 h with LPS (100 ng/ml) in the presence or absence of the HIF-1α agonist (CoCl2, 200 μM) or inhibitor (KC7F2, 20 μM) and concentrations of CXCL5 in supernatants were detected by ELISA. I Schematic diagram of two HREs in the CXCL5 promoter. H, J Luciferase assay to analyze the function of HIF-1α in regulation of CXCL5 promoter activity. Luciferase activity was calculated as the ratio of firefly/Renilla luciferase activity. K ChIP assay demonstrating the direct binding of HIF-1α to CXCL5 promoter. L IL-6 or IL-12p70 production by human DCs stimulated with LPS (100 ng/ml) alone or combined with indicated conditions. M HIF1A mRNA level in peripheral blood leukocytes from MS patients (n = 20) or control healthy donors (n = 18). N Scatterplots showing the correlation between mRNA level of HIF1A and EDSS. Data are mean ± SEM. *p < 0.05, **p < 0.01, ***p < 0.001 vs. WT or indicated group (one-tailed Student’s t-test). Data are representative of three independent experiments with similar results.
Fig. 6
Fig. 6. Deletion of CXCR1 protects from LPS-induced acute lung injury.
A Percent survival of WT and Cxcr1−/− mice after LPS (10 mg/kg) intraperitoneal compared with saline controls. (n = 8, Kaplan–Meier survival curves/Mantel–Cox analysis). B H&E staining images of lung tissue from WT and Cxcr1−/− mice after saline or 10 mg/kg LPS challenge. Tissue was collected 24 h after administration. CE Bronchoalveolar lavage fluid (BALF) was obtained after WT and Cxcr1−/− mice 24 h intraperitoneal injection of LPS (10 mg/kg). Representative flow cytometry data showing frequencies of CD4+ T cells (C) IFN-γ+ and IL-17A+ (D). Pooled data are presented in the right panel. E ELISA analysis of IL-6, IL-12p70, and CXCL5 concentrations in BALF. F, G Immune cells were sorted from the lung tissue, and the percentage of CD4+ T cells (F), IFN-γ, and IL-17A in CD4+ T (G) were analyzed by flow cytometry. Pooled data are presented in the right panel. H Quantitation of Il6, Il12a, Cxcl5, and Hif1α mRNA level in lung tissue of WT and Cxcr1−/− mice stimulated with LPS for 24 h. Data are mean ± SEM (n = 5–6 in BE, G, H). *p < 0.05, **p < 0.01, ***p < 0.001 vs. WT group (one-tailed Student’s t-test). Data are representative of three independent experiments with similar results.
Fig. 7
Fig. 7. CXCR1 governs the pathogenesis of LPS-induced acute lung injury in DCs.
A Percent survival of DC(WT) and DC(Cxcr1−/−) mice after LPS (10 mg/kg) intraperitoneal compared with saline controls. (n = 8, Kaplan–Meier survival curves/Mantel–Cox analysis). B H&E staining images of lung tissue from DC(WT) and DC(Cxcr1−/−) mice after saline or 10 mg/kg LPS challenge. Tissue was collected 24 h after administration. CE Bronchoalveolar lavage fluid (BALF) was obtained after DC(WT) and DC(Cxcr1−/−) mice 24 h intraperitoneal injection of LPS (10 mg/kg). Representative flow cytometry data showing frequencies of CD4+ T cells (C) IFN-γ+ and IL-17A+ (D). Pooled data are presented in the right panel. E ELISA analysis of IL-6, IL-12p70, and CXCL5 concentrations in BALF. F, G Immune cells were sorted from the lung tissue, and the percentage of CD4+ T cells (F) and the proportion of IFN-γ and IL-17A in CD4+ T cells (G) were analyzed by flow cytometry. Pooled data are presented in the right panel. H Quantitation of Il6, Il12a, and Hif1α mRNA levels in lung tissue of DC(WT) and DC(Cxcr1−/−) mice stimulated with LPS for 24 h. Data are mean ± SEM (n = 5–6 in BE, G, H). *p < 0.05, **p < 0.01, ***p < 0.001 vs. DC (WT) group (one-tailed Student’s t-test). Data are representative of three independent experiments with similar results.
Fig. 8
Fig. 8. Graphical summary of CXCR1 drives dendritic cell-dependent inflammation and autoimmune pathogenesis.
LPS or virus infection upregulates the level of HIF-1α via CXCR1 and Erk signaling pathways in DCs. The increasing level of HIF-1α binds to the CXCL5 promoter and causes an upregulation of CXCL5 expression, then forming a CXCL5/CXCR1/HIF-1α positive feedback loop. This feedback loop promotes IL-6 and IL-12p70 expression, ultimately leading to inflammation damage in the EAE and ARDS mice model. LPS lipopolysaccharide, DC dendritic cells, ARDS acute respiratory distress syndrome.

Similar articles

Cited by

References

    1. Fullerton JN, Gilroy DW. Resolution of inflammation: a new therapeutic frontier. Nat Rev Drug Discov. 2016;15:551–67. doi: 10.1038/nrd.2016.39. - DOI - PubMed
    1. Serra P, Santamaria P. Antigen-specific therapeutic approaches for autoimmunity. Nat Biotechnol. 2019;37:238–51. doi: 10.1038/s41587-019-0015-4. - DOI - PubMed
    1. Wang L, Wang FS, Gershwin ME. Human autoimmune diseases: a comprehensive update. J Intern Med. 2015;278:369–95. doi: 10.1111/joim.12395. - DOI - PubMed
    1. Zarrin AA, Bao K, Lupardus P, Vucic D. Kinase inhibition in autoimmunity and inflammation. Nat Rev Drug Discov. 2021;20:39–63. doi: 10.1038/s41573-020-0082-8. - DOI - PMC - PubMed
    1. Spinelli FR, Conti F, Gadina M. HiJAKing SARS-CoV-2? The potential role of JAK inhibitors in the management of COVID-19. Sci Immunol. 2020;5:eabc5367. doi: 10.1126/sciimmunol.abc5367. - DOI - PubMed

Publication types