. 2023 Sep 14;8(1):26.
doi: 10.1038/s41525-023-00369-6.

A pan-sarcoma landscape of telomeric content shows that alterations in RAD51B and GID4 are associated with higher telomeric content

Affiliations

A pan-sarcoma landscape of telomeric content shows that alterations in RAD51B and GID4 are associated with higher telomeric content

Radwa Sharaf et al. NPJ Genom Med. .

Abstract

Tumor cells need to activate a telomere maintenance mechanism, enabling limitless replication. The bulk of evidence supports that sarcomas predominantly use alternative lengthening of telomeres (ALT) mechanism, commonly associated with alterations in ATRX and DAXX. In our dataset, only 12.3% of sarcomas harbored alterations in these genes. Thus, we checked for the presence of other genomic determinants of high telomeric content in sarcomas. Our dataset consisted of 13555 sarcoma samples, sequenced as a part of routine clinical care on the FoundationOne®Heme platform. We observed a median telomeric content of 622.3 telomeric reads per GC-matched million reads (TRPM) across all samples. In agreement with previous studies, telomeric content was significantly higher in ATRX altered and POT1 altered sarcomas. We further observed that sarcomas with alterations in RAD51B or GID4 were enriched in samples with high telomeric content, specifically within uterus leiomyosarcoma for RAD51B and soft tissue sarcoma (not otherwise specified, nos) for GID4, Furthermore, RAD51B and POT1 alterations were mutually exclusive with ATRX and DAXX alterations, suggestive of functional redundancy. Our results propose a role played by RAD51B and GID4 in telomere elongation in sarcomas and open research opportunities for agents aimed at targeting this critical pathway in tumorigenesis.


Conflict of interest statement

RS, DXJ, EE, GMF, LAA, and MM are employees of Foundation Medicine, Inc., a wholly owned subsidiary of Roche Holdings, Inc. and Roche Finance Ltd, and these employees have equity interest in an affiliate of these Roche entities. DT is the CEO of Omico, which provides national precision oncology services in Australia. DT has commercial and academic partnerships with multiple industry partners, including: Roche, Pfizer, Eisai, Astra Zeneca, Amgen, Abbvie, Eli Lilly, Beigene, Bayer, Illumina, Foundation Medicine, Microba, Merck, GMDx, Biotessellate, InterVenn. DT acts in a consultant capacity to the Health Futures Fund of Australian Unity, and the Maine Cancer Genome Initiative. All other authors don’t have conflicts of interest.

Figures

Fig. 1
Fig. 1. Overview of telomeric content landscape in sarcomas and screen results.
A A boxplot showing the landscape of telomeric content across sarcoma disease groups. The red dotted line depicts the median telomeric content across all samples. B Results from the screen displaying the 4 genetic associations identified within each disease ontology. The p-value is denoted by the color and alteration prevalence is denoted by the size of each circle. C Boxplots depicting the difference in telomeric content between ATRX altered and ATRX WT samples within soft tissue liposarcoma and soft tissue sarcoma nos. D Boxplots depicting the difference in telomeric content between GID4 altered vs GID4 WT samples within soft tissue sarcoma nos, POT1 altered vs POT1 WT within angiosarcoma, and RAD51B altered vs RAD51B WT within uterus leiomyosarcoma. The counts of samples within each group are indicated under the x-axis. ****p < 0.0001 and ***p < 0.001. nos, not otherwise specified. In all boxplots, the box extends from the first to the third quartile with a line in the middle that represents the median.
Fig. 2
Fig. 2. Alteration types observed for RAD51B, GID4, and POT1.
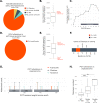
A Pie chart displaying the proportion of various RAD51B alterations observed across uterus leiomyosarcoma samples. B Within samples with a RAD51B copy-number deletion, the size of the deleted segment is displayed on the boxplot and a red dotted line denotes the size of the RAD51B gene in nucleotides. C A line plot displaying the proportion of samples with a RAD51B copy-number deletion harboring deletions within each exon of RAD51B. The position of the ATPase domain is indicated at the bottom. D Pie chart showing that all of the GID4 alterations observed across soft tissue sarcoma nos samples are copy number amplifications. E Within samples with a GID4 copy-number amplification, the size of the amplified segment is displayed on the boxplot and two red dotted lines indicate the size of the GID4 gene and the size of the chr17p11.2 cytoband, respectively. F Analysis of enrichment for high telomeric content in samples with amplifications across chromosome bands in chr17p. Select genes of interest within certain cytobands are shown on the top. Orange indicates p = 0.05 and slate blue indicates p > 0.05. G Lollipop plot displaying the count of mutations observed across the Oligonucleotide/Oligosaccharide Binding (OB) fold domains of POT1. H Boxplot showing the distribution of telomeric content values across angiosarcoma samples with a POT1 single hit mutation, double hit mutation or WT. CN copy number alteration, RE rearrangement, SV short variant alteration, nos, not otherwise specified, nts nucleotides, TPM transcripts per million. ****p < 0.0001 and **p < 0.01. In all boxplots, the box extends from the first to the third quartile with a line in the middle that represents the median.
Fig. 3
Fig. 3. Mutual exclusivity of RAD51B, POT1, ATRX, and DAXX.
A Barplot indicating the prevalence rate of alterations within ATRX, DAXX, GID4, POT1, and RAD51B within each disease. Analysis restricted to diseases with at least 100 total samples. B Tile plot showing the distribution of alterations in ATRX, DAXX, RAD51B, POT1, and GID4 within sarcoma samples in the FMI dataset. Plot depicts 995 sarcoma samples, which harbor at least one alteration in these genes. Altered samples are shown in orange and non-altered samples are shown as white. The impact of single and/or multiple alterations within these genes on telomeric content is shown for soft tissue sarcoma nos in C, uterus leiomyosarcoma samples in D, and angiosarcomas in E. Within each group, the symbol (+) means altered and the symbol (-) means non-altered. Groups are plotted if they contain >5 samples. Only comparisons against WT are shown. ****p < 0.001, ***p < 0.001, and *p < 0.05. In all boxplots, the box extends from the first to the third quartile with a line in the middle that represents the median.
Fig. 4
Fig. 4. Levels of TERRA expression.
Boxplots depicting differences in levels of TERRA expression in GID4 altered vs GID4 WT soft tissue sarcoma nos samples (A), POT1 altered vs POT1 WT angiosarcoma samples (B), and RAD51B altered vs RAD51B WT uterus leiomyosarcoma samples (C). ns not significant. ***p< 0.001. In all boxplots, the box extends from the first to the third quartile with a line in the middle that represents the median.
Fig. 5
Fig. 5. Impact of alterations on telomeres pan-sarcoma.
A Boxplot displaying the distribution of telomeric content values of samples in our screening cohort across all sarcoma diseases. ****p < 0.0001. Analysis was restricted to samples that are altered in only one of the telomere-maintenance mechanism genes. B Boxplot of the telomeric content values in the F1CDx cohort, specifically for WT, ATRX, DAXX, and GID4 altered soft tissue tumors. Analysis restricted to groups with at least 10 samples. **p < 0.01 and ****p < 0.0001. C Boxplot of the telomeric content values in the Australian cohort, specifically for WT, ATRX, and GID4 altered soft tissue tumors. Analysis restricted to groups with at least 10 samples. *p < 0.05; ns not significant. In all boxplots, the box extends from the first to the third quartile with a line in the middle that represents the median.

Similar articles

Cited by

References

    1. Hanahan D, Weinberg RA. Hallmarks of cancer: the next generation. Cell. 2011;144:646–674. - PubMed
    1. Huffman KE, Levene SD, Tesmer VM, Shay JW, Wright WE. Telomere shortening is proportional to the size of the G-rich telomeric 3’-overhang. J. Biol. Chem. 2000;275:19719–19722. - PubMed
    1. Rahman R, Forsyth NR, Cui W. Telomeric 3′-overhang length is associated with the size of telomeres. Exp. Gerontol. 2008;43:258–265. - PubMed
    1. Martens UM, Chavez EA, Poon SS, Schmoor C, Lansdorp PM. Accumulation of short telomeres in human fibroblasts prior to replicative senescence. Exp. Cell Res. 2000;256:291–299. - PubMed
    1. Wright WE, Tesmer VM, Huffman KE, Levene SD, Shay JW. Normal human chromosomes have long G-rich telomeric overhangs at one end. Genes Dev. 1997;11:2801–2809. - PMC - PubMed