

A pseudoproxy emulation of the PAGES 2k database using a hierarchy of proxy system models
- PMID: 37709805
- PMCID: PMC10502095
- DOI: 10.1038/s41597-023-02489-1
A pseudoproxy emulation of the PAGES 2k database using a hierarchy of proxy system models
Abstract
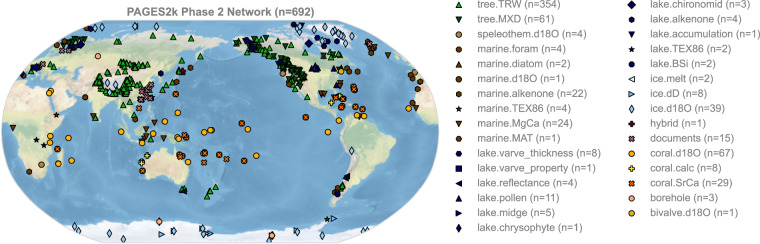
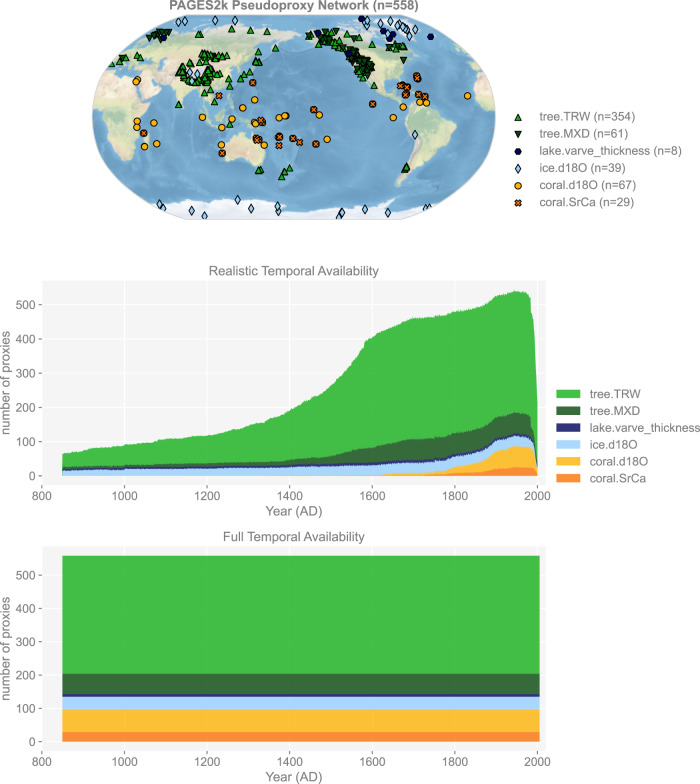
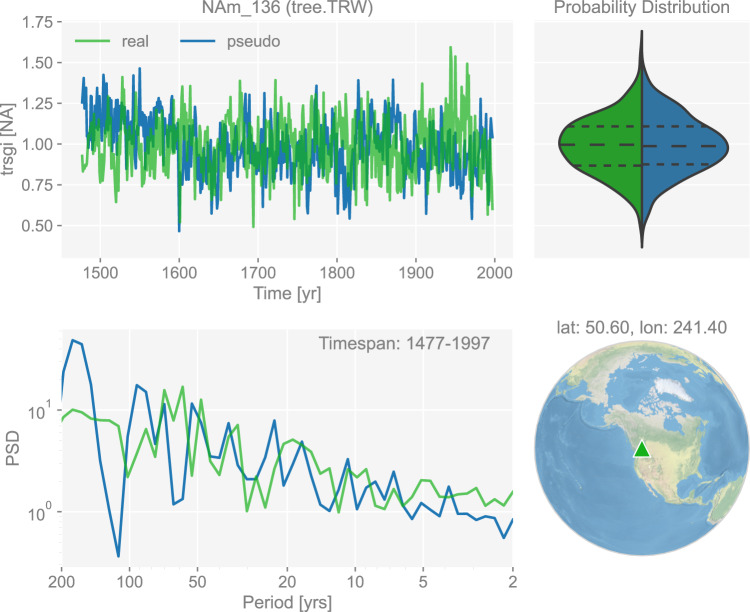
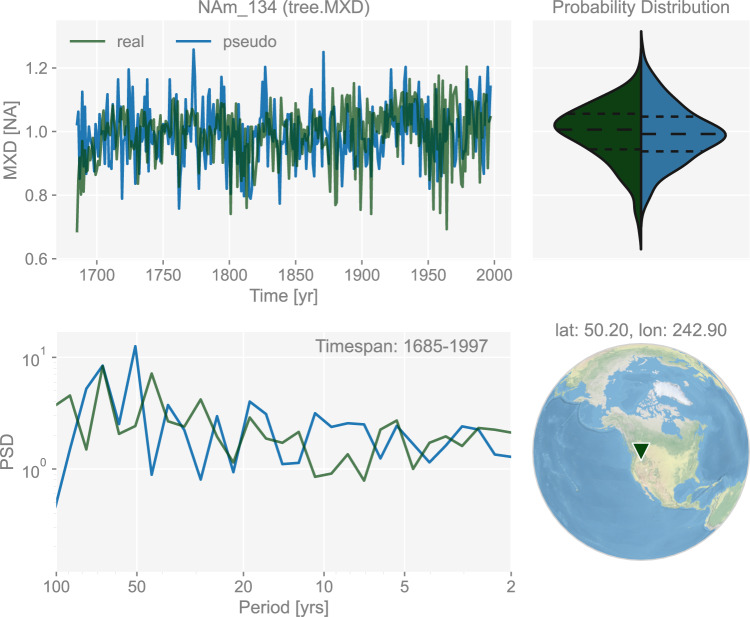
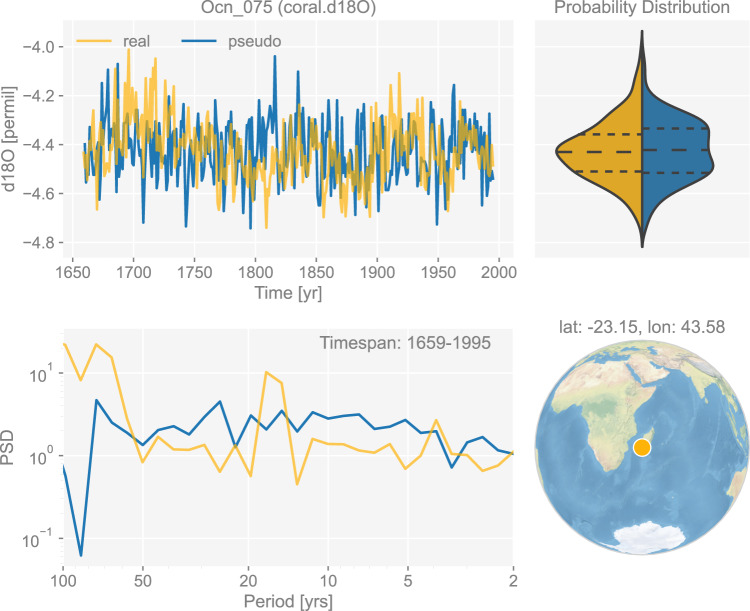
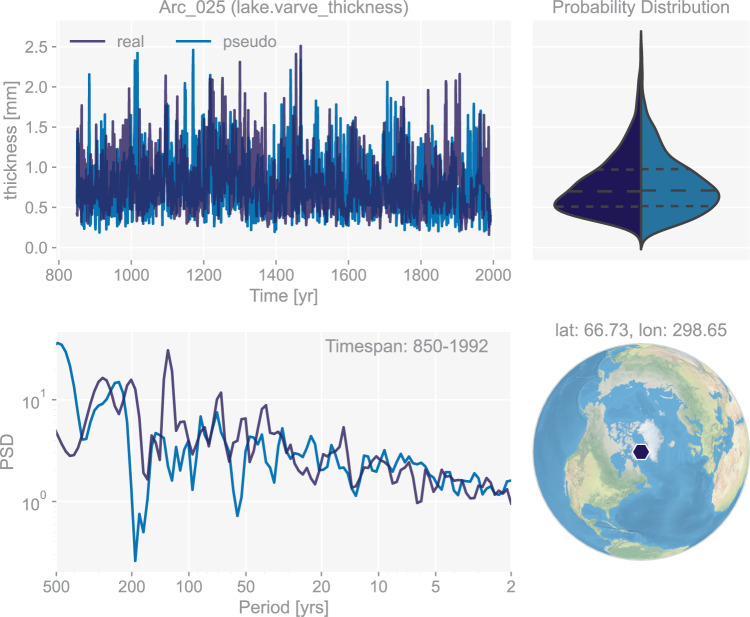
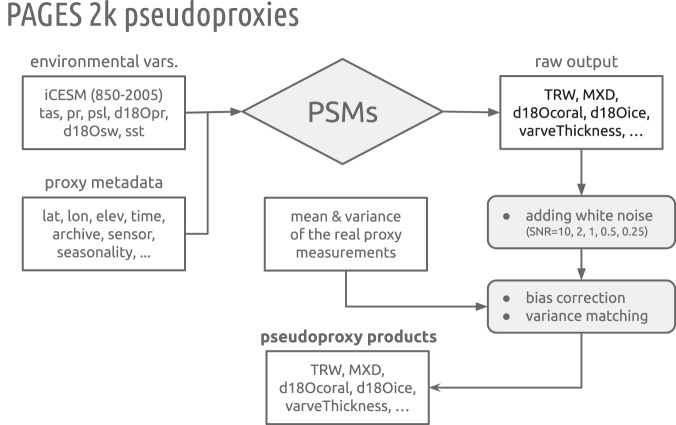
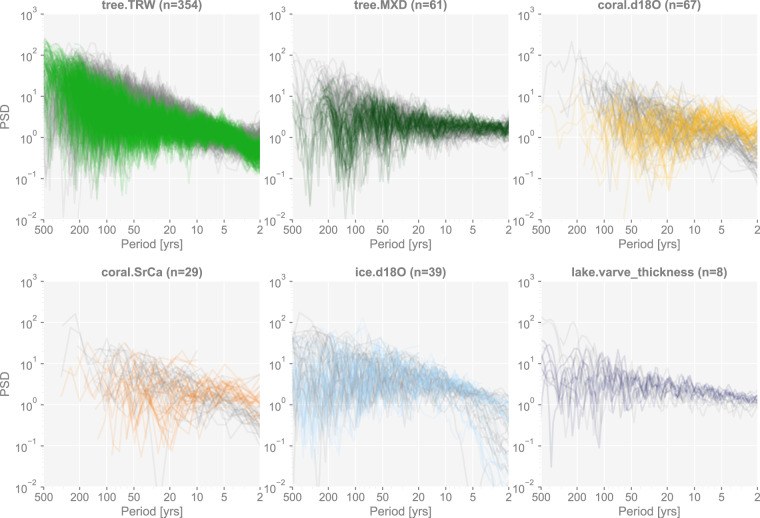
Paleoclimate reconstructions are now integral to climate assessments, yet the consequences of using different methodologies and proxy data require rigorous benchmarking. Pseudoproxy experiments (PPEs) provide a tractable and transparent test bed for evaluating climate reconstruction methods and their sensitivity to aspects of real-world proxy networks. Here we develop a dataset that leverages proxy system models (PSMs) for this purpose, which emulates the essential physical, chemical, biological, and geological processes that translate climate signals into proxy records, making these synthetic proxies more relevant to the real world. We apply a suite of PSMs to emulate the widely-used PAGES 2k dataset, including realistic spatiotemporal sampling and error structure. A hierarchical approach allows us to produce many variants of this base dataset, isolating the impact of sampling bias in time and space, representation error, sampling error, and other assumptions. Combining these various experiments produces a rich dataset ("pseudoPAGES2k") for many applications. As an illustration, we show how to conduct a PPE with this dataset based on emerging climate field reconstruction techniques.
© 2023. Springer Nature Limited.
Conflict of interest statement
The authors declare no competing interests.
Figures


References
-
- IPCC. Summary for policymakers. In Masson-Delmotte, V. et al. (eds.) Climate Change 2021: The Physical Science Basis. Contribution of Working Group I to the Sixth Assessment Report of the Intergovernmental Panel on Climate Change (Cambridge University Press, 2021).
-
- Tingley MP, et al. Piecing together the past: statistical insights into paleoclimatic reconstructions. Quaternary Science Reviews. 2012;35:1–22. doi: 10.1016/j.quascirev.2012.01.012. - DOI
-
- Goosse H, et al. The origin of the European “Medieval Warm Period”. Climate of the Past. 2006;2:99–113. doi: 10.5194/cp-2-99-2006. - DOI
-
- Gebhardt C, Kühl N, Hense A, Litt T. Reconstruction of Quaternary temperature fields by dynamically consistent smoothing. Climate Dynamics. 2008;30:421–437. doi: 10.1007/s00382-007-0299-9. - DOI
Publication types
Grants and funding
- 42205053/National Natural Science Foundation of China (National Science Foundation of China)
- 2303530/National Science Foundation (NSF)
- EAR 1948822/National Science Foundation (NSF)
- NA18OAR4310426/United States Department of Commerce | NOAA | Climate Program Office (NOAA Climate Program Office)
- NA18OAR4310420/United States Department of Commerce | NOAA | Climate Program Office (NOAA Climate Program Office)
LinkOut - more resources
Full Text Sources
