. 2023 Sep 14;6(1):942.
doi: 10.1038/s42003-023-05330-y.

Speg interactions that regulate the stability of excitation-contraction coupling protein complexes in triads and dyads

Affiliations

Speg interactions that regulate the stability of excitation-contraction coupling protein complexes in triads and dyads

Chang Seok Lee et al. Commun Biol. .

Abstract

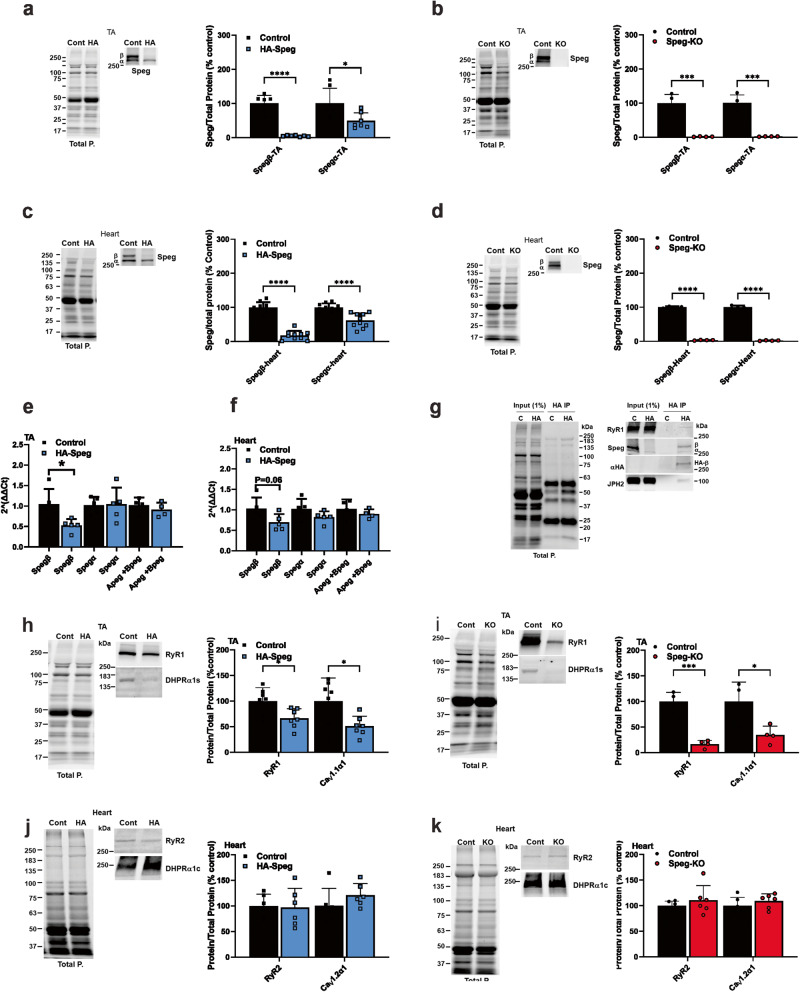
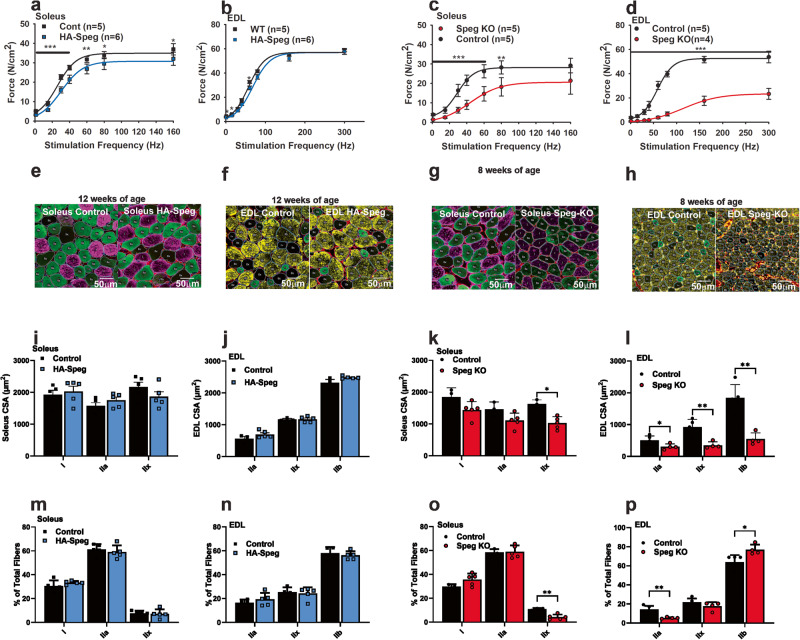
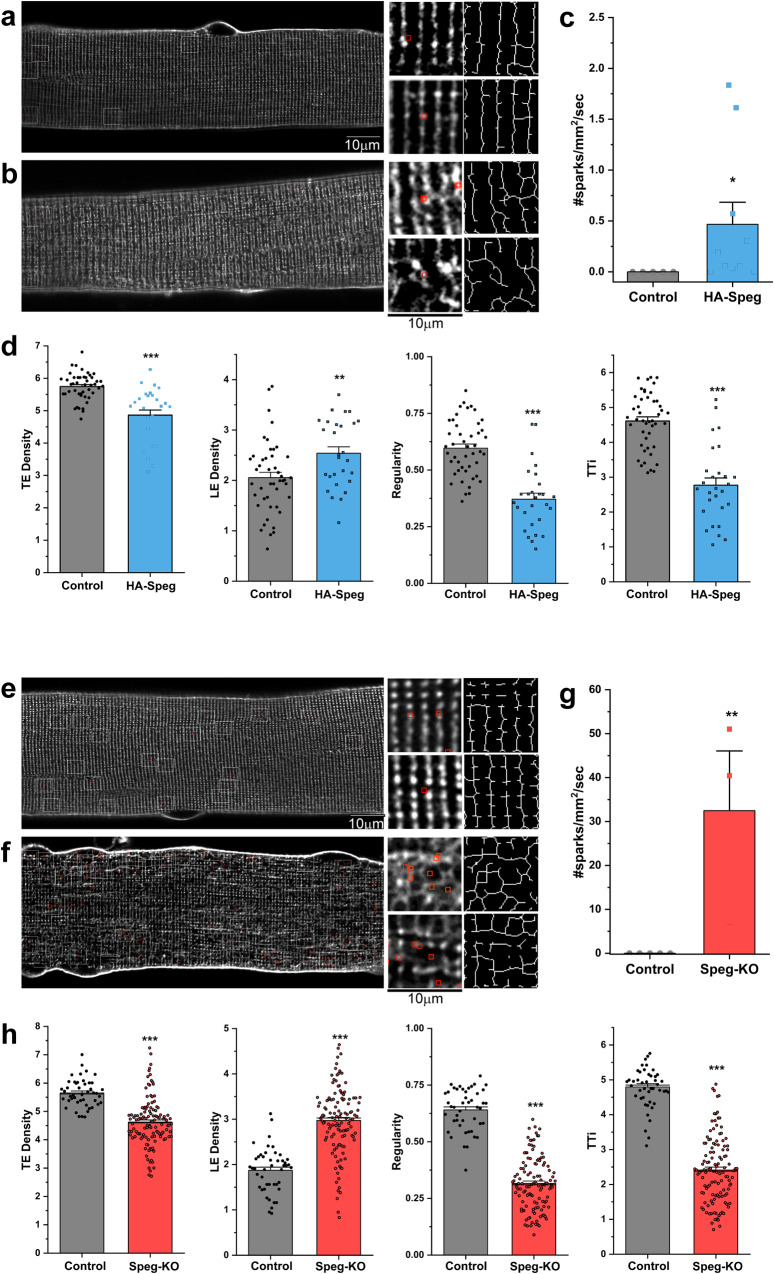
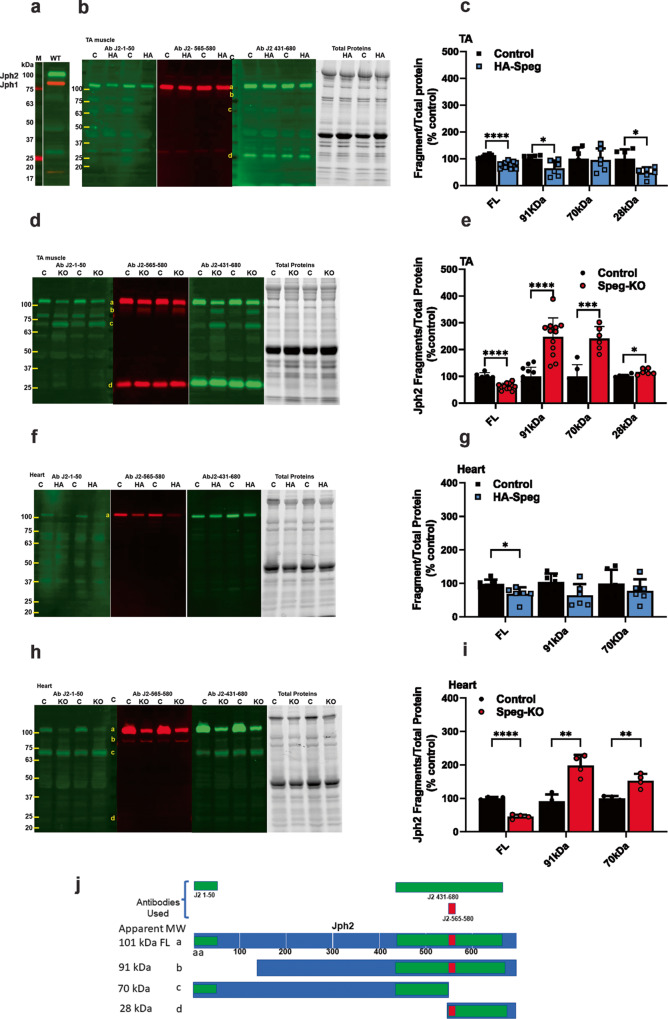
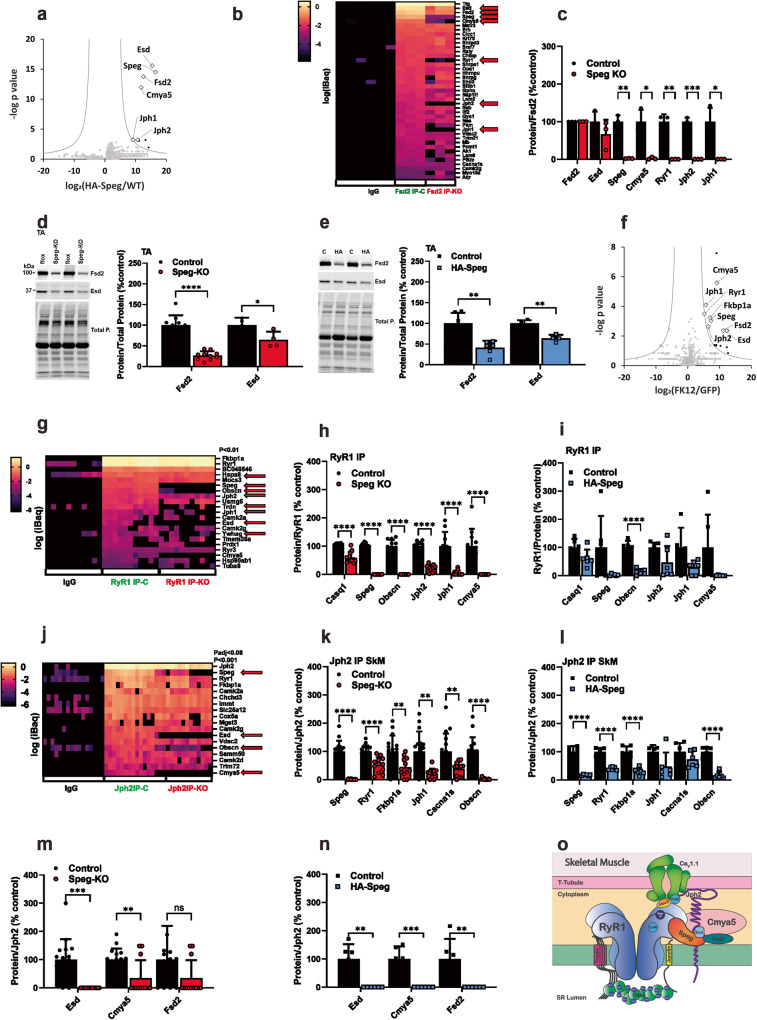
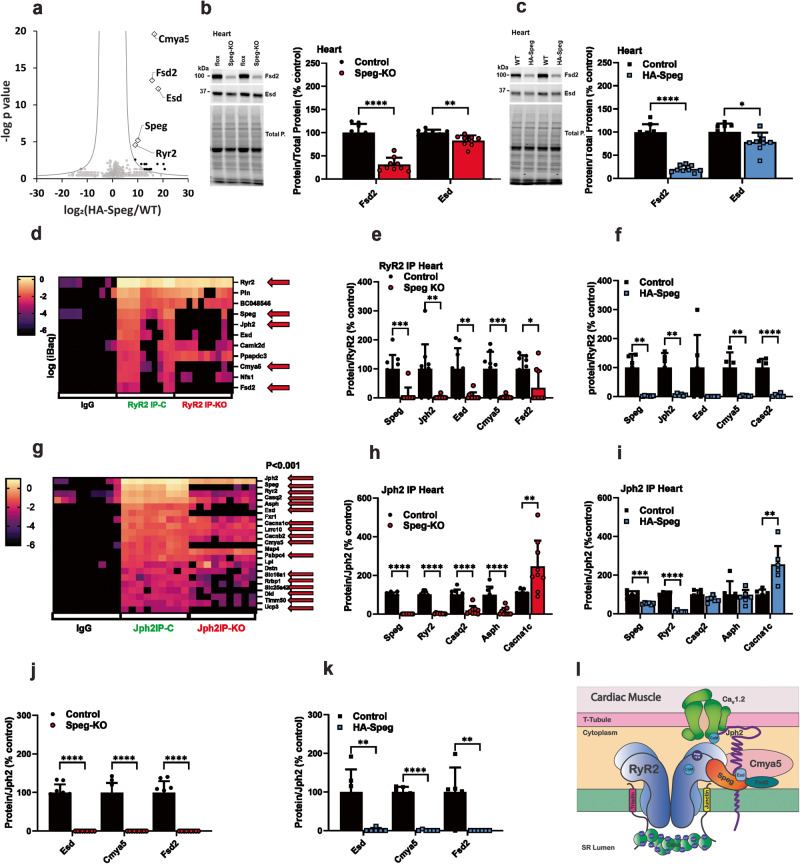
Here we show that striated muscle preferentially expressed protein kinase α (Spegα) maintains cardiac function in hearts with Spegβ deficiency. Speg is required for stability of excitation-contraction coupling (ECC) complexes and interacts with esterase D (Esd), Cardiomyopathy-Associated Protein 5 (Cmya5), and Fibronectin Type III and SPRY Domain Containing 2 (Fsd2) in cardiac and skeletal muscle. Mice with a sequence encoding a V5/HA tag inserted into the first exon of the Speg gene (HA-Speg mice) display a >90% decrease in Spegβ but Spegα is expressed at ~50% of normal levels. Mice deficient in both Spegα and Speg β (Speg KO mice) develop a severe dilated cardiomyopathy and muscle weakness and atrophy, but HA-Speg mice display mild muscle weakness with no cardiac involvement. Spegα in HA-Speg mice suppresses Ca2+ leak, proteolytic cleavage of Jph2, and disruption of transverse tubules. Despite it's low levels, HA-Spegβ immunoprecipitation identified Esd, Cmya5 and Fsd2 as Spegβ binding partners that localize to triads and dyads to stabilize ECC complexes. This study suggests that Spegα and Spegβ display functional redundancy, identifies Esd, Cmya5 and Fsd2 as components of both cardiac dyads and skeletal muscle triads and lays the groundwork for the identification of new therapeutic targets for centronuclear myopathy.


Conflict of interest statement

The authors declare the following competing interests: X.H.T.W. is a founding partner and board member of Elex Biotech, a start-up company that developed drug molecules to target ryanodine receptors to treat cardiac arrhythmias. The remaining authors declare no competing interests.

Figures

Fig. 1
Fig. 1. Speg and ECC protein expression levels in the TA and cardiac muscle of male HA-Speg and Speg-KO mice.
a Spegβ and Spegα expression in the TA of HA-Speg mice (homozygous) compared to controls (WT) (n = 7). A representative western blot is shown on the left. Total protein (in all panels) was obtained using stain-free gels (Bio-Rad), and after transfer of the proteins to the PVDF membrane (Immobilon®-FL, Millipore), the PVDF membrane was imaged by using a ChemiDocTM MP imaging system (Bio-Rad). b Spegβ and Spegα expression in the TA of Speg-KO mice (homozygous) compared to controls (Spegfl/fl) (n = 4 each). A representative western blot is shown on the left. c Spegβ and Spegα expression in hearts of HA-Speg mice compared to control mice (n = 10 each). A representative western blot is shown on the left. d Spegβ and Spegα expression in the hearts of Speg-KO mice (homozygous) compared to controls (Spegfl/fl) (n = 4 each). A representative western blot is shown on the left. e Expression of mRNA for Spegα, β, Apeg-1 + Bpeg in TA muscles of control (n = 4–5) and HA-tagged Speg mice (n = 4–5), respectively. P values are indicated as analyzed by Welch’s t test. All statistical tests are two-sided. Data are represented as mean ± standard deviation. f Expression of mRNA for Spegβ, Spegα, Apeg-1, and Bpeg in hearts of control (n = 4–5) and HA-tagged Speg mice (n = 4–5), respectively. P values are indicated as analyzed by Welch’s t test. All statistical tests are two-sided. g Immunoprecipitation with HA antibody of homogenate from HA-Speg and control mice. The figure shows western blot of total proteins and western bot with Speg antibody and HA antibody. h ECC protein levels in the TA of Speg-KO mice compared to controls with a representative western blot (n = 7 each). i ECC protein levels in TA of Speg-KO mice compared to controls with a representative western blot (n = 4 each). j ECC protein levels in the hearts of Speg-KO mice compared to controls with a representative western blot (n = 6 each). k ECC protein levels in hearts of Speg-KO mice compared to controls with a representative western blot (n = 6 each). All mice used for the data in this figure were male. Data are shown as the mean ± SD. ****P < 0.0001, ***P < 0.001, **P < 0.01, *P < 0.05.
Fig. 2
Fig. 2. Functional consequences of Speg deficiency.
Skeletal muscle function in HA-Speg (14 weeks), WT (13 weeks), Speg-KO (8–9 weeks), and Spegfl/fl (8–9 weeks) male mice were assessed using the indicated skeletal muscle functional or structural measurements. All data in this figure were obtained with male mice. Data on the diaphragm and separate data on female mice of each genotype are provided in the Supplementary Data Fig. 2. The Speg-KO mice used were younger than HA-Speg mice because they become extremely sick at ~10 weeks of age and often do not survive the echoes. a Force-frequency data for control (WT) and HA-Speg soleus. b Force-frequency data for the control (WT) and HA-Speg EDL. c Force-frequency data for control and Speg-KO soleus. d Force-frequency data for control and Speg-KO EDLs. e Fiber-type-specific staining of a representative cross-section from the soleus of control and HA-Speg mice. f Fiber-type-specific staining of a representative cross-section from the EDL of control and HA-Speg mice. g Fiber-type-specific staining of a representative cross-section from the soleus of control and Speg-KO mice. h Fiber-type-specific staining of a representative cross-section from the EDL of control and Speg-KO mice. i Average CSA of different fiber types in the soleus of control and HA-Speg mice. j Average CSA of different fiber types in the EDL of control and HA-Speg mice. k Average CSA of different fiber types in the soleus of control and Speg-KO mice. l Average CSA of different fiber types in the EDL of control and Speg-KO mice. m Fiber-type distribution in the soleus of control and HA-Speg mice. n Fiber-type distribution in the EDL of control and HA-Speg mice. o Fiber- type distribution in the soleus of control and Speg-KO mice. p Fiber-type distribution in the EDL of control and Speg-KO mice. Data are plotted as the mean ± SD. ****P < 0.0001, ***P < 0.001, **P < 0.01, and *P < 0.05.
Fig. 3
Fig. 3. Effects of Speg deficiencies on T-tubule structure and SR Ca2+ leak (sparks).
FDB fibers were isolated from male mice as described in Methods. We used dual imaging of t-tubules (FM4-64) and Ca2+ (Fluo-4) to find areas of T-tubule disruption and SR Ca2+ leak. a, b T-tubule organization (raw and skeletonized) and spark localization (red squares) in FDB fibers from control (a) and HA-Speg (b) mice. c Spontaneous Ca2+ spark frequency in control (Nfibers=21, Nanimals = 5) and HA-Speg fibers (Nfibers=28, Nanimals = 6). d Analysis of T-tubule organization in control and HA-Speg fibers. e, f T-tubule organization (raw and skeletonized) and spark localization (red squares) in FDB fibers from control (e) and Speg-KO (f) mice. g Spontaneous Ca2+ spark frequency in control (Nfibers=20, Nanimals = 5) and Speg-KO fibers (Nfibers=15, Nanimals = 3). h Analysis of T-tubule organization in control and Speg-KO fibers. TE is the density of transverse elements; LE is the density of longitudinal elements. Regularity is the organization or spacing and is the magnitude of the major frequency derived from the FFT of the image. TTi is the t-tubule integrity, which considers both the regularity and density of the t-tubules. Data are plotted as the mean ± SD, ***P < 0.001, **P < 0.01, and *P < 0.05.
Fig. 4
Fig. 4. Effect of Speg deficiency on Jph fragmentation.
a Western blot for Jph2 and Jph1 in the TA of WT mice. Red Jph1. Green Jph2. b Western blot for Jph2 fragments in the TA of control and HA-Speg mice stained with three different antibodies. The antibodies used in the blots are indicated in panel j (see Supplementary Table 3). The far-right panel in (b, d, f, h) is the total protein. c Analyses of fragments in TA of control and HA-Speg mice (n = 6–13). d Western blot for Jph2 fragments in the TA of Speg-KO and control mice. e Analysis of Jph2 fragments in TA control and Speg-KO mice (n = 6–13). f Western blot for Jph2 fragments in hearts of control and HA-Speg mice. g Analyses of fragments in control and HA-Speg hearts (n = 6). h Western blot for Jph2 fragments in control and Speg-KO hearts. i Analysis of Jph2 fragments in hearts of control and Speg-KO mice (n = 4). j Diagram of antibody binding sites and possible calpain-mediated cleavage sites. The tissues used in this experiment were all from male mice are FL- full-length Jph2, b—91 kDa, c—70 kDa, d—28 kDa. Data are plotted as the mean ± SD. ****P < 0.0001, ***P < 0.001, **P < 0.01, and *P < 0.05.
Fig. 5
Fig. 5. Speg-binding proteins and effects of Speg deficiency in skeletal muscle.
a Proteins immunoprecipitated from the gastrocnemius muscle of HA-Speg mice using antibodies against the HA-tag and identified by mass spectrometry (n = 6 for both the HA-IP from WT mice (nonspecific, ns) and the IP from HA-Speg mice). b Heatmap of immunoprecipitation of Fsd2 from Control and Speg-KO mice. (n = 3 for each). Also shown are IgG controls for nonspecific binding. c Analysis of the effects of Speg deficiency on Fsd2 binding proteins. d Effects of Speg deficiency on the levels of Fsd2 (n = 10) and Esd (n = 4) in homogenates from TA muscle of Speg-KO mice. A representative western blot is shown on the left. e Effects of Speg deficiency on the levels of Fsd2 (n = 6) and Esd (n = 4) in homogenates from TA muscle of HA-Speg mice. A representative western blot is shown on the left. f Proteins biotinylated by FKBP12-BirA compared to GFP-BirA. Proteins were purified with streptavidin beads and identified by mass spectrometry (n = 5 for each). g Heatmap of specific proteins in the RyR1 IP from the gastrocnemius muscle of control and Speg-KO mice (n = 11 for each). Nonspecific is shown as IgG. h RyR1 binding proteins in gastrocnemius muscle that are reduced in the RyR1 IP from Speg-KO mice (n = 11 for each). i RyR1 binding proteins in gastrocnemius muscle that are reduced in the RyR1 IP from HA-Speg mice (n = 6 for each). j Heatmap of specific proteins in the Jph2 IP from the gastrocnemius muscle of control and Speg-KO mice (n = 14 for control, n = 12 for Speg-KO). Also shown are IgG controls. k ECC proteins reduced in the Jph2 IP from muscle of Speg-KO mice. l ECC proteins reduced in the Jph2 IP from the muscle of HA-Speg mice (n = 6–7). m Effect of Speg deficiency on the relative amounts of Esd, Cmya5 and Fsd2 in the Jph2 IP from Speg-KO mice. n Effect of Speg deficiency on the relative amounts of Esd, Cmya5 and Fsd2 in the Jph2 IP from HA-Speg mice. o Model summarizing the findings from the proteomic studies in skeletal muscle. Data are plotted as the mean ± SD. ****P < 0.0001, ***P < 0.001, **P < 0.01, and *P < 0.05.
Fig. 6
Fig. 6. Speg-binding proteins and effects of Speg deficiency in the heart.
a Proteins immunoprecipitated from the hearts of HA-Speg mice using antibodies against the HA-tag and identified by mass spectrometry (n = 6 for each). b Effects of Speg deficiency on the levels of Fsd2 (n = 8 for each) and Esd (n = 9 for each) in homogenates from hearts of Speg-KO mice. A representative western blot is shown on the left. c Effects of Speg deficiency on the levels of Fsd2 and Esd in homogenates from hearts of HA-Speg mice (n = 6 for each). d Heatmap of specific RyR2 binding proteins from the hearts of control and Speg-KO mice (n = 9 for each). e Proteins that are significantly changed the cardiac RyR2 IP from controls compared Speg-KO mice. f Proteins that are significantly changed the cardiac RyR2 IP from controls compared HA-Speg mice (n = 6 for each). g Heatmap of specific Jph2-binding proteins from the hearts of control and Speg-KO mice (n = 9 for each). h Proteins that are significantly changed the cardiac Jph2 IPs from controls compared Speg-KO mice. i Proteins that are significantly changed the cardiac Jph2 IPs from controls compared HA-Speg mice (n = 6 for each). j Effect of Speg deficiency on the relative amounts of Esd, Cmya5 and Fsd2 in the cardiac Jph2 IP from Speg-KO mice. k Effect of Speg deficiency on the relative amounts of Esd, Cmya5, and Fsd2 in the cardiac Jph2 IP from HA-Speg mice. l Model summarizing the findings from the proteomic studies in cardiac muscle. Data are plotted as the mean ± SD. ****P < 0.0001, ***P < 0.001, **P < 0.01, and *P < 0.05.

References

    1. Gomez-Oca, R., Cowling, B. S. & Laporte, J. Common pathogenic mechanisms in centronuclear and myotubular myopathies and latest treatment advances. Int. J. Mol. Sci. 22. 10.3390/ijms222111377 (2021). - PMC - PubMed
    1. Gineste C, Laporte J. Therapeutic approaches in different congenital myopathies. Curr. Opin. Pharm. 2022;68:102328. doi: 10.1016/j.coph.2022.102328. - DOI - PubMed
    1. Fujise, K., Noguchi, S. & Takeda, T. Centronuclear myopathy caused by defective membrane remodelling of dynamin 2 and BIN1 variants. Int. J. Mol. Sci. 23. 10.3390/ijms23116274 (2022). - PMC - PubMed
    1. Lawlor MW, Dowling JJ. X-linked myotubular myopathy. Neuromuscul. Disord. 2021;31:1004–1012. doi: 10.1016/j.nmd.2021.08.003. - DOI - PubMed
    1. Campbell H, Aguilar-Sanchez Y, Quick AP, Dobrev D, Wehrens XHT. SPEG: a key regulator of cardiac calcium homeostasis. Cardiovasc. Res. 2021;117:2175–2185. doi: 10.1093/cvr/cvaa290. - DOI - PMC - PubMed

Publication types

Substances