

Membrane fouling monitoring by 3ω sensing
- PMID: 37709852
- PMCID: PMC10502093
- DOI: 10.1038/s41598-023-42337-1
Membrane fouling monitoring by 3ω sensing
Abstract
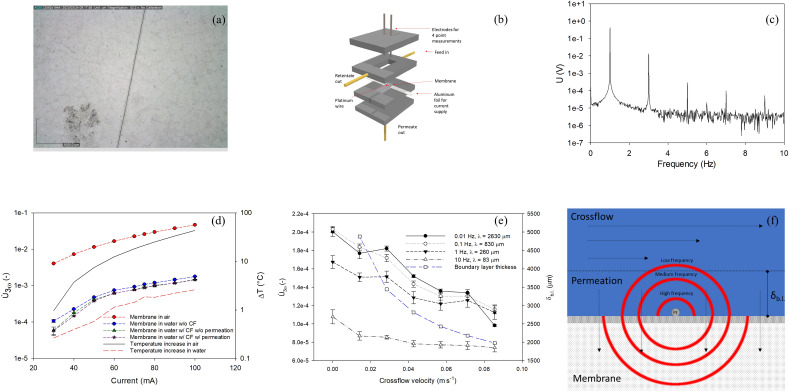
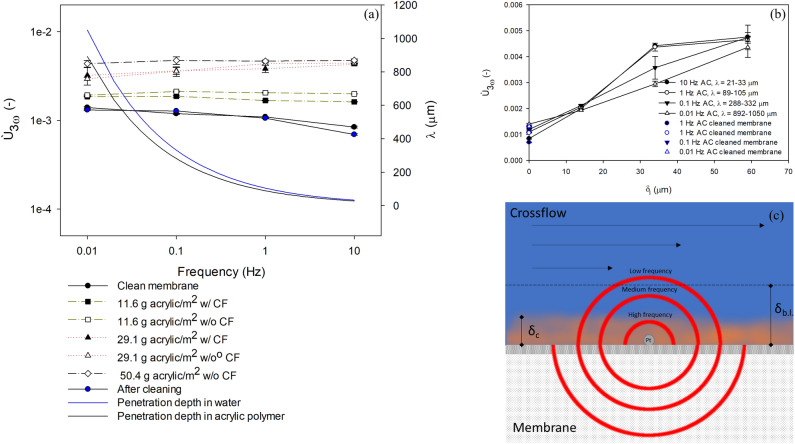
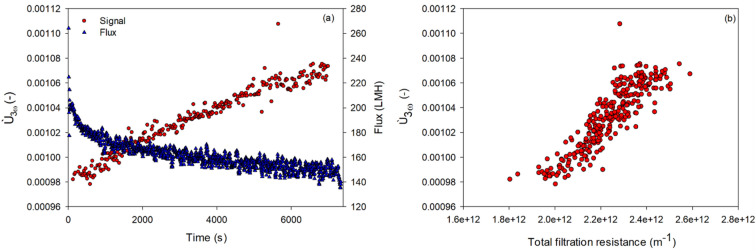
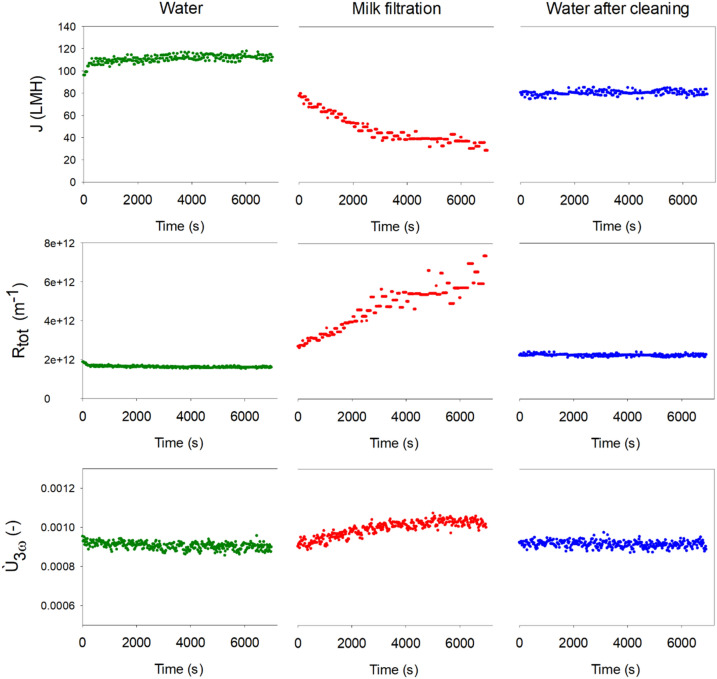
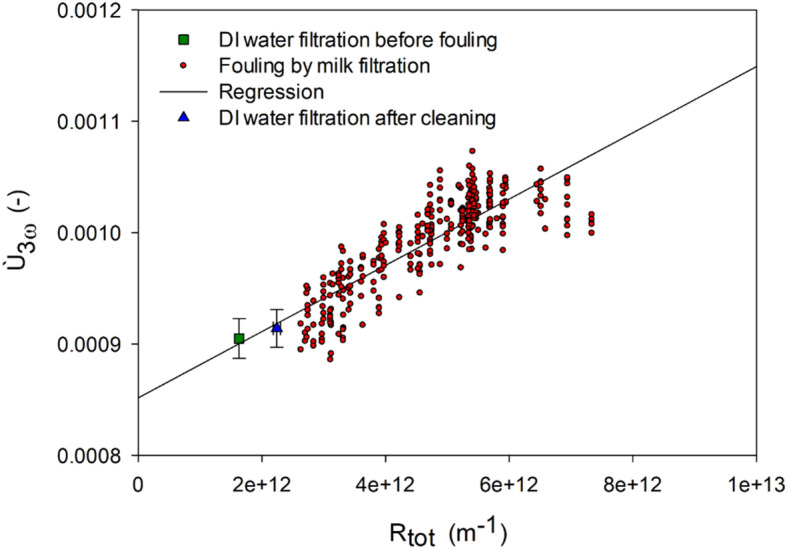
Membrane fouling significantly reduces membrane permeability, leading to higher operational expenses. In situ monitoring of membrane fouling can potentially be used to reduce operation cost by optimizing operational parameters and cleaning conditions. In this study, a platinum wire with a diameter of 20 µm was attached to the surface of a ceramic ultrafiltration membrane, and by measuring the voltage across the wire while applying an AC current, the amplitude of the third harmonic wave, the so-called 3ω signal, was obtained. Results showed increasing 3ω signals during formation of fouling layers, which correlates directly to the hydraulic resistance of the formed fouling layer in semi-dead end filtration of polymeric core shell particles and crossflow filtration of diluted milk. This is explained by the insulating effect of the fouling layers which reduces heat convection by crossflow and the different thermal conductivity in the fouling layer compared with the feed. After membrane cleaning, the permeability and the magnitude of the 3ω signal were partly restored, showing that the 3ω method can be used to monitor the effect of cleaning. The frequency of the AC current was varied so it was possible to measure the heat conductivity in the fouling layer (high frequency) and heat convection due to cross-flow (low frequency). This may potentially be used to get information of the type of fouling (heat conductivity) and thickness of the fouling layer (AC frequency where heat conductivity becomes dominating).
© 2023. Springer Nature Limited.
Conflict of interest statement
The authors declare no competing interests.
Figures
Similar articles
-
High temperature thermal conductivity of platinum microwire by 3ω method.Rev Sci Instrum. 2010 Nov;81(11):114904. doi: 10.1063/1.3496048. Rev Sci Instrum. 2010. PMID: 21133493
-
Evaluation of fouling formation and evolution on hollow fibre membrane: effects of ageing and chemical exposure on biofoulant.Water Res. 2015 Jan 1;68:182-93. doi: 10.1016/j.watres.2014.10.004. Water Res. 2015. PMID: 25462727
-
Comparison of MFI-UF constant pressure, MFI-UF constant flux and Crossflow Sampler-Modified Fouling Index Ultrafiltration (CFS-MFI UF).Water Res. 2011 Feb;45(4):1639-50. doi: 10.1016/j.watres.2010.12.001. Epub 2010 Dec 9. Water Res. 2011. PMID: 21194721
-
Fouling characteristics of NF and RO operated for removal of dissolved matter from groundwater.Water Res. 2003 Jul;37(12):2989-97. doi: 10.1016/S0043-1354(02)00563-8. Water Res. 2003. PMID: 12767302
-
A critical review on ultrasonic-assisted fouling control and cleaning of fouled membranes.Ultrasonics. 2020 Dec;108:106228. doi: 10.1016/j.ultras.2020.106228. Epub 2020 Jul 18. Ultrasonics. 2020. PMID: 32717532 Review.
References
-
- Rudolph G, Virtanen T, Güell C, Lipnizki F, Kallioinen M. A review of in situ real-time monitoring techniques for membrane fouling in the biotechnology, biorefinery and food sectors. J. Membr. Sci. 2019;588:117221. doi: 10.1016/j.memsci.2019.117221. - DOI
-
- Liu Q, et al. A review of the current in-situ fouling control strategies in MBR: Biological versus physicochemical. J. Ind. Eng. Chem. 2021;98:42–59. doi: 10.1016/j.jiec.2021.03.042. - DOI
-
- Jafari M, et al. Cost of fouling in full-scale reverse osmosis and nanofiltration installations in the Netherlands. Desalination. 2021;500:114865. doi: 10.1016/j.desal.2020.114865. - DOI
-
- Judd S. The MBR Book. Elsevier; 2011.
-
- Amin Saad M. Early discovery of RO membrane fouling and real-time monitoring of plant performance for optimizing cost of water. Desalination. 2004;165:183–191. doi: 10.1016/j.desal.2004.06.021. - DOI
Grants and funding
LinkOut - more resources
Full Text Sources
