. 2023 Oct;55(10):1686-1695.
doi: 10.1038/s41588-023-01499-4. Epub 2023 Sep 14.

Mismatch repair deficiency is not sufficient to elicit tumor immunogenicity

Affiliations

Mismatch repair deficiency is not sufficient to elicit tumor immunogenicity

Peter M K Westcott et al. Nat Genet. 2023 Oct.

Abstract

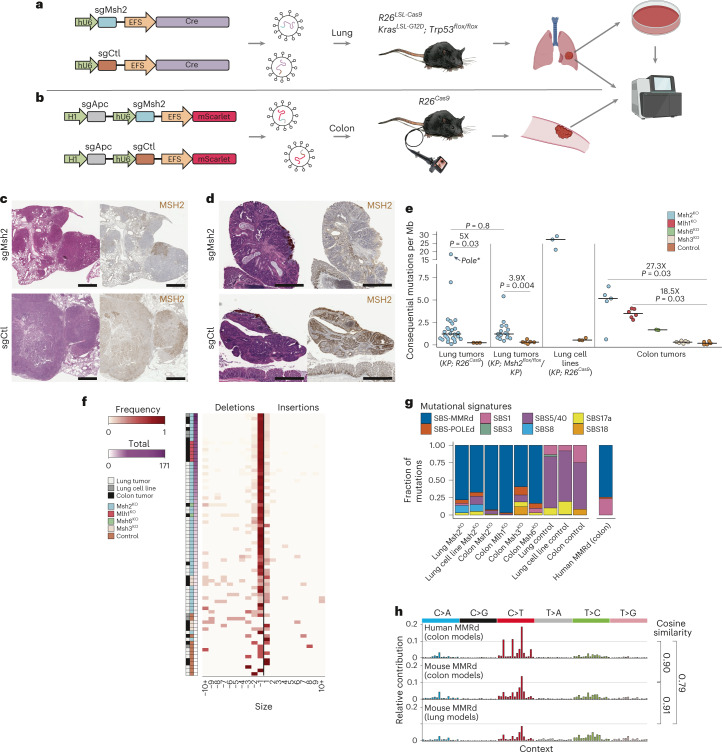
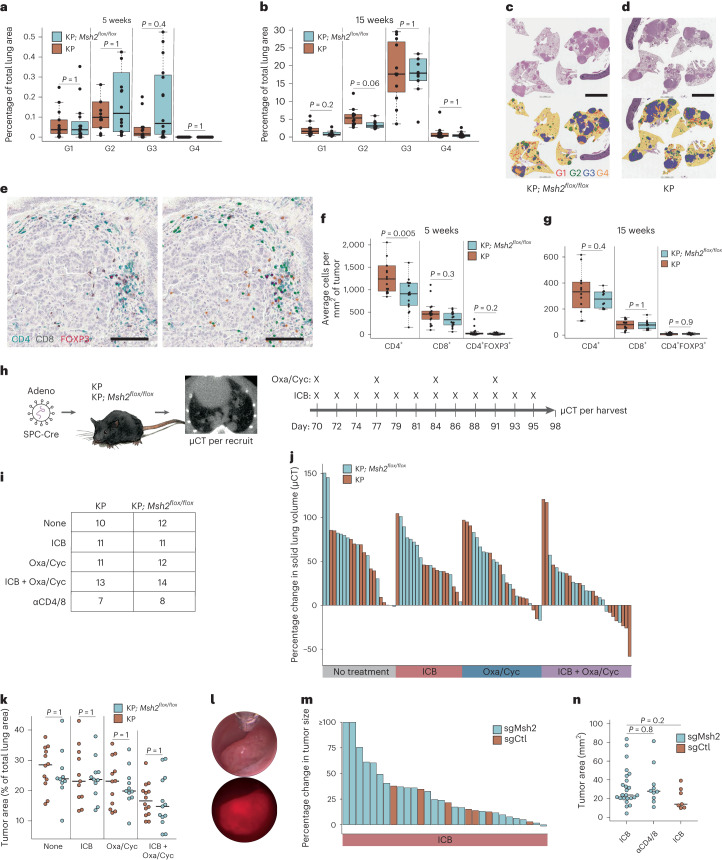
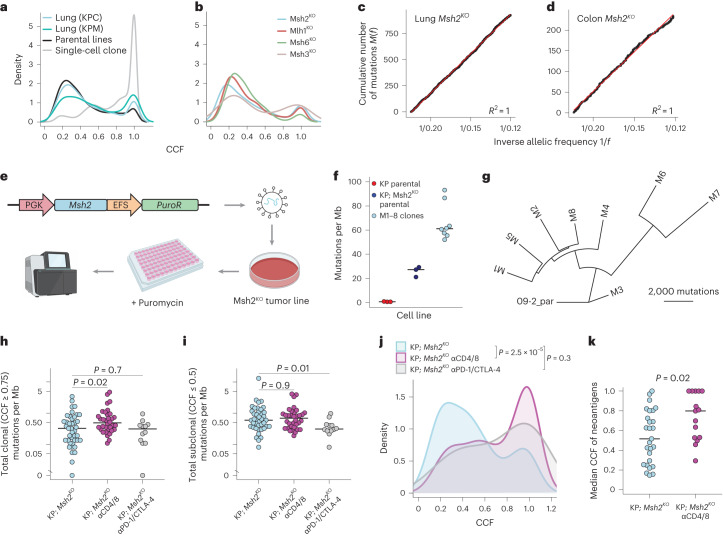
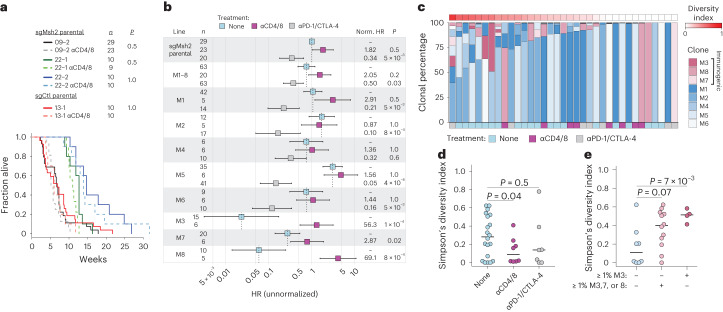
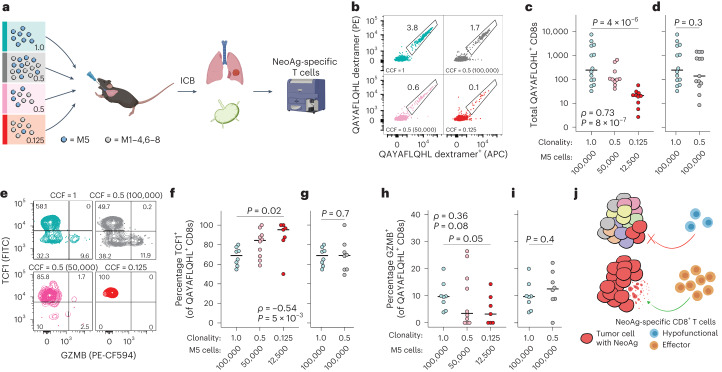
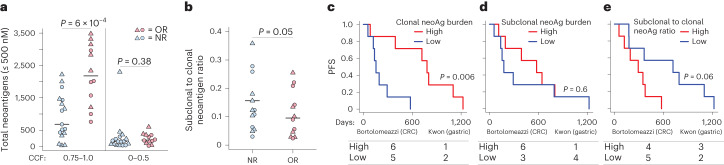
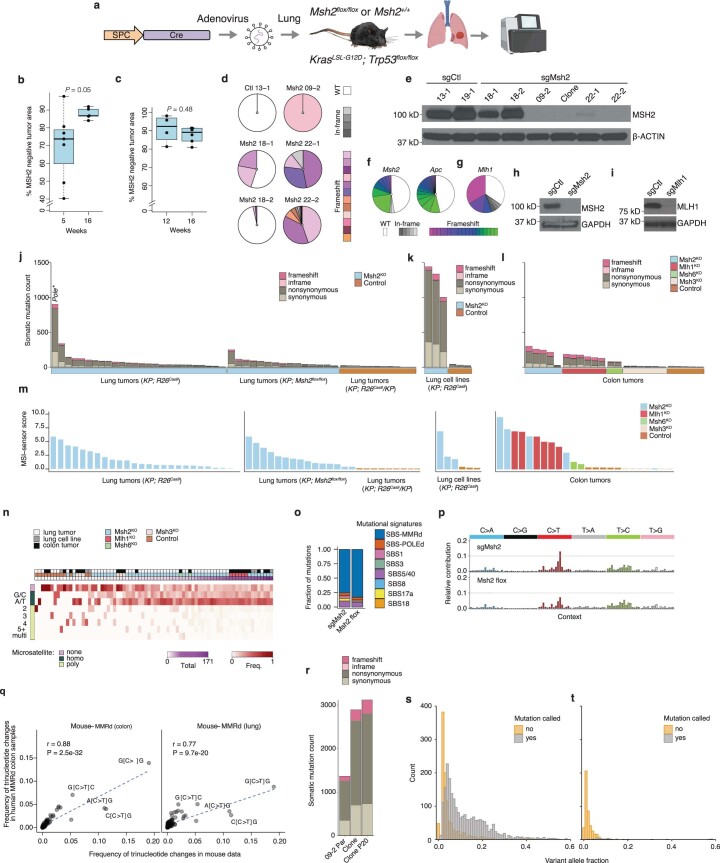
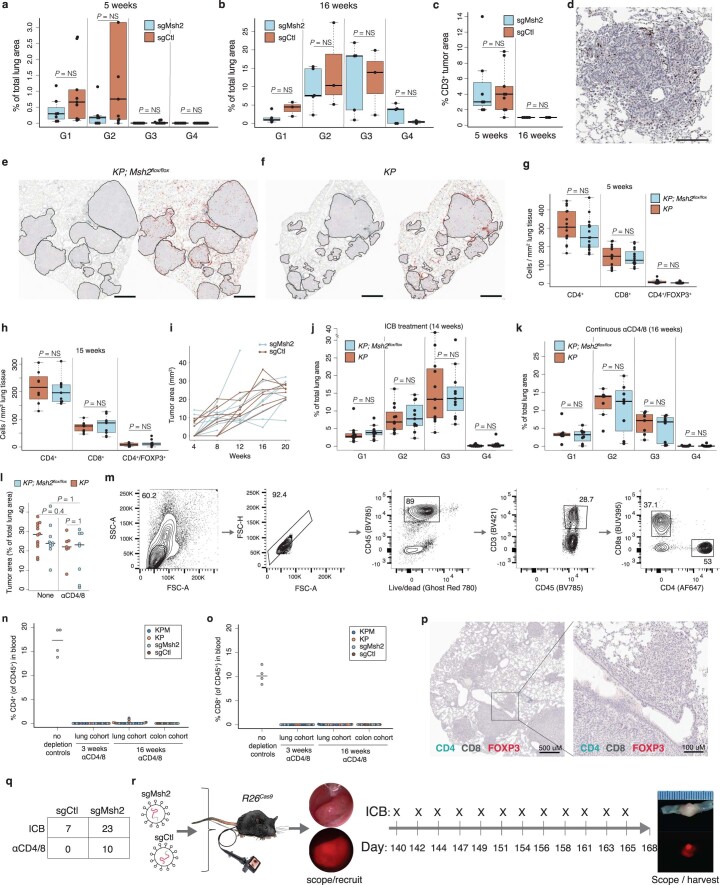
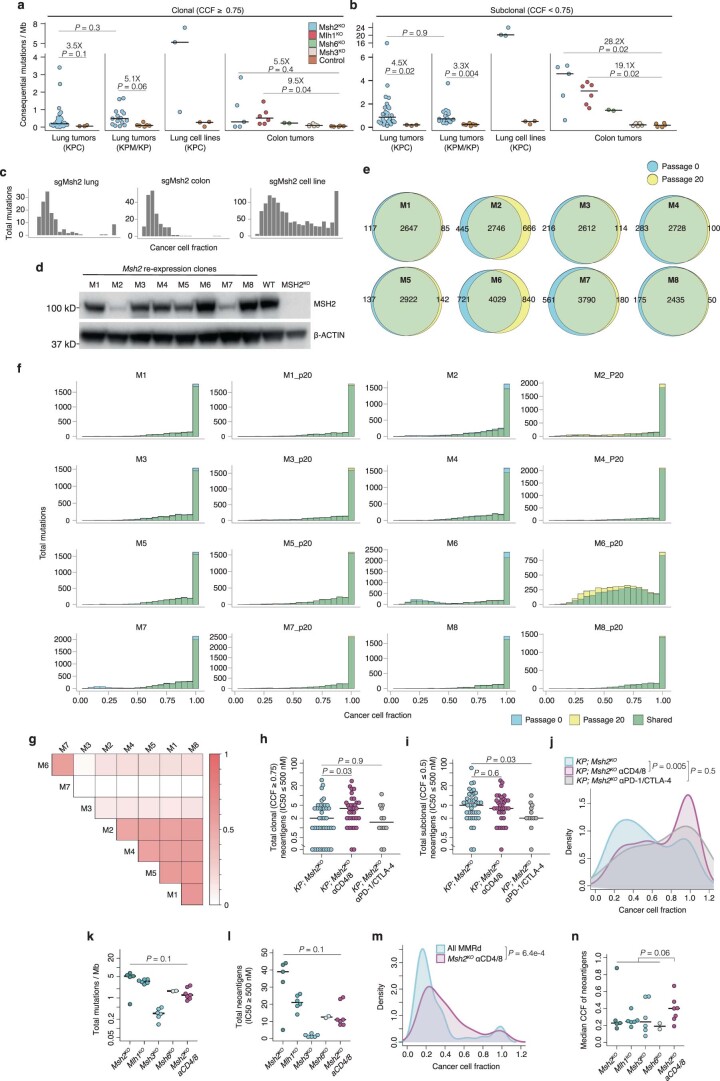
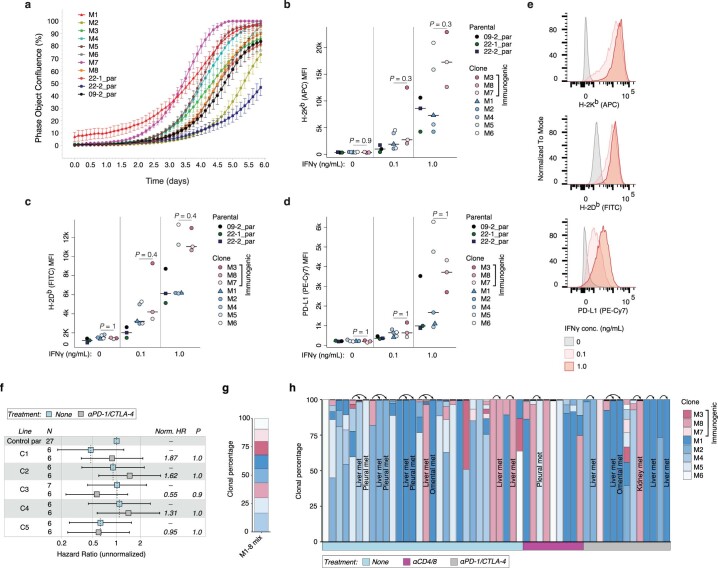
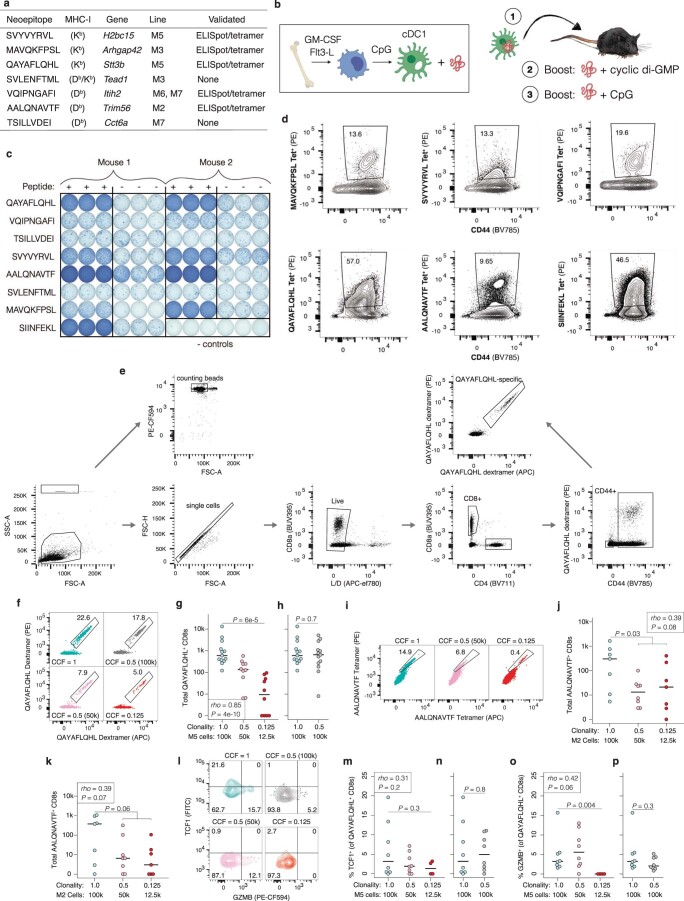
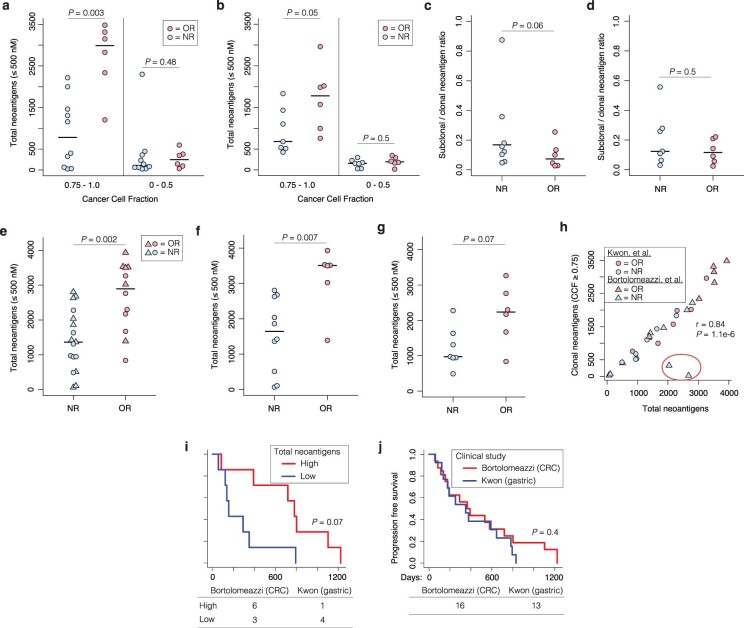
DNA mismatch repair deficiency (MMRd) is associated with a high tumor mutational burden (TMB) and sensitivity to immune checkpoint blockade (ICB) therapy. Nevertheless, most MMRd tumors do not durably respond to ICB and critical questions remain about immunosurveillance and TMB in these tumors. In the present study, we developed autochthonous mouse models of MMRd lung and colon cancer. Surprisingly, these models did not display increased T cell infiltration or ICB response, which we showed to be the result of substantial intratumor heterogeneity of mutations. Furthermore, we found that immunosurveillance shapes the clonal architecture but not the overall burden of neoantigens, and T cell responses against subclonal neoantigens are blunted. Finally, we showed that clonal, but not subclonal, neoantigen burden predicts ICB response in clinical trials of MMRd gastric and colorectal cancer. These results provide important context for understanding immune evasion in cancers with a high TMB and have major implications for therapies aimed at increasing TMB.


Conflict of interest statement

T.J. is a member of the Board of Directors of Amgen and Thermo Fisher Scientific, and a co-founder of Dragonfly Therapeutics and T2 Biosystems. He serves on the Scientific Advisory Board of Dragonfly Therapeutics, SQZ Biotech and Skyhawk Therapeutics, and is the President of Break Through Cancer. None of these affiliations represents a conflict of interest with respect to the design or execution of the present study or interpretation of data presented in this manuscript. The Jacks laboratory also currently receives funding from the Johnson & Johnson Lung Cancer Initiative and the Lustgarten Foundation for Pancreatic Cancer Research, but this did not support the research described in the present study. All other authors declare no competing interests.

Figures

Fig. 1
Fig. 1. Development of flexible in vivo models of DNA MMRd lung and colon cancer.
a,b, Schematic of lentiviral constructs and mouse strains used to induce MMRd lung (a) and colon (b) tumors for WES and in vitro analyses. c,d, H&E-stained and MSH2 IHC of sgMsh2- (top) and sgCtl-targeted (bottom) lung (c) and colon (d) tumors 16 weeks post-initiation, representing ten animals each. Scale bar, 1 mm. e, Total consequential mutations: nonsynonymous SNVs and indels per Mb of DNA for autochthonous lung tumors and cell lines and autochthonous colon tumors, with fold-change shown for each comparison. f, Frequency of indels from −10 nt to 10 nt across all sequenced autochthonous tumors and parental cell lines, including exonic and intronic mutations. Samples were ordered by total indels. g,h, COSMIC mutational signature analysis of human MMRd colon and the mouse MMRd colon and lung tumors (g) based on frequencies of the 96 possible SNVs classified by substitution and flanking 5′- and 3′-bases, with cosine similarity score (h). Lung Msh2KO, KrasLSL-G12D; Trp53flox/flox(KP); Msh2floxl/flox and KP sgMsh2-targeted models combined. SBS_MRD, mismatch repair deficiency signature. Significance in e was assessed using Wilcoxon’s rank-sum test with Holm’s correction for multiple comparisons. Source data
Fig. 2
Fig. 2. MMRd models of lung and colon cancer are not immunogenic.
a,b, Percentage lung area occupied by tumors of grades 1–4 (G1–4) in KP; Msh2flox/flox (KPM) and KP models at 5 (a) and 15 weeks (b) post-initiation with Cre-expressing adenovirus (SPC-Cre), with 16 and 15 animals 5 weeks post-initiation and 10 and 12 animals 15 weeks post-initiation. Normal lung and tumors were quantified using an automated CNN developed with Aiforia. c,d, Representative H&E and CNN annotations of tumor-bearing lungs from KPM (c) and KP (d) animals in b. Yellow is for normal lung, red for G1, green for G2, blue for G3 and orange for G4. Scale bar, 5 mm. eg, IHC staining and Aiforia CNN quantification of T cell subsets in KPM and KP tumor-bearing lungs of animals in a and b. Representative IHC staining of lung tumor from an animal in b (left) with Aiforia CNN annotations (right) for CD4+ (green), CD8+ (yellow) and CD4+FOXP3+ Treg cells (purple) (e). Scale bar, 100 μm. CNN quantification of IHC staining within lung tumors from KPM and KP animals is shown at 5 (f) and 15 weeks (g) post-initiation. h,i, Preclinical trial design in KPM and KP models (h) and treatment arms (i). j, Change in solid lung volume as measured by μCT pre-treatment (10 weeks) and post-treatment (14 weeks). k, Lung tumor burden at necropsy (14 weeks) as measured by manual annotation of H&E-stained whole lung sections. l, Brightfield and fluorescent colonoscopy images of sgMsh2-targeted colon tumor, representing 16 animals. m, Change in colon tumor size by colonoscopy pre-treatment (20 weeks) and post-treatment (24 weeks) (n = 23 sgMsh2- and 7 sgCtl-targeted animals treated with ICB). n, Colon tumor burden at necropsy (24 weeks) as measured by stereomicroscopy (n = 23 sgMsh2- and 7 sgCtl-targeted animals treated with ICB (αPD-1/CTLA-4) and 10 sgMsh2-targeted animals treated continuously with T cell-depleting antibodies (αCD4/8)). Boxplots display median and interquartile range (IQR; box bounds), with whiskers extending to most extreme points (≤1.5× IQR) and all datapoints. Significance in a, b, f, g, k and n was assessed using Wilcoxon’s rank-sum test with correction for multiple comparisons in a, b, f, g and k. P values in n are uncorrected. Source data
Fig. 3
Fig. 3. MMRd models are defined by extensive ITH.
a,b, Distribution of CCF estimates of all SNVs in lung tumors, cell lines and clones M1–8 (a) and colon tumors (b). Smoothing was performed by Gaussian kernel density estimation. c,d, Cumulative distribution function of subclonal mutation evolution M(f), as described in Williams et al., for Msh2KO lung (c) and colon (d) tumors. M(f) = μ/β(1/f – 1/fmax), where f is the VAF/purity, μ the rate of somatic mutations and β the fraction of cell divisions where both lineages survive. Linear distribution of 1/f (red line) is consistent with a neutral model of evolution. e, Schematic of single-cell cloning workflow with re-expression of Msh2. f, Total mutations identified in ex vivo lung tumor-derived cell lines and clones, as mutations per Mb of DNA (n = 3 sgCtl, 3 sgMsh2 and 8 clonal lines (M1–8)). Par, parental cell line. g, Phylogenetic tree of clonal interrelationships of M1–8 clones, rooted on the parental line 09-2 and constructed using shared mutations with the parsimonious ratchet method. h,i, Total clonal (CCF ≥ 0.75) (h) and subclonal (CCF ≤ 0.5) (i) mutations per Mb in 16- to 20-week Msh2KO autochthonous lung tumors (Msh2flox- and sgMsh2-targeted models) from animals with no treatment (light blue, n = 41), continuous antibody-mediated T cell depletion (αCD4/8, magenta, n = 34) and 4 weeks of ICB (αPD-1/αCTLA-4, gray, n = 12). j,k, CCF distribution (j) and per tumor median (k) of all expressed SNV-derived neoantigens in lung tumors from h and i. The significance was assessed using the two-sided Kolmogorov–Smirnov test. Smoothing in a, b and j was performed by Gaussian kernel density estimation. The significance in h, i and k was assessed using Wilcoxon’s rank-sum test. P values in hj are uncorrected. Source data
Fig. 4
Fig. 4. ITH enables immune evasion of MMRd tumors.
a,b, Survival of syngeneic mice orthotopically transplanted via intratracheal instillation with indicated lung tumor cell lines and clones. a, Kaplan–Meier curves of mice transplanted with parental sgMsh2- and sgCtl-targeted parental lines, with and without continuous T cell depletion (αCD4/8: lighter shades and dotted lines). b, HRs for mice transplanted with parental sgMsh2 line (09-2), an equal mixture of M1–8 clones and individual M1–8 clones, with and without continuous αCD4/8 and ICB treatment. Norm. HR is normalized HR, which was calculated by dividing plotted HRs of each treatment group by the HR of the no treatment group (reference) for each line separately. Bars represent upper and lower 95% confidence intervals. c, Estimation of clonal percentages of M1–8 clones in lung tumors from animals transplanted with an equal mixture of all clones and receiving no treatment (n = 20), continuous αCD4/8 (n = 8) or ICB (n = 7). Clonal percentages were determined by targeted deep amplicon sequencing of four private SNVs per clone. Diversity is Simpson’s diversity index based on proportions of M1–8 clones present in tumors. d,e, Simpson diversity index of tumors between treatment groups (d) and across tumors containing no immunogenic clones, ≥1% M3, M7 or M8 or ≥1% M3 (e). ICB treatment in be was started 2 weeks post-transplantation and continued for 4 weeks. Shades of blue and red in c denote baseline (no treatment) nonimmunogenic and immunogenic lines, respectively, with otherwise no significant differences indicated by color. Significance in a and b was assessed using Cox’s proportional hazards regression with Holm’s correction for multiple comparisons of two hypotheses: no treatment versus αCD4/8 = 13 tests and no treatment versus αPD-1/CTLA-4 = 12 tests. Significance in d and e was assessed using Wilcoxon’s rank-sum test and uncorrected P values are shown. Source data
Fig. 5
Fig. 5. The quality of tumor-specific T cell response is tuned by neoantigen clonality.
Flow cytometric analyses of M5 clone neoantigen (QAYAFLQHL)-specific T cells isolated from lungs and mLNs of syngeneic mice intratracheally transplanted with M5 at different CCFs, diluted using M1–4,6–8 clones. Mice were treated with ICB (αPD-1/CTLA-4) for 2 weeks starting 2 weeks post-transplantation. Light blue shows CCF = 1 (100,000 M5 cells), n = 14 animals; gray shows CCF = 0.5 (100,000 M5 + 100,000 M1–4,6–8 mixed cells), n = 13 animals; pink shows CCF = 0.5 (50,000 M5 + 50,000 M1–4,6–8 mixed cells), n = 10 animals; and red shows CCF = 0.125 (12,500 M5 + 87,500 M1–4,6-–8 mixed cells), n = 10 animals. a, Outline of experimental design. bd, Representative flow plot (b) and total QAYAFLQHL-specific CD8+ T cells (c and d) in mLNs as determined by MHC-I dextramer staining in two channels (PE and APC). ei, Representative flow plot (e) and quantification of percentage QAYAFLQHL-specific CD8+ T cells positive for TCF1+ (f and g) and GZMB+ (h and i) in mLNs. j, Proposed mechanism of failure of neoantigen (NeoAg)-specific T cells to delete subclonal targets. The colors of the tumor cells (left) represent distinct neoantigen profiles. Blue and orange T cells (right) represent poor versus productive effector differentiation, respectively. Significance in c, f and h was assessed using both Spearman’s rank correlation with a numeric x axis (CCF) and Wilcoxon’s rank-sum test (CCF = 1 versus 0.125 groups). The significance in d, g and i was assessed usong Wilcoxon’s rank-sum test. Samples with <10 QAYAFLQHL-specific CD8+ T cells detected during flow cytometric acquisition were excluded from analysis in fi. Source data
Fig. 6
Fig. 6. Clonal neoantigen burden is predictive of ICB response in human MMRd cancer.
Meta-analysis of neoantigen burden, clonality and response to anti-PD-1 treatment in clinical trials of MMRd gastric (Kwon trial, n = 13 patients) and colorectal (Bortolomeazzi trial, n = 16 patients) cancer. a,b, Total clonal (CCF = 0.75–1.0) and subclonal (CCF = 0–0.5) neoantigen burden (a) and subclonal to clonal neoantigen ratio (b) in patients with objective response (OR, partial or complete) versus nonresponse (NR). ce, PFS of patients in the upper versus lower quartiles of clonal neoantigen burden (c), subclonal neoantigen burden (d) and subclonal to clonal neoantigen ratio (e). Number of patients from each study in upper (high) and lower (low) quartiles is indicated under the plots. The significance in a and b was assessed using Wilcoxon’s rank-sum test and in ce using Cox’s proportional hazards regression with the clinical trial study as a covariate. Source data
Extended Data Fig. 1
Extended Data Fig. 1. Validation of in vivo DNA mismatch repair gene knockout.
(a) Schematic of KrasLSL-G12D; Trp53flox/flox; Msh2floxl/flox (KPM) lung tumor model. (b-c) Percent lung tumor area negative for MSH2 by IHC at 5- and 16-weeks post-initiation of KrasLSL-G12D; Trp53flox/flox; R26LSL-Cas9 (KPC) animals with sgMsh2 lentivirus (N = 7 5-week and 5 16-week animals) (b) and 12- and 16-weeks post-initiation of KPM animals (N = 4 12-week and 6 16-week animals) (c). (d) Deep sequencing of sgMsh2-targeted locus in cell lines derived from 16–20-week sgCtl- and sgMsh2-targeted lung tumors. WT = wild-type. (e) Western blot of MSH2 expression in lung tumor cell lines, experimentally replicated three times. Clone = 09-2 single cell clone. (f-g) Deep sequencing of Msh2, Apc (f) and Mlh1 (g) loci targeted in autochthonous colon tumors, representative of 5 sgMsh2- and 6 sgMlh1-targeted tumors. (h-i) Western blots of MSH2 (h) and MLH1 (i) expression in one organoid line each derived from sgCtl-, sgMsh2-, and sgMlh1-targeted colon tumors, experimentally replicated twice. (j-l) Total somatic single nucleotide variants (SNVs) and insertions/deletions (indels) within exome of autochthonous lung tumors (j), cell lines (k), and autochthonous colon tumors (l). Pole* = Pole S415R mutation. (m) MSIsensor-pro scores for tumors in (j-l). (n) Frequency of indels across DNA microsatellite contexts, including exonic and intronic mutations. Samples were ordered by total indels. Homo = homopolymer repeats ≥ 4 bases, 2-5 + = microsatellites with motifs of 2-5+ bases, and multi = microsatellites with multiple repetitive motifs. (o-p) COSMIC mutational signature decomposition of 15 KPM and 26 KPC (sgMsh2) lung tumors (o) based on frequencies of the 96 possible SNVs classified by trinucleotide context (p). SBS_MRD = DNA mismatch repair deficiency (MMRd) signature. (q) Pearson correlation of the fraction of mutations detected in each trinucleotide context between human and mouse MMRd datasets. (r) Total somatic SNVs/indels in exome of 09-2 lung tumor cell line and early- and 20-passage 09-2 single cell clone. (s-t) Total mutations in early-passage clone that are also supported in sequencing reads of 09-2 parental line (s) and an unrelated MMRp control line, 13-1 (t), with variant allele fraction on x-axis. Grey = official mutation calls; gold = not called. Significance in (b-c) was assessed by Wilcoxon Rank Sum test. Source data
Extended Data Fig. 2
Extended Data Fig. 2. Tumor kinetics and immunogenicity are unaffected by MMRd.
(a-b) Percent lung area occupied by tumor grades 1-4 (G1-4) in sgMsh2- and sgCtl-targeted KPC mice at 5- (a) and 16-weeks (b) post-initiation, representative of 7 and 9 5-week and 5 and 3 16-week animals, respectively. (c-d) Average lung tumor area of animals in (a-b) positive for CD3 (T cells) by immunohistochemistry (IHC) (c), with representative CD3 IHC of an sgMsh2-targeted lung tumor (d). Scale bar = 200 μM. (e-h) IHC staining and Aiforia convoluted neural network (CNN) quantification of KPM and KP tumor-bearing lungs of animals in Fig. 2a,b. Stained 15-week KPM (e) and KP (f) tumor-bearing lungs (left panel) with Aiforia CNN annotations (right panel) for CD4+ (red), CD8+ (blue), and CD4+FOXP3+ Tregs (yellow), with quantification across whole lungs in KPM and KP models at 5- (g) and 15-weeks (h) post-initiation. Tumors in (e-f) are outlined in black; scale bar = 1 mm. (i) Change in focal colon tumor area by longitudinal colonoscopy. N = 7 sgMsh2- and 7 sgCtl-targeted animals with 10 and 9 tumors, respectively. (j-l) Percent lung area occupied by G1-4 tumors in KPM and KP mice (from Fig. 2i) after 4 weeks of ICB treatment (j), at 16-weeks post-initiation with continuous αCD4/8 treatment (k), and overall lung tumor burden with no treatment versus continuous αCD4/8 at 14- and 16-weeks post-initiation, respectively (l). (m-o) Flow cytometric analysis of CD4+ and CD8+ T cells in peripheral blood of experimental animals following αCD4/8 treatment. Gating strategy (m). Percent of CD4+ (n) and CD8+ (o) T cells relative to total CD45+ cells. (p) CD4, CD8, and FOXP3 IHC of 16-week tumor-bearing lungs from animals treated continuously with αCD4/8. Animals in (n-p) are the same as αCD4/8-treated animals in (k) and (q). (q-r) Colon preclinical trial arms (q) and schematic (r). Boxplots display median, interquartile range (box bounds), whiskers extending to most extreme points (≤1.5X interquartile range), and all datapoints. Significance in (a-c, g-h, j-l) was assessed by Wilcoxon Rank Sum test with multiple test corrections. Source data
Extended Data Fig. 3
Extended Data Fig. 3. Immunoediting exacerbates intratumoral heterogeneity by pruning clonal but not subclonal neoantigens.
(a-b) Total consequential mutations (nonsynonymous SNVs and indels) per megabase (Mb) DNA for autochthonous lung tumors and cell lines and autochthonous colon tumors, separated by clonal (cancer cell fraction (CCF) ≥ 0.75) (a) and subclonal (CCF ≤ 0.75) (b), with fold-change shown for each comparison. (c) Histograms of total mutations by cancer cell fraction in a representative sgMsh2-targeted lung tumor, cell line, and colon tumor from Fig. 3a,b. (d) Western blot of MSH2 expression in single cell clones with Msh2 re-expression, after 20 passages with puromycin selection, experimentally replicated three times. WT = sgCtl-targeted cell line; MSH2KO = parental sgMsh2-targeted cell line (09-2). (e) Venn diagrams of mutation overlap between M1-8 clones sequenced at early passage (called passage 0 for convenience) and 20 passages later. (f) Histograms of total mutations by cancer cell fraction in M1-8 clones at passage 0 and 20. (g) Pairwise intersection map of mutations across M1-8 clones. Scale represents fraction of total mutations shared between each pair. (h-i) Total clonal (CCF ≥ 0.75) (h) and subclonal (CCF ≤ 0.5) (i) predicted neoantigens in lung tumors from Fig. 3g–j. (j) Distribution of cancer cell fraction estimates from Fig. 3i with sgMsh2-targeted Pole S415R mutant lung tumor removed. (k-l) Total mutations / Mb (k) and predicted neoantigens (l) in 16–20-week autochthonous MMRd colon tumors from animals with no treatment (blue shades, N = 5 Msh2KO, 6 Mlh1KO, 6 Msh3KO, 2 Msh6KO) and continuous antibody-mediated T cell depletion (αCD4/8, magenta, N = 7 Msh2KO). (m-n) CCF distribution (m) and per tumor median (n) of all SNV-derived neoantigens (no expression filter) in colon tumors from (j-k). Significance and smoothing in (i, l) were assessed by two-sided Kolmogorov-Smirnov test and Gaussian kernel density estimation, respectively. Significance in (a-b, h-i, k-l, n) was assessed by Wilcoxon Rank Sum test, with Holm correction for five comparisons in (a-b). P values in (h-j) are uncorrected. Source data
Extended Data Fig. 4
Extended Data Fig. 4. Clones re-expressing Msh2 grow similarly in vitro and are IFNγ responsive.
(a) In vitro growth kinetics of parental MSH2 knockout cell lines (09-2, 22-1, 22-2) and Msh2 re-expressing clones generated from 09-2 (M1-8), measured by live cell imaging with an IncuCyte S3. Bars represent standard deviation of eight replicates (wells). (b-e) Flow cytometric analysis of surface expression of MHC-I alleles H-2Kb (b) and H-2Db (c) and IFNγ-response gene PD-L1 (d) in cell lines from (a) following overnight stimulation with 0, 0.1, and 1.0 ng/mL IFNγ. MFI = mean fluorescence intensity. (e) Representative histograms of H-2Kb, H-2Db and PD-L1 expression in a clone (M3) from the experiment in (b-d). (f) Survival Hazard Ratios (HR) of syngeneic mice orthotopically transplanted via intratracheal instillation with clones (C1-5) derived from parental sgCtl-targeted line 13-1 (Msh2 WT), with and without ICB treatment. N = number of animals, P = P-value, Norm.HR = normalized HR. Bars represent upper and lower 95% confidence intervals. (g-h) Estimation of clonal frequencies of M1-8 clones in equimolar mixture of DNA (g) and lung tumors and associated metastases (denoted by arrows) from animals transplanted with an equal mixture of all clones and receiving no treatment, continuous αCD4/8, or ICB (h), as determined by targeted deep amplicon sequencing of 4 private SNVs per clone. ICB treatment in (f, h) was started 2-weeks post-transplant and continued for 4 weeks. Significance in (b-d) was assessed by Wilcoxon Rank Sum test with correction for 3 tests. Significance in (f) was assessed by Cox proportional hazards regression with Holm correction for 12 tests (other 7 tests shown in Fig. 4b). Source data
Extended Data Fig. 5
Extended Data Fig. 5. Identification and validation of bona fide MMRd-derived neoantigens.
(a) Somatic mutation-derived epitopes (neoepitopes) found to be presented on surface MHC-I (H2-Kb and H2-Db) in M1-8 clones by Tandem Mass Tag Mass Spectrometry. Immunogenicity was validated by IFNγ ELISpot and MHC-I tetramer staining. (b) Vaccine regimen to assess in vivo immunogenicity of neoepitopes. Conventional cross-presenting dendritic cells (cDC1s) were in vitro differentiated from bone marrow, activated, loaded with neoepitope peptide and injected intradermally into mice, which were boosted with two different adjuvants delivered with peptide over the course of the experiment (see Methods). (c-d) IFNγ ELISpot (c) and flow cytometric staining with neoepitope-loaded MHC-I tetramers (d) of splenocytes isolated from mice vaccinated with the indicated peptides. SIINFEKL = immunogenic peptide positive control; “- controls” = no peptide vaccination. (e) Flow cytometric gating strategy for analysis of neoantigen-specific CD8+ T cells in Fig. 5. (f-h) Representative flow plot (f) and total QAYAFLQHL-specific CD8+ T cells (g-h) in lungs from animals in Fig. 5 as determined by MHC-I dextramer staining in two channels (PE and APC). (i-k) Flow cytometric analyses of M2 clone neoantigen (AALQNAVTF)-specific T cells isolated from mLNs and lungs of syngeneic mice intratracheally transplanted with M2 at CCF = 1 (N = 7), 0.5 (N = 8), and 0.125 (N = 7), and treated with ICB for 2 weeks starting 2-weeks post-transplant. Representative flow plot (i) and total AALQNAVTF-specific CD8+ T cells in mLNs (j) and lungs (k) as determined by MHC-I tetramer staining in two channels (PE and APC). (l-p) Representative flow plot (l) and quantification of percent of QAYAFLQHL-specific CD8+ T cells positive for TCF1 (m-n) and GZMB (o-p) in lungs from animals in Fig. 5. Significance in (g, j-k, m, o) was assessed by both Spearman Rank Correlation with a numeric x-axis (CCF) and Wilcoxon Rank Sum test (CCF = 1 versus 0.125 groups). Significance in (h, n, p) was assessed by Wilcoxon Rank Sum test. Samples with < 10 QAYAFLQHL-specific CD8+ T cells were excluded from analysis in (m-p). Source data
Extended Data Fig. 6
Extended Data Fig. 6. Overall tumor neoantigen burden is imperfectly correlated with clonal burden and ICB response in human MMRd cancer.
(a-d) Total clonal (CCF = 0.75 to 1.0) and subclonal (CCF = 0 to 0.5) tumor neoantigen burden (TNB) (a-b) and ITH index (subclonal to clonal neoantigen ratio) (c-d) in patients with objective response (OR) versus nonresponse (NR) in separated analyses of Bortolomeazzi trial (a,c) and Kwon trial (b,d). (e-g) TNB, regardless of clonality, in combined analysis (e) and separated analyses of Bortolomeazzi (f) and Kwon (g) trials. (h) Pearson correlation of overall versus clonal TNB across both studies, with correlation outliers circled in red. (i-j) Progression free survival of patients separated by upper versus lower quartiles of overall TNB (i) and clinical study (j). Number of patients from each study is indicated under plots. Significance in (a-g) was assessed by Wilcoxon Rank Sum test, and in (i-j) was assessed by Cox proportional hazards regression, with clinical trial study as a covariate in (i). Source data

References

    1. Larkin J, et al. Five-year survival with combined nivolumab and ipilimumab in advanced melanoma. N. Engl. J. Med. 2019;381:1535–1546. - PubMed
    1. Le DT, et al. Mismatch repair deficiency predicts response of solid tumors to PD-1 blockade. Science. 2017;357:409–413. - PMC - PubMed
    1. Fradet Y, et al. Randomized phase III KEYNOTE-045 trial of pembrolizumab versus paclitaxel, docetaxel, or vinflunine in recurrent advanced urothelial cancer: results of >2 years of follow-up. Ann. Oncol. 2019;30:970–976. - PMC - PubMed
    1. Reck M, et al. Pembrolizumab versus chemotherapy for PD-L1–positive non–small-cell lung cancer. N. Engl. J. Med. 2016;375:1823–1833. - PubMed
    1. Diaz LA, et al. Pembrolizumab versus chemotherapy for microsatellite instability-high or mismatch repair-deficient metastatic colorectal cancer (KEYNOTE-177): final analysis of a randomised, open-label, phase 3 study. Lancet Oncol. 2022;23:659–670. - PMC - PubMed

Publication types

Supplementary concepts