Meta-Analysis
. 2023 Oct;55(10):1640-1650.
doi: 10.1038/s41588-023-01497-6. Epub 2023 Sep 14.

Genome-wide association meta-analysis identifies 17 loci associated with nonalcoholic fatty liver disease

Affiliations
Meta-Analysis

Genome-wide association meta-analysis identifies 17 loci associated with nonalcoholic fatty liver disease

Yanhua Chen et al. Nat Genet. 2023 Oct.

Abstract

Nonalcoholic fatty liver disease (NAFLD) is common and partially heritable and has no effective treatments. We carried out a genome-wide association study (GWAS) meta-analysis of imaging (n = 66,814) and diagnostic code (3,584 cases versus 621,081 controls) measured NAFLD across diverse ancestries. We identified NAFLD-associated variants at torsin family 1 member B (TOR1B), fat mass and obesity associated (FTO), cordon-bleu WH2 repeat protein like 1 (COBLL1)/growth factor receptor-bound protein 14 (GRB14), insulin receptor (INSR), sterol regulatory element-binding transcription factor 1 (SREBF1) and patatin-like phospholipase domain-containing protein 2 (PNPLA2), as well as validated NAFLD-associated variants at patatin-like phospholipase domain-containing protein 3 (PNPLA3), transmembrane 6 superfamily 2 (TM6SF2), apolipoprotein E (APOE), glucokinase regulator (GCKR), tribbles homolog 1 (TRIB1), glycerol-3-phosphate acyltransferase (GPAM), mitochondrial amidoxime-reducing component 1 (MARC1), microsomal triglyceride transfer protein large subunit (MTTP), alcohol dehydrogenase 1B (ADH1B), transmembrane channel like 4 (TMC4)/membrane-bound O-acyltransferase domain containing 7 (MBOAT7) and receptor-type tyrosine-protein phosphatase δ (PTPRD). Implicated genes highlight mitochondrial, cholesterol and de novo lipogenesis as causally contributing to NAFLD predisposition. Phenome-wide association study (PheWAS) analyses suggest at least seven subtypes of NAFLD. Individuals in the top 10% and 1% of genetic risk have a 2.5-fold to 6-fold increased risk of NAFLD, cirrhosis and hepatocellular carcinoma. These genetic variants identify subtypes of NAFLD, improve estimates of disease risk and can guide the development of targeted therapeutics.


Conflict of interest statement

Competing interests

The Regents of the University of Michigan and E.K.S. have a pending patent on the use of systems and methods for analysis of samples associated with NAFLD and related conditions. V.L.C. received grant funding from KOWA and AstraZeneca. J.J.C. and Vanderbilt University Medical Center receive research funding from NIH, IBM Watson Health, GE Healthcare and Theratechnologies. G.R.W. is a cofounder and equity shareholder in Quantitative Imaging Solutions, a company that provides consulting services for image and data analytics. G.R.W.’s spouse works for Biogen. Grants or contracts from NIH, Department of Defense (DoD) and Boehringer Ingelheim made payments to G.R.W.’s institution. G.R.W. received consulting fees from Pulmonx, Vertex, Janssen Pharmaceuticals, Pieris Therapeutics and Intellia Therapeutics. G.R.W. also received payments from Pulmonx for participation on a Data Safety Monitoring Board or Advisory Board. The remaining authors declare no competing interests.

Figures

Extended Data Fig. 1 |
Extended Data Fig. 1 |. GOLDPlus NAFLD measures meta-analysis study design.
Extended Data Fig. 2 |
Extended Data Fig. 2 |. European GOLDPlus NAFLD measures meta-analysis schematic.
Extended Data Fig. 3 |
Extended Data Fig. 3 |. Characteristics of GOLDPlus genome-wide significant variants in GOLD ancestry-based cohorts.
For each variant, the characteristics are shown for the GOLD ancestry-based analysis including: associated gene, NAFLD increasing effect allele (EA), effect allele frequency (EAF), effect/beta and 95% confidence interval (CI), Cochran’s Q heterogeneity I2 metric (HetSq) and heterogeneity P-value (HetPVal), EA P-value (P), and sample size (N). Results are for meta-analysis of GOLD European ancestry (red), African ancestry (blue), Hispanic ancestry (green), Chinese ancestry (purple), and all ancestries pooled (black). The estimates of the effect sizes (Beta) and 95% confidence interval in bidirectional testing within each ancestry and for all the ancestries combined were shown in the forest plots. The data underlying these plots are provided as Source Data.
Extended Data Fig. 4 |
Extended Data Fig. 4 |. Characteristics of GOLDPlus genome-wide significant variants in GOLD sex-specific cohorts.
For each variant, the characteristics are shown for the GOLD sex-specific analysis including: associated gene, NAFLD increasing effect allele (EA), effect allele frequency (EAF), effect/beta and 95% confidence interval (CI), Cochran’s Q heterogeneity I2 metric (HetSq) and heterogeneity P-value (HetPVal), EA P-value (P), and sample size (N). Results are for meta-analysis of GOLD cohort males (blue), females (red), and pooled sexes (black). The estimates of the effect sizes (Beta) and 95% confidence interval in bidirectional testing within each ancestry and for all the ancestries combined were shown in the forest plots. The data underlying these plots are provided as Source Data.
Extended Data Fig. 5 |
Extended Data Fig. 5 |. DEPICT analysis of biological enrichment of NAFLD associated variants.
Height of the bar represents the nominal −log10P-value of enrichment of GWAS associated genes with physiological systems, cells, and tissues. Dark orange shading represents statistical significance at false discovery rate (FDR) < 0.05. The data underlying these plots are provided as Source Data.
Extended Data Fig. 6 |
Extended Data Fig. 6 |. Two-sample Mendelian randomization analysis for casual associations between NAFLD associated variants and fibrosis/cirrhosis and esophageal varices.
a,b, Data represent the effect/beta and 95% confidence intervals for the inverse variance weighted (IVW) and MR-Egger analyses for (a) NAFLD exposure (GOLD cohort, n = 11 instruments) and K74:fibrosis/cirrhosis outcome (UKBB) (MR-Egger P-value = 1.88 × 10⁻³, IVW p-value = 8.65 × 10⁻⁵) and (b) NAFLD exposure (GOLD cohort, n = 11 instruments) and I85:esophageal varices outcome (UKBB) (MR-Egger P-value = 9.36 × 10⁻⁴, IVW P-value = 3.51 × 10⁻⁴). c,d, The crosshairs on the plots represent the effect and 95% confidence intervals for each SNP-NAFLD or SNP-outcome association for (c) NAFLD exposure (GOLD cohort, n = 10 instruments) and K74:fibrosis/cirrhosis outcome (UKBB) and (d) NAFLD exposure (GOLD cohort, n = 10 instruments) and I85:esophageal varices outcome (UKBB). The data underlying these plots are provided as Source Data.
Extended Data Fig. 7 |
Extended Data Fig. 7 |. Two-sample Mendelian randomization analysis for casual associations between BMI, waist circumference associated variants and NAFLD.
a,b, Data are presented as effect/beta and 95% confidence intervals for MR-Egger and inverse variance weighted (IVW) methods for (a) waist circumference GWAS (UKBB, n = 217 instruments) and GOLD cohort outcome (MR-Egger P-value = 3.6 × 10⁻², IVW P-value = 3.71 × 10⁻⁴) and (b) BMI GWAS (UKBB, n = 293 instruments) and GOLD cohort outcome (MR-Egger P-value = 0.02, IVW P-value = 1.02 × 10⁻⁷). c,d, The crosshairs on the plots represent the effect/beta and 95% confidence intervals for each SNP-NAFLD or SNP-outcome association for (c) waist circumference GWAS (UKBB, n = 211 instruments) and GOLD cohort outcome and (d) BMI GWAS (UKBB, n = 283 instruments) and GOLD cohort outcome. The data underlying these plots are provided as Source Data.
Extended Data Fig. 8 |
Extended Data Fig. 8 |. Convolutional neural network schematic for UKBB MRI liver imaging (PCC values).
Scatter plot of predicted UKBB MRI-PDFF values versus ‘true’ UKBB MRI-PDFF values (as determined by Perspectum Diagnostics). a,b, Pearson correlation coefficients (PCC) are shown for (a) gradient echo image protocol and (b) IDEAL image protocol. The data underlying these plots are provided as Source Data.
Fig. 1 |
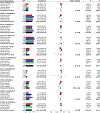
Fig. 1 |. Characteristics of a subset of GOLDPlus genome-wide significant variants in GOLD ancestry-based cohorts.
For each variant, the characteristics are shown for the GOLD ancestry-based analysis including associated gene, NAFLD increasing effect allele (EA), effect allele frequency(EAF), effect/beta (β) and 95% confidence interval (CI), Cochran’s Q heterogeneity I2 metric (HetSq) and heterogeneity P value (HetPVal), EA P value (P) and sample size (n). Results are for meta-analysis of GOLD European ancestry (red), African ancestry (blue), Hispanic ancestry (green), Chinese ancestry (purple) and all ancestries pooled (black). The estimates of the effect sizes (β) and 95% confidence interval in bidirectional testing within each ancestry and for all the ancestries combined were shown in the forest plots.
Fig. 2 |
Fig. 2 |. Effects of NAFLD-associated variants on other human diseases and traits using PheWAS clustering to identify distinct biological subgroupings.
A heatmap is used to show results from the subgrouping analysis in UKBB. Associations between NAFLD-associated variants (y axis) and diseases/traits (x axis) are shown as z scores. Red indicates that the NAFLD increasing allele has increased association with the disease/trait, blue indicates decreased association and white indicates no significant association. White horizontal bars between the heatmap subgroupings were used to separate each cluster. The horizontal bar atop the heatmap corresponds to the overall groupings of the disease/traits in the key. The subgroups are labeled Glucose, Insulin, Absorb, TG divert, Low lipid burn, Low output and High input to link to effects and biology. GI, gastrointestinal; LFT, liver function tests; TG, triglycerides; IFG-1, insulin-like growth factor 1; SHBG, sex hormone-binding globulin.
Fig. 3 |
Fig. 3 |. Effect of PheWAS subgroupings on human diseases and traits.
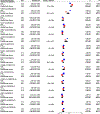
Forest plots show associations between each subgroup and human diseases and traits in the UKBB. The analyzed traits are serum LDL cholesterol (n = 321,191), serum TG (n = 390,616), serum HDL cholesterol (n = 358,767), ischemic heart disease (ncases = 30,566, ncontrols = 378,395), hypertension (ncases = 77,645, ncontrols = 331,316), BMI (n = 407,713), waist-hip ratio adjusted for BMI (n = 407,545), cholelithiasis (ncases = 14,371, ncontrols = 394,590), acute pancreatitis (ncases = 1,956, ncontrols = 407,005), glucose (n = 358,536), type 2 diabetes (ncases = 19,673), ncontrols = 389,288), C-reactive protein (n = 390,108), ALT (n = 390,812), liver fat PDFF (n = 3,963) and cirrhosis (ncases = 2,571, ncontrols = 406,390). Associations are presented as effect size and 95% confidence interval of the PRS on the traits noted. Effects are in s.d. for continuous traits and log odds ratio for disease outcomes of the top tertile or quartile versus the lowest tertile or quartile of risk. A vertical black line indicates an effect size of 0. Significant effects less than 0 are in blue (indicating that the liver-fat-promoting allele decreases the effect) and significant effect sizes greater than 0 are in red (indicating that the liver-fat-promoting allele increases the effect). Human diseases and traits with no significant effect are shown in black. LDL, low density lipoprotein; HDL, high density lipoprotein; WHR, waist to hip ratio; GI, gastrointestinal; ALT, alanine transaminase; PDFF, proton density fat fraction; TG, triglycerides.
Fig. 4 |
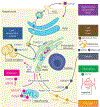
Fig. 4 |. Schematic providing biological context for PheWAS subgroupings.
Locations and functions are simplified for diagrammatic clarity. High/normal lipoprotein input (purple) includes APOE, an important component of VLDL and a ligand for the LDL receptor that helps internalize lipoproteins thereby increasing fat burden on the liver. Low lipoprotein output (dark blue) includes the PTPRD, TM6SF2 and PNPLA3 genes, which function to retain TG and other lipid derivatives to increase lipid load. Low lipid burn (brown) includes the IRX3/5 (FTO) cluster that reduces adipose tissue browning and fatty acid utilization, promotes obesity and likely indirectly promotes fatty liver. Insulin (gray) includes GRB14, SREBF1, INSR and PNPLA2 genes. GRB14 and SREBP1 may function in the hepatocyte through acetyl-CoA and de novo lipogenesis to increase lipid levels,. INSR and PNPLA2 may function in adipose to increase the release of fatty acids that can come to liver to increase lipid load, but direct effects on liver may also promote de novo lipogenesis,. Diversion (pink) includes TOR1B, ADH1B, MBOAT7, GPAM and MARC1 genes. TOR1B and ADH1B promote the storage of products of do novo lipogenesis and other lipid derivatives in lipid droplets and other cellular structures thereby increasing lipid load. MBOAT7, GPAM and MARC1 function in the mitochondria to possibly increase the production of TG and other phospholipids to increase lipid load. Absorption (green) includes the MTTP gene that acts in enterocytes (intestine) and hepatocytes (liver) to promote lipid uptake and in this way increase lipid load to the liver. Glucose (orange) includes GCKR and TRIB1 genes, which function in the hepatocyte to inappropriately increase glycolysis to make TG via de novo lipogenesis to increase lipid levels,. VLDL, very-low-density lipoprotein.
Fig. 5 |
Fig. 5 |. PheWAS Manhattan plot of NAFLD polygenic risk score.
Shown is the bidirectional PRS −log10 (P value) of association (y axis) with phecodes in MGI (x axis) using Firth’s logistic regression model. The blue line represents α = 0.05, and red line represents the Bonferroni-adjusted significance threshold (α = 3.02 × 10⁻⁵).
Fig. 6 |
Fig. 6 |. Associations between NAFLD polygenic risk score with NAFLD, cirrhosis and HCC in an independent cohort.
ac, Association between percentile of GOLDPlus NAFLD polygenic risk score on the independent MGI cohort on NAFLD (ncases = 3,021, ncontrols = 48,529; a), cirrhosis (ncases = 1,472, ncontrols = 50,078; b) or HCC (ncases = 295, ncontrols = 51,255; c). Data are presented as odds ratios and 95% confidence intervals. Associations are depicted as odds ratios for NAFLD, cirrhosis or HCC for the noted percentage relative to individuals in the 0–10th percentile of polygenic risk score, adjusted for sex, age, age2 and PCs 1–10.

References

    1. Lazo M et al. Prevalence of nonalcoholic fatty liver disease in the United States: the third National Health and Nutrition Examination Survey, 1988–1994. Am. J. Epidemiol. 178, 38–45 (2013). - PMC - PubMed
    1. Portillo Sanchez P et al. High prevalence of nonalcoholic fatty liver disease in patients with type 2 diabetes mellitus and normal plasma aminotransferase levels. J. Clin. Endocrinol. Metab. 100, 2231–2238 (2015). - PMC - PubMed
    1. Dongiovanni P et al. Causal relationship of hepatic fat with liver damage and insulin resistance in nonalcoholic fatty liver. J. Intern. Med. 283, 356–370 (2018). - PMC - PubMed
    1. Lauridsen BK et al. Liver fat content, non-alcoholic fatty liver disease, and ischaemic heart disease: Mendelian randomization and meta-analysis of 279 013 individuals. Eur. Heart J. 39, 385–393 (2018). - PubMed
    1. Stender S et al. Adiposity amplifies the genetic risk of fatty liver disease conferred by multiple loci. Nat. Genet. 49, 842–847 (2017). - PMC - PubMed

Publication types

MeSH terms

Substances

Grants and funding