. 2023 Nov;17(11):2035-2046.
doi: 10.1038/s41396-023-01475-0. Epub 2023 Sep 15.

Microbial metabolomic responses to changes in temperature and salinity along the western Antarctic Peninsula

Affiliations

Microbial metabolomic responses to changes in temperature and salinity along the western Antarctic Peninsula

H M Dawson et al. ISME J. 2023 Nov.

Abstract

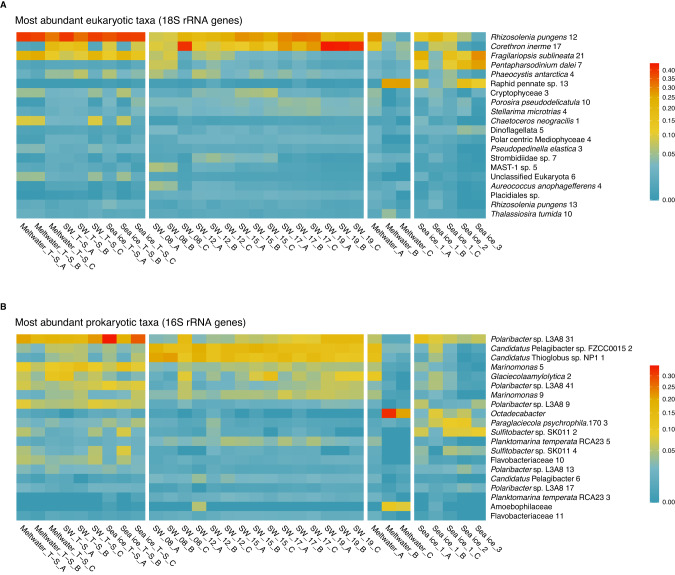
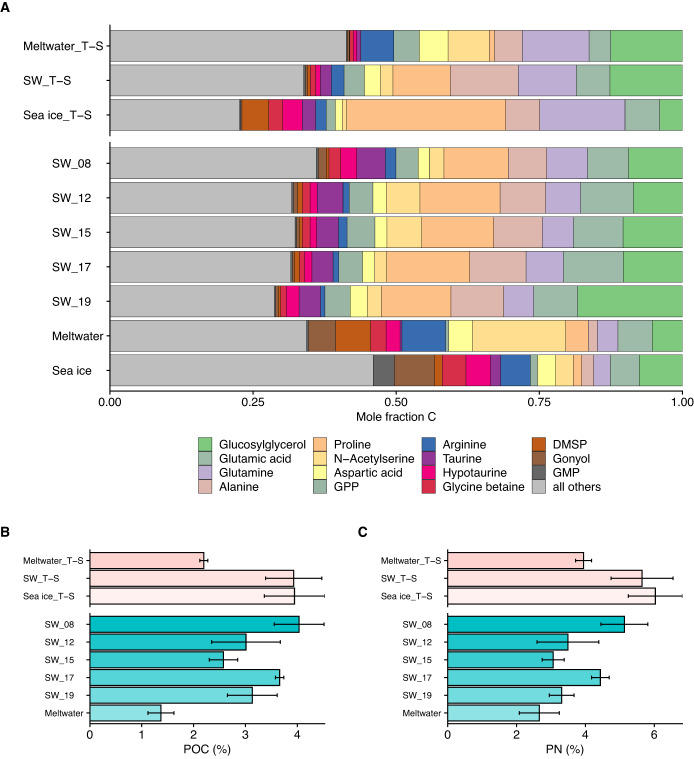
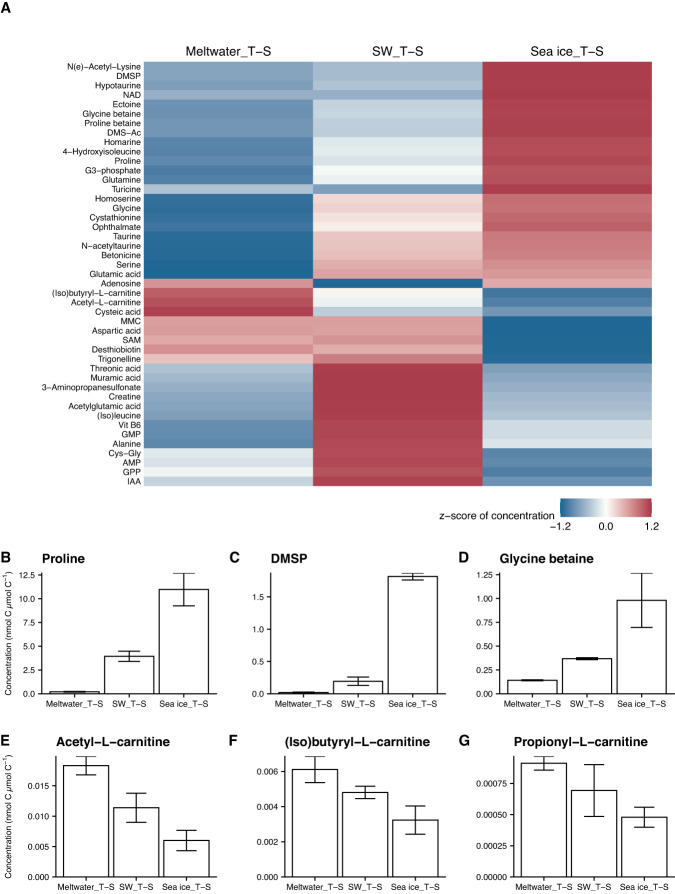
Seasonal cycles within the marginal ice zones in polar regions include large shifts in temperature and salinity that strongly influence microbial abundance and physiology. However, the combined effects of concurrent temperature and salinity change on microbial community structure and biochemical composition during transitions between seawater and sea ice are not well understood. Coastal marine communities along the western Antarctic Peninsula were sampled and surface seawater was incubated at combinations of temperature and salinity mimicking the formation (cold, salty) and melting (warm, fresh) of sea ice to evaluate how these factors may shape community composition and particulate metabolite pools during seasonal transitions. Bacterial and algal community structures were tightly coupled to each other and distinct across sea-ice, seawater, and sea-ice-meltwater field samples, with unique metabolite profiles in each habitat. During short-term (approximately 10-day) incubations of seawater microbial communities under different temperature and salinity conditions, community compositions changed minimally while metabolite pools shifted greatly, strongly accumulating compatible solutes like proline and glycine betaine under cold and salty conditions. Lower salinities reduced total metabolite concentrations in particulate matter, which may indicate a release of metabolites into the labile dissolved organic matter pool. Low salinity also increased acylcarnitine concentrations in particulate matter, suggesting a potential for fatty acid degradation and reduced nutritional value at the base of the food web during freshening. Our findings have consequences for food web dynamics, microbial interactions, and carbon cycling as polar regions undergo rapid climate change.


Conflict of interest statement

The authors declare no competing interests.

Figures

Fig. 1
Fig. 1. General parameters for incubation and field samples.
A Specific growth rate (day–1) in incubated samples based on exponential change in Chl a fluorescence (during days 5–9 for Meltwater_T-S and Seawater_T-S, and days 6–10 for Sea ice_T-S) and in POC (days 6–10) for the seawater field samples; B concentration of particulate organic carbon (POC in μM C); and C molar ratio of C:N. Error bars represent standard deviation of the mean (n = 3). For all plots, y-axis break separates incubation treatment samples on the top (pink) and field samples on the bottom (aqua). Growth curves used to generate specific growth rate are provided in Fig. S1a and b; full data are available in Table S4. Note that we do not have POC or C:N measurements to pair with sea-ice field samples.
Fig. 2
Fig. 2. Alpha diversity in incubation and field samples.
Inverse Simpson indices of alpha diversity for (A) the eukaryotic community and (B) the prokaryotic community in both incubation (pink) and field (aqua) samples. In the box plots, the total data range, median, and the 25–75% quartile range (box) are shown. For all plots, y-axis break separates incubation treatment samples on the top and field samples on the bottom.
Fig. 3
Fig. 3. Community composition of incubation and field samples.
Color-scaled relative abundance of the 20 most abundant (A) eukaryotic (18S) closest completed genomes (CCGs) and closest estimated genomes (CEGs) and (B) prokaryotic (16S) CCGs and CEGs. Vertical white spaces between samples separate incubation samples for all sample types (left) from field samples by sample type; sample designations _A, _B and _C indicate triplicate samples. Distinct ASVs assigned the same taxonomic name are differentiated by a number following the name (e.g. Rhizosolenia pungens 12 versus Rhizosolenia pungens 13). Note that the color bars have a square root transformation. Full data available in Tables S5 and S6.
Fig. 4
Fig. 4. Multidimensional structure of community and metabolite composition in incubation and field samples.
Non-metric dimensional scaling (NMDS) ordination, using Bray-Curtis dissimilarities, comparing (A) the eukaryotic (18S) composition and (B) the prokaryotic (16S) composition of each sample. C Procrustes analysis, where points represent individual samples, line connections between points represent eukaryotic and prokaryotic community composition from the same sample, and longer lines indicate greater within-sample dissimilarity between eukaryotic and prokaryotic community structure. D NMDS ordination, using Euclidean distance, comparing the metabolite composition of each sample. Metabolite concentrations (of 134 metabolites) are scaled to mole fraction of carbon. A version of this figure excluding metabolites that were added as part of f/2 nutrients (Cyanocobalamin and Vitamin B1) is available in Fig. S14). Colors indicate sample type. Full data for 18S, 16S, and metabolites are provided in Tables S5, S6, and S11, respectively.
Fig. 5
Fig. 5. Metabolite composition of particulate matter in incubation and field samples.
A Metabolite abundance presented as mole fraction of carbon of total identified metabolites [134] across the incubation and field samples. Average of triplicates are shown. The most abundant 15 molecules for each sample are color-coded, with “all others” (gray) containing the sum of the remaining quantified metabolites [119]. Total quantified metabolite concentration as the percentage of (B) particulate organic carbon (POC) and (C) particulate nitrogen (PN), where error bars represent standard deviation of the mean (n = 3). For all plots, y-axis break separates incubation treatment samples on the top and field samples on the bottom. For (B) and (C), color denotes incubation (pink) versus field (aqua) samples. Full data available in Table S11; individual metabolite contributions as %POC and %PN, available in Figs. S8 and S9, respectively. Note that we do not have POC or PN to pair with sea-ice field samples.
Fig. 6
Fig. 6. Particulate metabolite responses to temperature and salinity change during the incubation experiments.
A Heat map color-coded by z-score standardized concentrations of 134 metabolites (nmol metabolite C µmol C–1), arranged by average linkage hierarchical clustering of Euclidean distance (dendrogram of clustering available in Fig. S11), for the three different treatments. Compounds listed were each significantly different (p < 0.05) with treatment, as determined by false discovery rate-corrected p values from one-way ANOVAs (detailed in Table S16); compounds not significantly different (p > 0.05) are available in Fig. S12. Concentration (nmol metabolite C µmol C–1) of compatible solutes in the incubations, grouped by treatment, for (B) proline, (C) DMSP, and (D) glycine betaine, and of acylcarnitines for (E) acetyl-L-carnitine, (F) Isobutyryl-L-carnitine, and (G) Propionyl-L-carnitine. Error bars represent standard deviation of the mean (n = 3).

References

    1. Meredith MP, King JC. Rapid climate change in the ocean west of the Antarctic Peninsula during the second half of the 20th century. Geophys Res Lett. 2005;32:1–5.
    1. Arrigo KR, van Dijken G, Pabi S. Impact of a shrinking Arctic ice cover on marine primary production. Geophys Res Lett. 2008;35:1–6.
    1. Arrigo KR, Perovich DK, Pickart RS, Brown ZW, van Dijken GL, Lowry KE, et al. Phytoplankton blooms beneath the sea ice in the Chukchi sea. Deep Res Part II Top Stud Oceanogr. 2014;105:1–16.
    1. Cape MR, Vernet M, Pettit EC, Wellner J, Truffer M, Akie G, et al. Circumpolar deep water impacts glacial meltwater export and coastal biogeochemical cycling along the west Antarctic Peninsula. Front Mar Sci. 2019;6:1–23.
    1. Swart NC, Gille ST, Fyfe JC, Gillett NP. Recent Southern Ocean warming and freshening driven by greenhouse gas emissions and ozone depletion. Nat Geosci. 2018;11:836–41.

Publication types

Substances