. 2023 Oct;5(10):1673-1684.
doi: 10.1038/s42255-023-00889-6. Epub 2023 Sep 14.

Human GLP1R variants affecting GLP1R cell surface expression are associated with impaired glucose control and increased adiposity

Affiliations

Human GLP1R variants affecting GLP1R cell surface expression are associated with impaired glucose control and increased adiposity

Wenwen Gao et al. Nat Metab. 2023 Oct.

Abstract

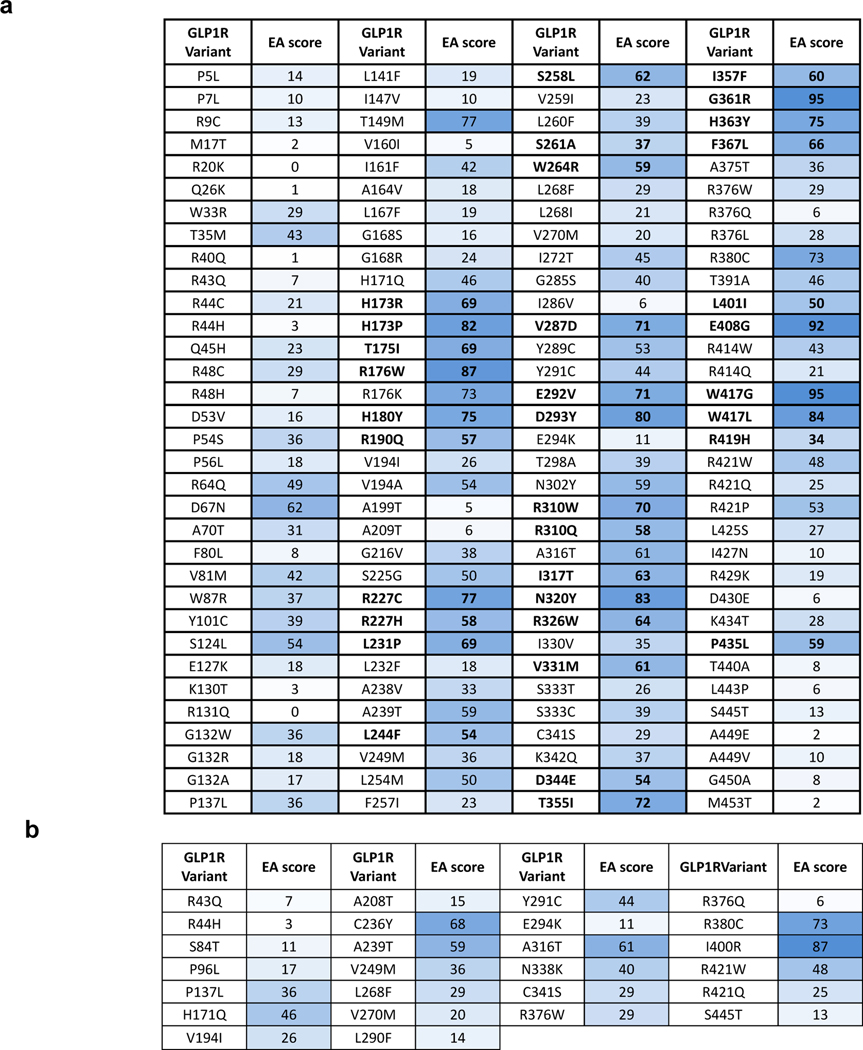
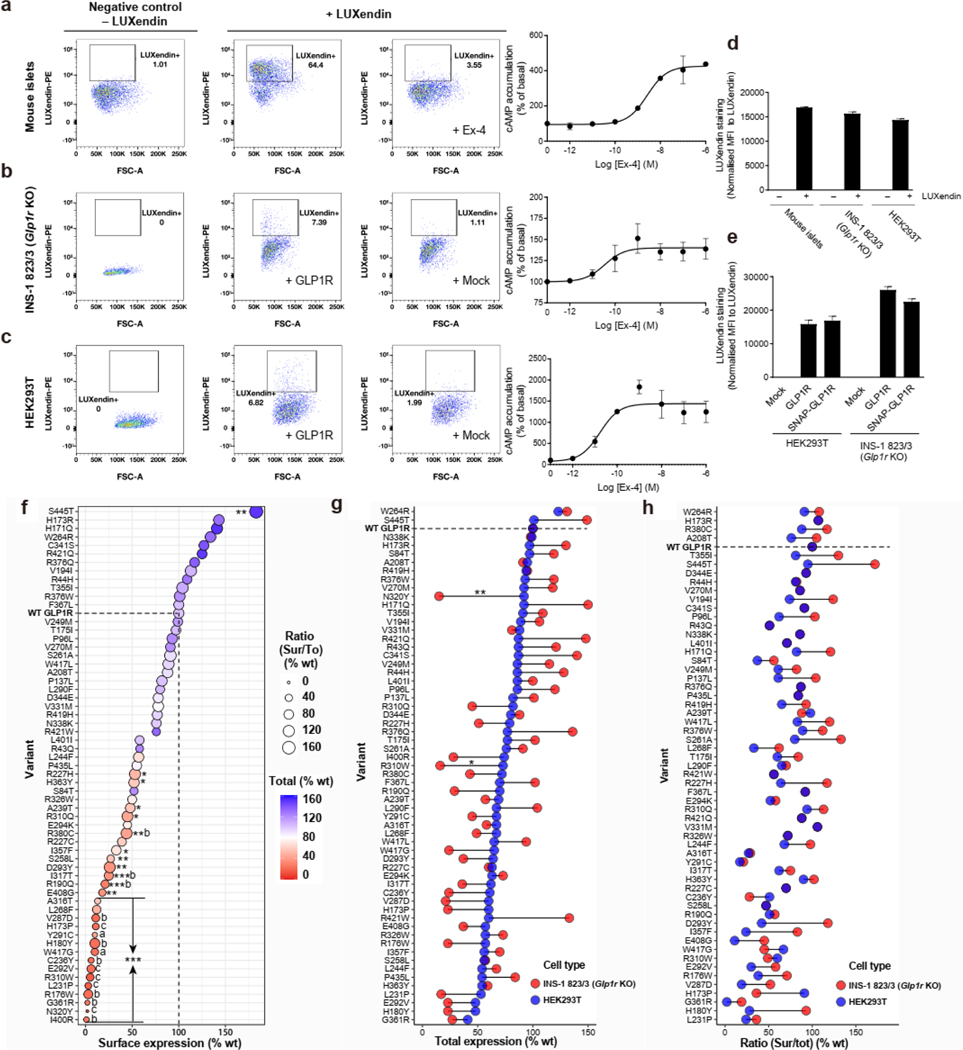
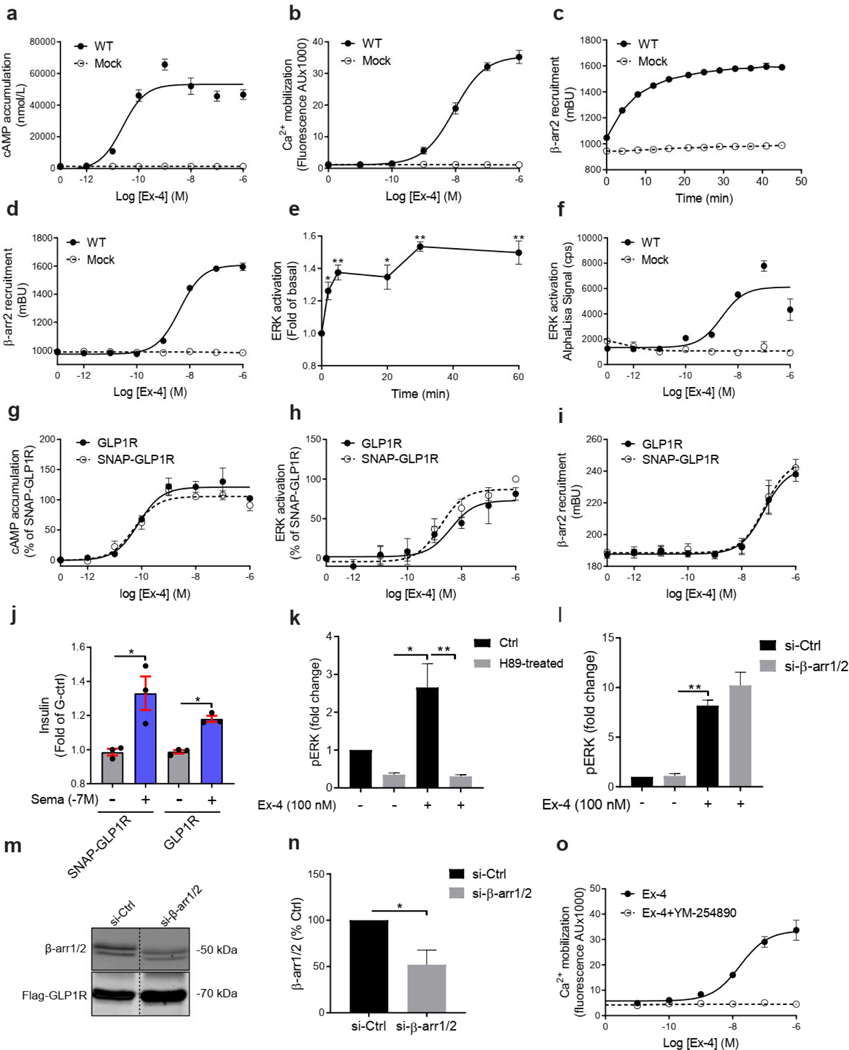
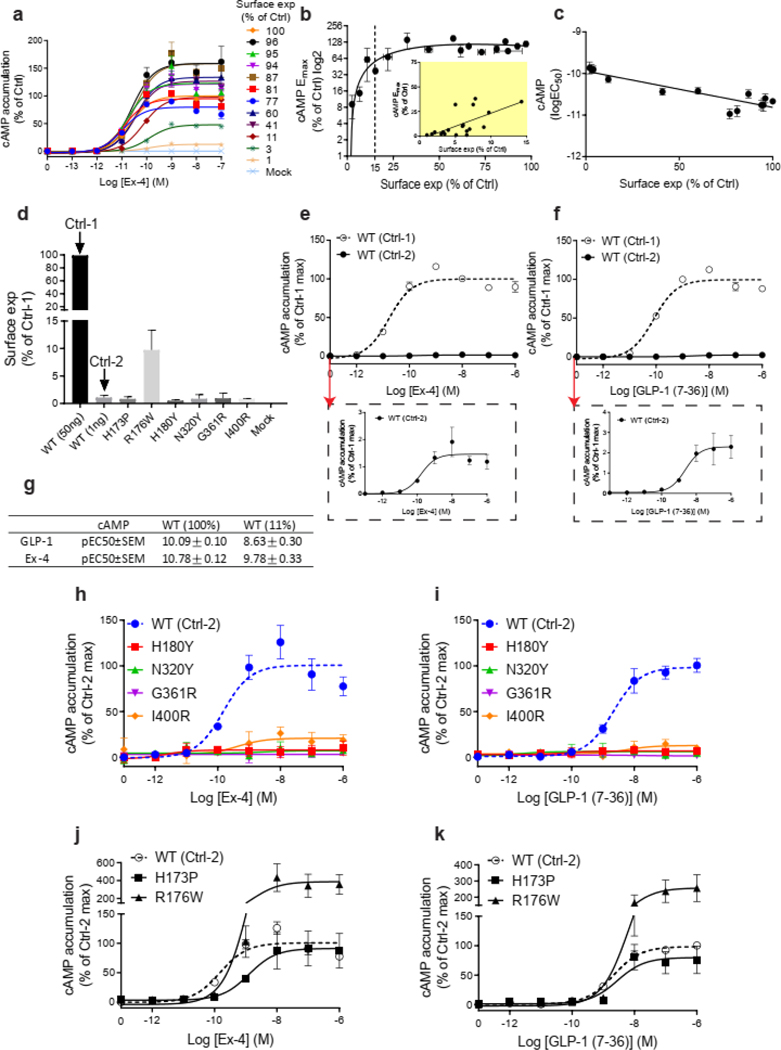
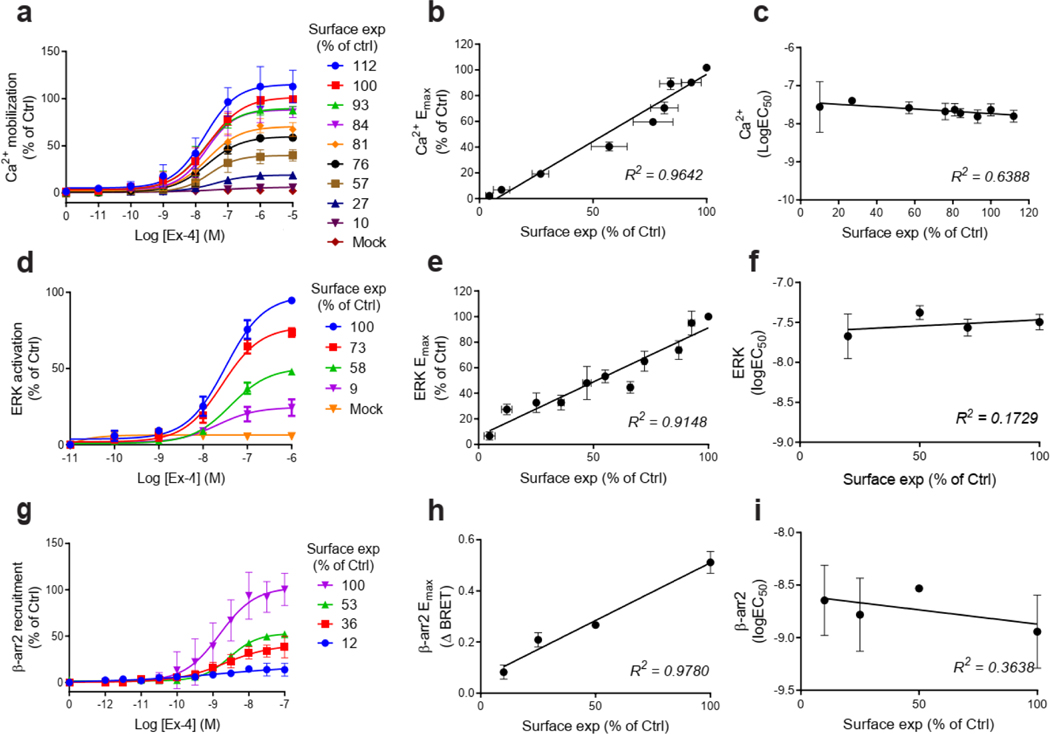
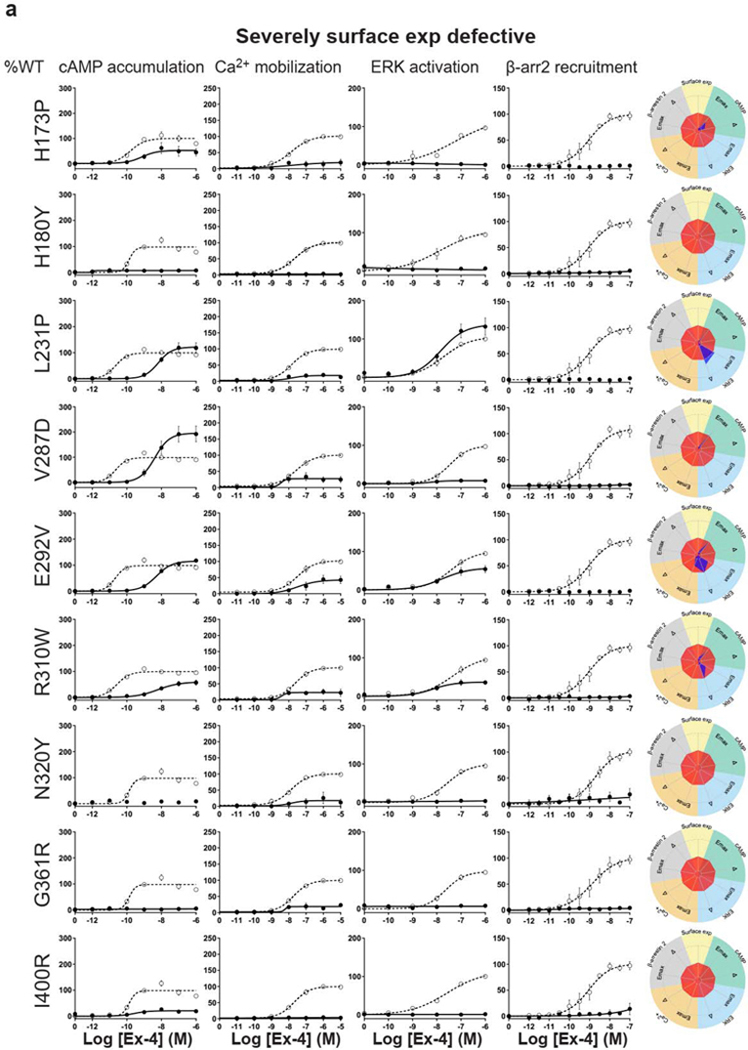
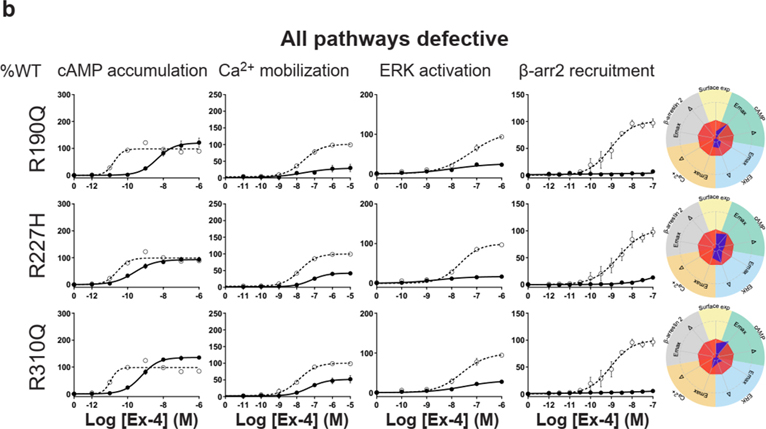
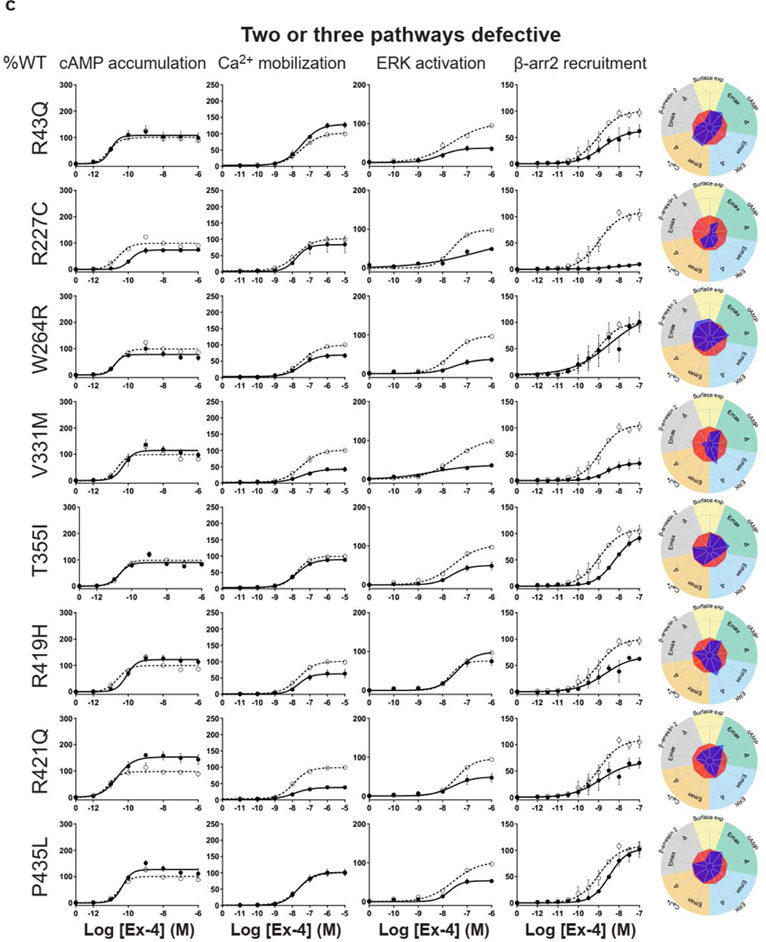
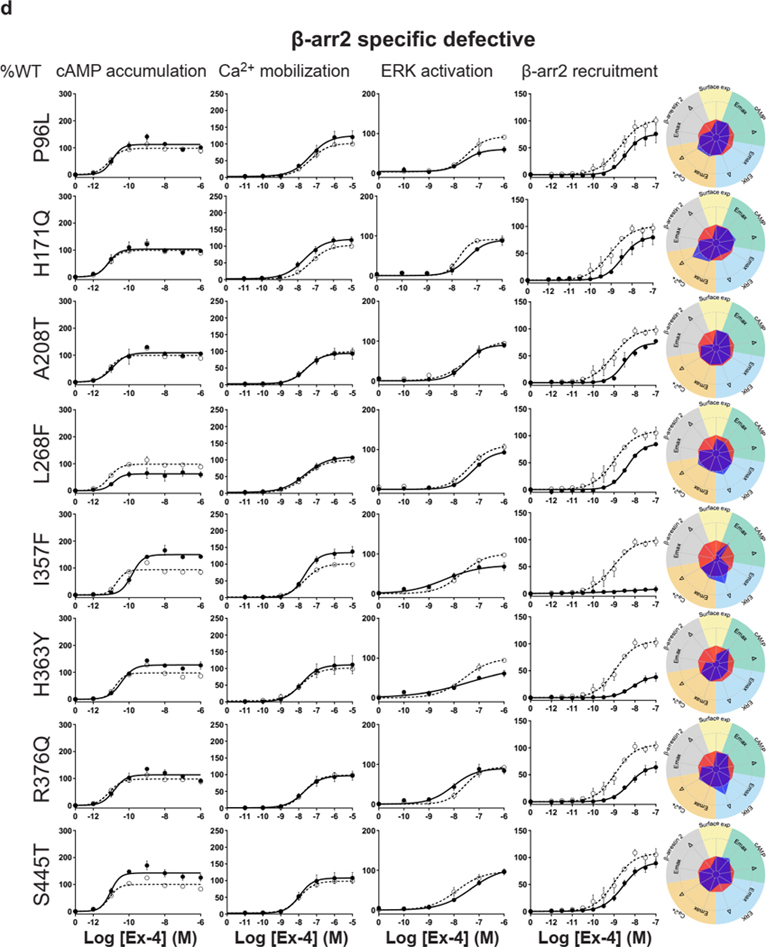
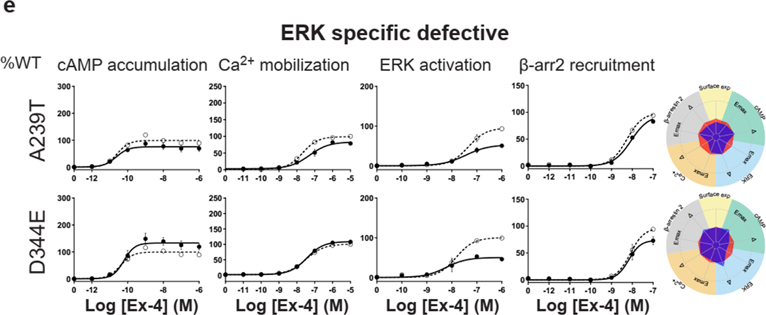
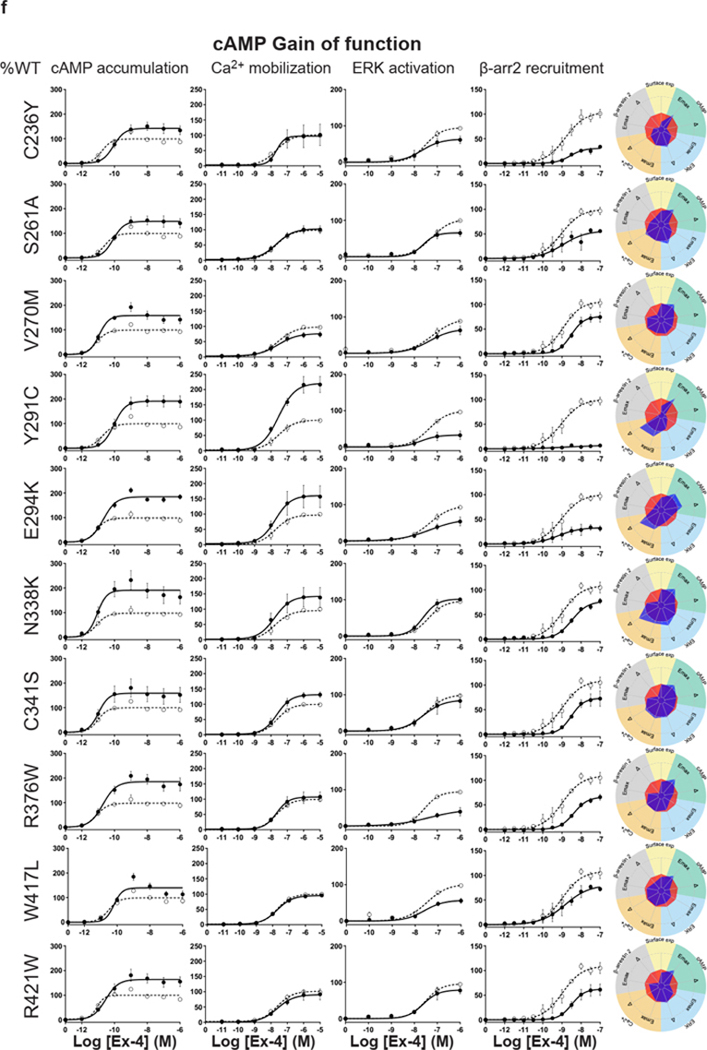
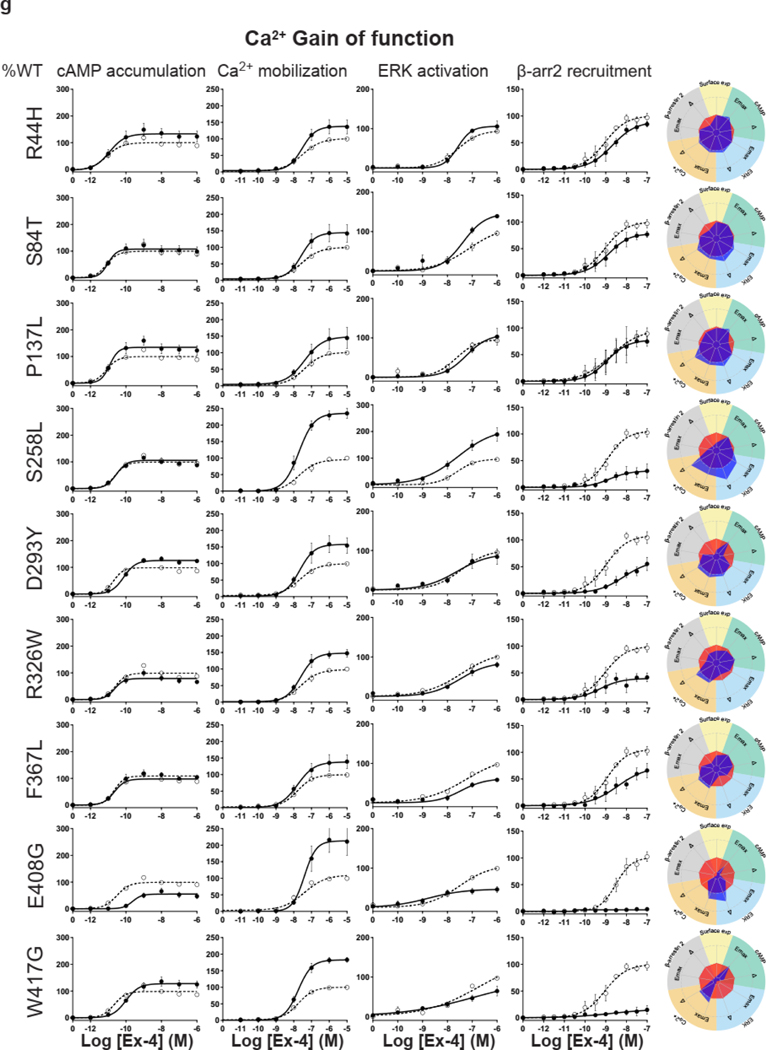
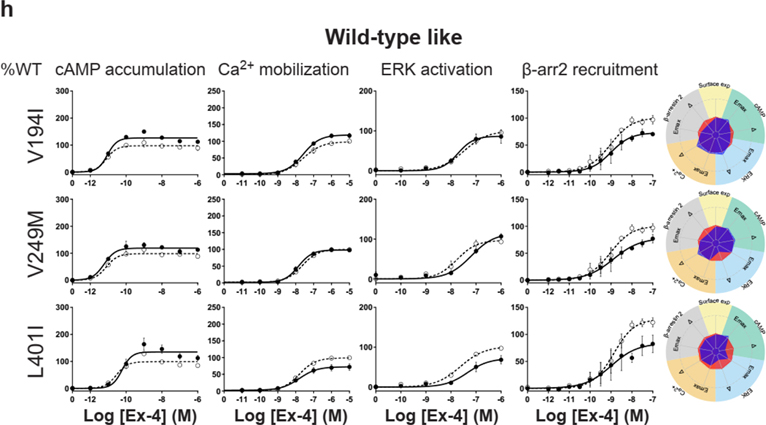
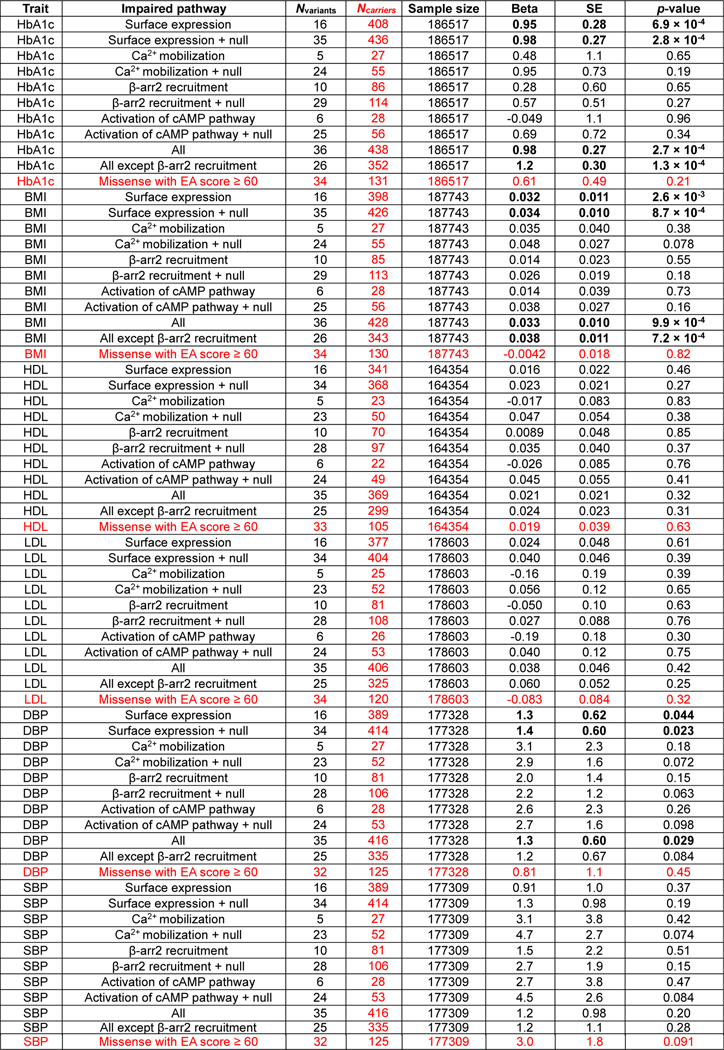
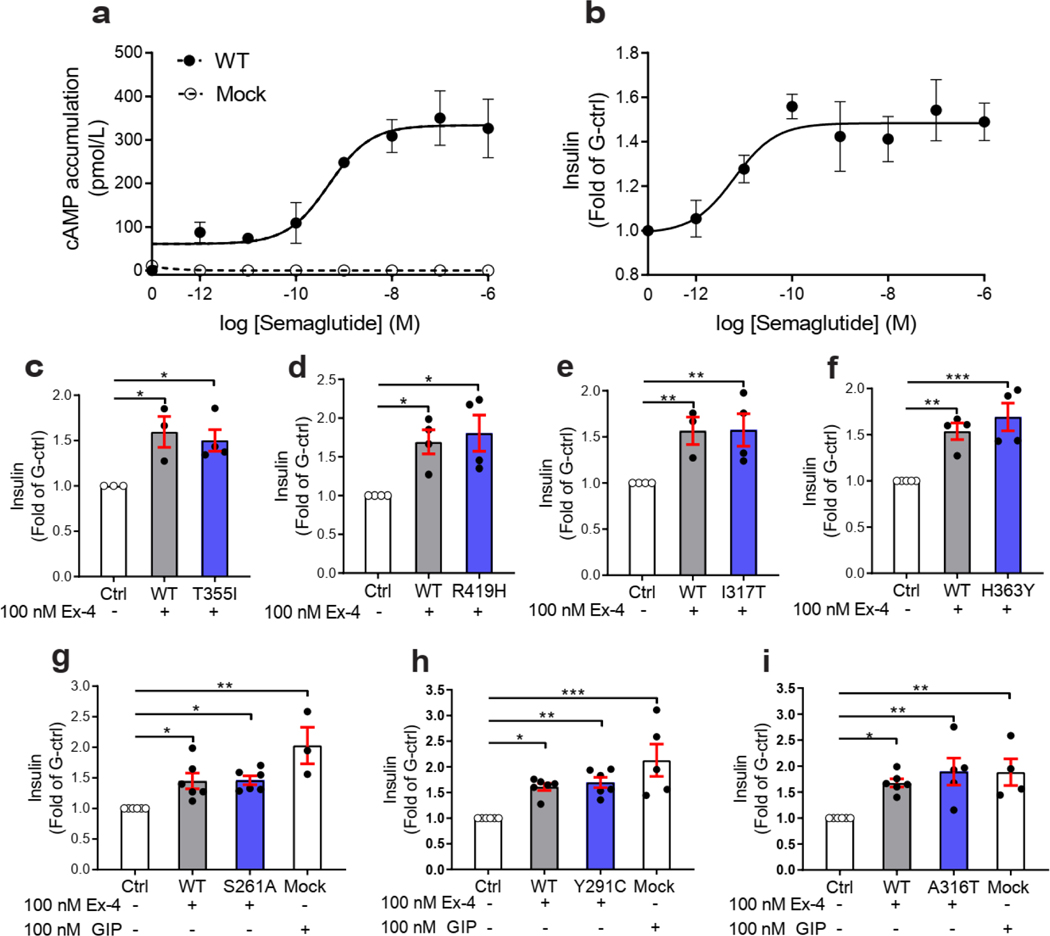
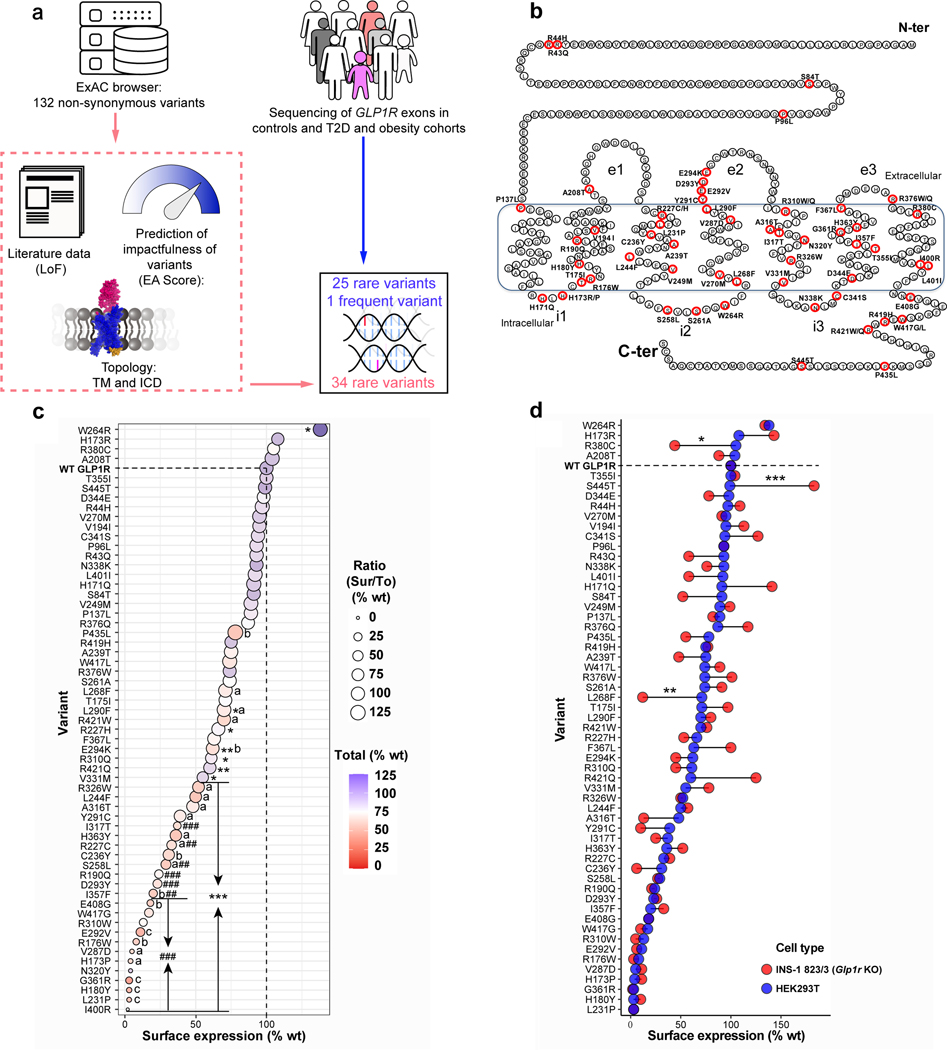
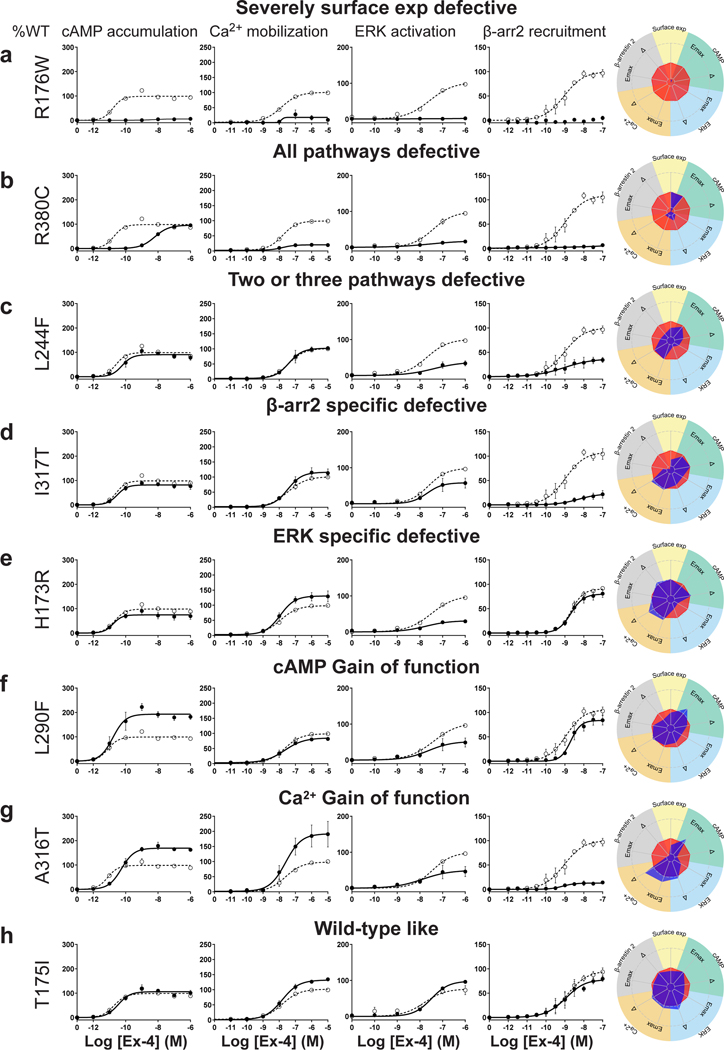
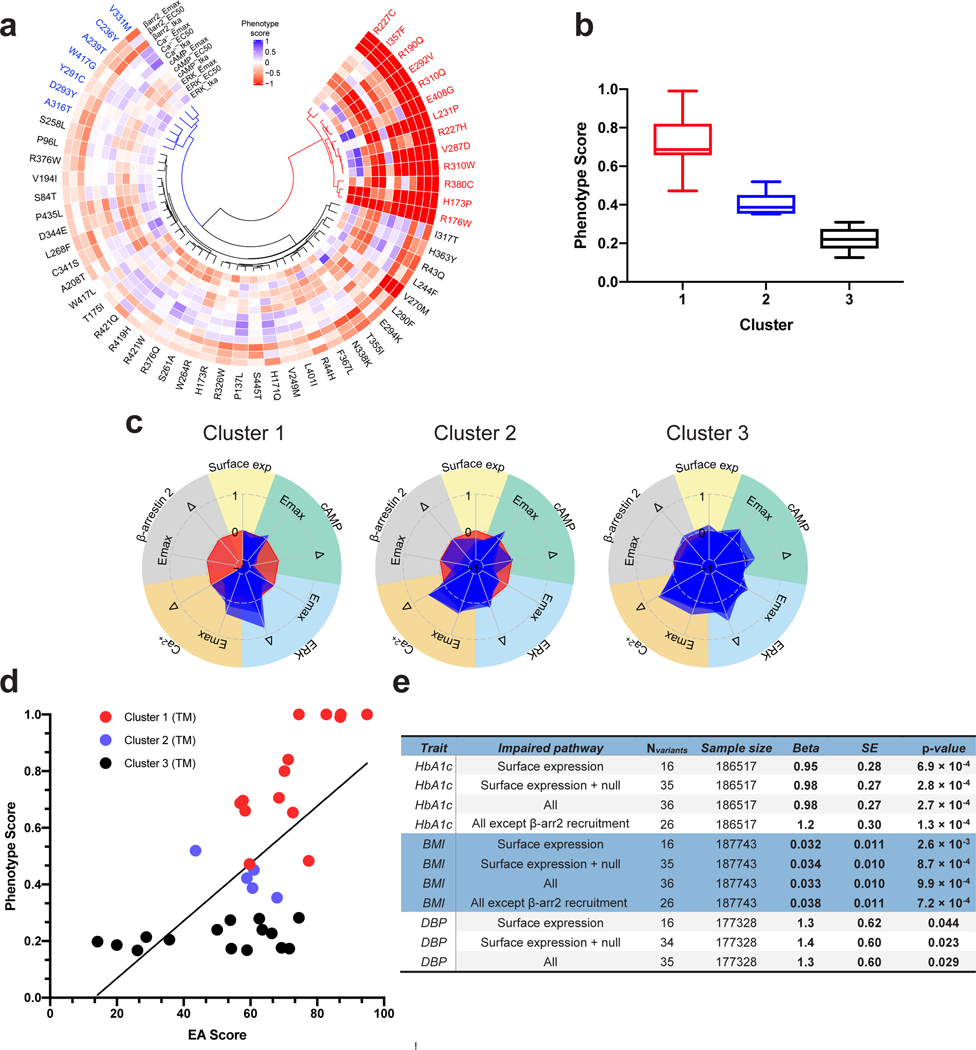
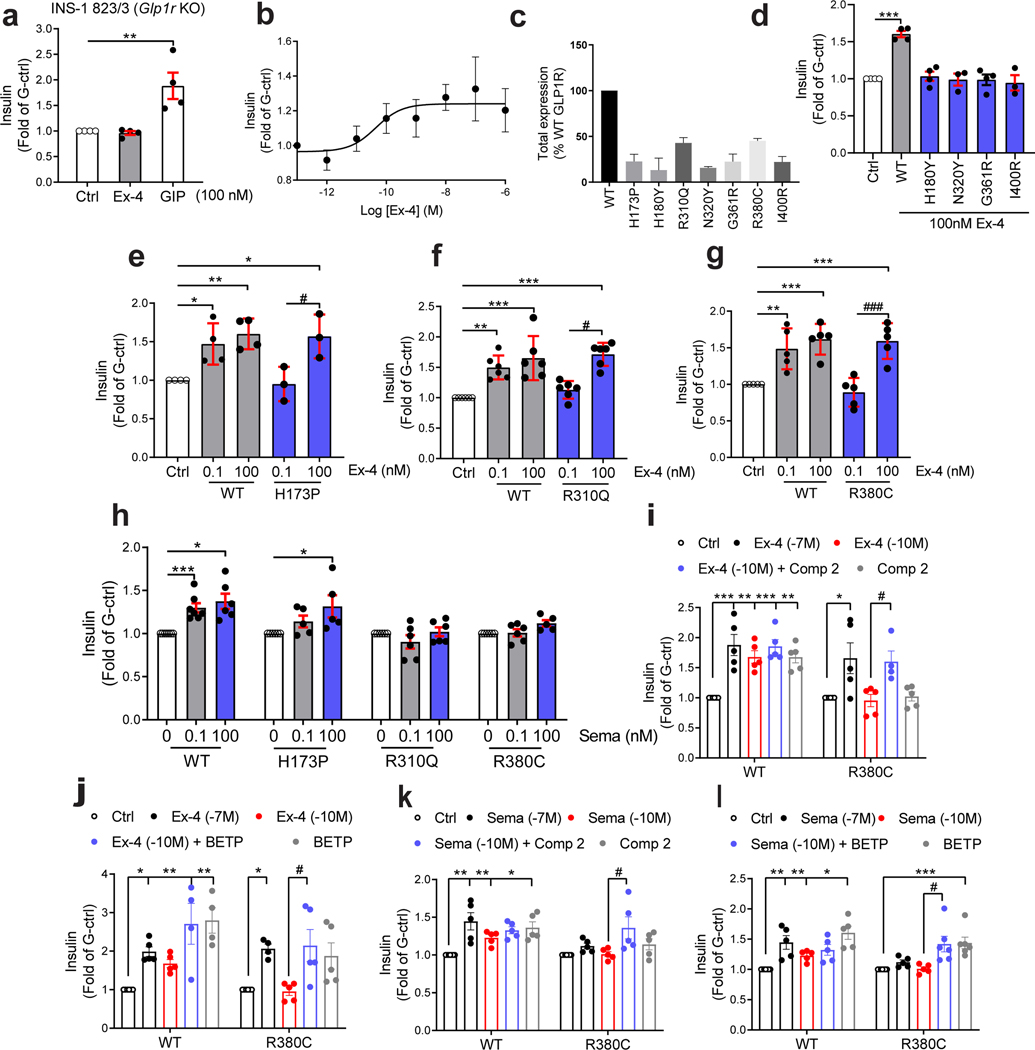
The glucagon-like peptide 1 receptor (GLP1R) is a major drug target with several agonists being prescribed in individuals with type 2 diabetes and obesity1,2. The impact of genetic variability of GLP1R on receptor function and its association with metabolic traits are unclear with conflicting reports. Here, we show an unexpected diversity of phenotypes ranging from defective cell surface expression to complete or pathway-specific gain of function (GoF) and loss of function (LoF), after performing a functional profiling of 60 GLP1R variants across four signalling pathways. The defective insulin secretion of GLP1R LoF variants is rescued by allosteric GLP1R ligands or high concentrations of exendin-4/semaglutide in INS-1 823/3 cells. Genetic association studies in 200,000 participants from the UK Biobank show that impaired GLP1R cell surface expression contributes to poor glucose control and increased adiposity with increased glycated haemoglobin A1c and body mass index. This study defines impaired GLP1R cell surface expression as a risk factor for traits associated with type 2 diabetes and obesity and provides potential treatment options for GLP1R LoF variant carriers.


Conflict of interest statement

DECLARATION OF INTERESTS

The authors declare no competing interes

Figures

Extended Data Fig. 1
Extended Data Fig. 1. Evolutionary action analysis of GLP1R variants.
a, Evolutionary Action (EA) scores were calculated for the 132 indicated GLP1R variants from the general database. EA scores range from 0 to 100, with a score of 0 (light blue) predicted as benign and a score of 100 (dark blue) predicted as highly impactful or detrimental to protein function. Variants selected for functional profiling are highlighted in bold. b, EA scores were calculated for 26 indicated GLP1R variants obtained from the RaDiO study.
Extended Data Fig. 2
Extended Data Fig. 2. Expression analysis of WT and mutant GLP1R monitored by ELISA and LUXendin binding.
a-e, FACS-sorting of intact mouse ß-cells expressing endogenous GLP1R (a), of INS-1 823/3 (Glp1r KO) cells expressing SNAP-flag-tagged WT GLP1R (b), or of HEK293T cells expressing SNAP-flag-tagged WT GLP1R (c), after fluorescent LUXendin binding (100 nM). Specificity LUXendin binding was determined in the presence of an excess of Ex-4 (10 μM) in ß-cells (a) and by mock transfection in INS-1 823/3 (Glp1r KO) and HEK293T cells (b,c). Functional WT-GLP1R expression was monitored in parallel by determining Ex-4-induced cAMP production (a-c). d, Quantification of LUXendin binding of panels a-c (see Methods for more details). e, Quantification of LUXendin binding to non-tagged vs. SNAP-flag-tagged WT GLP1R in INS-1 823/3 (Glp1r KO) and HEK293T cells. f-h, Surface (Sur) and total (To) expression of SNAP-flag-tagged GLP1R in HEK293T and INS-1 823/3 (Glp1r KO) cells determined by ELISA. (f) Expression of WT and mutant GLP1R in INS-1 823/3 (Glp1r KO) cells. Surface expression is shown at X-axis, total receptor expression as color gradient and the Sur/To ratio as size of the bubble. Statistical significance of differences (compared with WT GLP1R) was determined by one-way analysis of variance and Dunnett’s post-test. Sur: *P < 0.05, **P < 0.01, ***P < 0.0001; Tot: (a) P < 0.05, (b) P < 0.01, (c) P < 0.0001. (g-h) Comparison of the total expression of mutants in HEK293T and INS-1 823/3 (Glp1r KO) cells. Statistical significance of differences between two cell types was determined by two-way analysis of variance and Sidak’s multiple comparisons test *P < 0.05, **P < 0.01. 3–5 technical replicates of 3–13 independent biological replicates for each mutant; each mutant expressed as % WT. Ex-4, Exendin-4; MFI, Mean Fluorescent Intensity. See also Fig. 1c,d for complete data set.
Extended Data Fig. 3
Extended Data Fig. 3. Signaling pathways activated by WT GLP1R in HEK293 cells.
a-f, Ex-4 concentration-response curves for cAMP accumulation (a), Ca2+ mobilization (b), β-arr2 recruitment (d) and ERK activation (f) of SNAP-flag-tagged WT GLP1R. Kinetics of β-arr2 recruitment (c) and ERK activation (e). g-j, comparison of signaling of non-tagged vs. SNAP-flag-tagged WT GLP1R. k-n, At 5 minutes, the ERK1/2 activation was fully blocked by the PKA inhibitor H89 (1h preincubation) (k) but not by β-arr1/2 silencing (72 hours prior to Ex-4) (i) indicating that the Gs/cAMP/PKA pathway is the predominant input pathway at 5 minutes of Ex-4 (100 nM) stimulation in HEK293T cells. Representative Western blots showing knockdown of β-arr1/2, and similar Flag-GLP1R expression levels in samples (m). Quantification of panel m (n). o, Effect of the Gq/11 protein inhibitor YM-254890 (30 min preincubation) on Ex-4 (100 nM) stimulated Ca2+ mobilization. 3–5 technical replicates of at least 3 independent biological replicates for each experiment. All values are means ± SEM of at least three independent experiments. Statistical significance of differences was determined by one-way analysis of variance and Dunnett’s post-test (*P < 0.05, **P < 0.01). Ex-4, Exendin-4; Sema, Semaglutide; β-arr1/2, β-arrestin1/2; pERK, phosphorylation of ERK, Ctrl, control; AU, arbitrary Unit.
Extended Data Fig. 4
Extended Data Fig. 4. Correlations between signaling parameters of cAMP production and cell surface expression and comparison of GLP-1 vs. Ex-4 in HEK293 cells.
a, Ex-4 concentration-response curves for cAMP accumulation at different quantities of cell surface expressed WT GLP1R. 100% refers to transfection of 50 ng WT GLP1R plasmid. b,c, Correlation of Emax (b) and LogEC50 (c) of cAMP accumulation with cell surface expression of WT GLP1R. Inset: 0 to 15% cell surface expression range. d, Surface expression of WT and mutant GLP1R. Ctrl-1=50 ng and Ctrl-2=1 ng of WT GLP1R plasmid to match the low expression of some mutants. e,f, Ex-4 and GLP-1 concentration-response curves of cAMP accumulation at Ctrl-1 and Ctrl-2 WT GLP1R conditions. Inset: response at Ctrl-2 condition. g, pEC50 values of panels e-f. h-k, Ex-4 (h) and GLP-1 (i) concentration-response curves of mutant GLP1R compared to WT GLP1R at Ctrl-2 conditions. p.H180Y, p.N320Y, p.G361R and p.I400R are complete loss-of-function (LoF) mutants for this pathway when stimulated with Ex-4 (h) or GLP-1 (i). p.H173P and p.R176R show a residual response and were classified as severely defective with similar results for Ex-4 (j) and GLP-1 (k) confirming the physiological relevance of this result. All values are means ± SEM of at least three independent experiments. Ctrl, control; Exp, expression; Ex-4, Exendin-4.
Extended Data Fig. 5
Extended Data Fig. 5. Correlations between signaling parameters of Ca2+ mobilization, ERK activation, β-arr2 recruitment and cell surface expression in HEK293T cells.
a-i, Different amounts of WT GLP1R were expressed in HEK293T cells and Ex-4 concentration-response curves were generated for Ca2+ mobilization (a), ERK1/2 activation (d), and β-arr2 recruitment (g) and calculated Emax (b, e, h) and logEC50 (c, f, i) values correlated with surface expression. These correlation curves allowed us to determine the signaling parameters (Emax and EC50) of receptor mutants at matched WT GLP1R expression levels. 100% surface expression refers to transfection of 50 ng of WT GLP1R plasmid. All values are means ± SEM of at least three independent experiments. Exp, expression; Ctrl, control; Ex-4, Exendin-4.
Extended Data Fig. 6
Extended Data Fig. 6. Extended version of the functional profiles of GLP1R mutants in HEK293T cells.
Ex-4 concentration-response curves were generated for cAMP production, Ca2+ mobilization, ERK activation, and β-arr2 recruitment of mutant GLP1R in HEK293T cells and organized in eight categories: Severely surface expression defective (a), all pathways defective (b), Two or three pathways defective (c), β-arr2 specific defect (d), ERK specific defect (e), cAMP Gain of function (f), Ca2+ Gain of function (g) Wild-type like (h). The radial graph of each mutant is shown on the right. Solid lines with filled circles correspond to the mutant GLP1R and dotted lines with open circles correspond to the WT GLP1R monitored in parallel with the mutant receptors in each experiment. For radial graphs, compare with WT GLP1R (set as zero), values of mutants ranged from −1 to +1, where 0 to +1 represent enhanced properties, and 0 to −1 means impaired properties. Data were plotted using nonlinear regression with a variable Hill slope. All values are means ± SEM of 2-3 technical replicates of 3-8 independent biological replicates for each mutant. Exp, expression Δ,Δlog(τ/Ka) Ex-4, Exendin-4; β-arr2, β-arrestin2. See also Fig. 2 and Supplementary tables 2,3 for complete data sets.
Extended Data Fig. 7
Extended Data Fig. 7. Affinity of Ex-4 for WT and mutant GLP1R with modified EC50 values in functional assays determined in TAG-LITE® GLP1 receptor competition binding experiments.
All values are expressed as means ± SEM of at least three independent experiments. ND refers to ‘no detectable binding’. The cumulative pIC50=8.13±0.06 for the WT GLP1R. The data were analyzed by comparing independent fits with a global fit that share the selected parameter (#). *P < 0.05, **P < 0.01, ***P < 0.0001.
Extended Data Fig. 8
Extended Data Fig. 8. Correlations between experimentally determined phenotypic score and different predictive scores.
We calculated the predicted scores by using 5 different scoring algorithms including EA (a), REVEL (b), CADD (c), MutationAssessor (d), SIFT (e), and PolyPhen2 (f), and correlated them with the experimentally obtained phenotypic scores.
Extended Data Fig. 9.
Extended Data Fig. 9.. Association between rare deleterious GLP1R variants and metabolic traits in the UK Biobank.
β-arr2, β-arrestin2; BMI, body mass index; DBP, diastolic blood pressure; HbA1c, glycated hemoglobin A1C; HDL, high-density lipoprotein; LDL, low-density lipoprotein; SBP, systolic blood pressure; SE, standard error.
Extended Data Fig. 10
Extended Data Fig. 10. cAMP production and insulin secretion activated by WT and mutant GLP1R in INS-1 823/3 (Glp1r KO) cells.
a,b, Semaglutide concentration-response curves for cAMP accumulation (a) and insulin secretion (b) induced by SNAP-flag-tagged WT GLP1R. (c-i) Ex-4 response in cells expressing mutants with (c-f), defective β-arr2 recruitment and (g-i), gain-of-function phenotype. Responses are normalized to glucose-induced insulin secretion in the absence of Ex-4. Responses are normalized to glucose-induced insulin secretion in the absence of Ex-4. All values are means ± SEM of at least three independent experiments. Statistical significance of differences (compared with control) was determined by one-way analysis of variance and Dunnett’s post-test *P < 0.05, **P < 0.01, ***P < 0.0001. Ex-4, Exendin-4; G-ctrl, glucose control.
Figure 1.
Figure 1.. Selection Process of GLP1R Variants and Expression of WT and Mutant GLP1R in Cell Models.
a, Selection of 34 rare non-synonymous variants in GLP1R (NM_002062.5) from ExAC browser and 25 rare and one frequent GLP1R variants from the RaDiO study. EA, evolutionary action algorithm; TM, transmembrane domain; ICD, intracellular domain. b, Location of the 60 GLP1R variants. Mutant positions are labeled in red. The borders of the membrane domain are delineated by the blue box. C-ter, carboxyl-terminal domain; e1 to e3, extracellular loops 1 to 3; i1 to i3, intracellular loops 1 to 3; N-ter, amino-terminal domain. LoF, loss-of-function; T2D, type 2 diabetes. c,d, Surface (Sur) and total (To) expression in HEK293T and INS-1 823/3 (Glp1r KO) cells was determined by ELISA. (c) Expression of WT and mutant GLP1R in HEK293T cells. Cell surface expression is shown at X-axis, total receptor expression as color gradient and the Sur/To ratio as size of the bubble. Statistical significance of differences (compared with WT GLP1R) was determined by one-way analysis of variance and Dunnett’s post-test. Sur: *P < 0.05, **P < 0.001, ***P < 0.0001; Ratio: #P < 0.05, ##P < 0.001, ###P < 0.0001; Tot: (a) P < 0.05, (b) P < 0.001, (c) P < 0.0001. (d) Comparison of cell surface expression of mutants in HEK293T and INS-1 823/3 (Glp1r KO) cells. Statistical significance of differences between two cell types was determined by two-way analysis of variance and Sidak’s multiple comparisons test *P < 0.05, **P < 0.01, ***P < 0.0001. 3–5 technical replicates of 3–13 independent biological replicates for each mutant; each mutant expressed as % WT. See also Extended Data Fig. 2 and table S2 for complete data sets.
Figure 2.
Figure 2.. Functional Profiling of GLP1R Mutants Define Eight Categories.
a-g, Ex-4 concentration-response curves of cAMP production, Ca2+ mobilization, ERK activation, and β-arr2 recruitment and radial graphs of one representative GLP1R mutant of each category. Mutant GLP1R (solid lines with filled circles) and WT GLP1R (dotted lines with open circles) were monitored in parallel in each experiment. For radial graphs, data were normalized to WT GLP1R (set as zero), values of mutants ranged from −1 to +1, where 0 to +1 represent enhanced properties, and 0 to −1 represents impaired properties. All values are means ± SEM of 2–3 technical replicates of 3–8 independent biological replicates for each mutant. Exp, expression; Δ,Δlog(τ/KA); Ex-4, Exendin-4. See also Extended Data Fig. 4 to Extended Data Fig. 7 and tables S2 and S3 for complete data sets for the agonist-mediated signaling activity of GLP1R mutants.
Figure 3.
Figure 3.. 56 Mutants Clustered into Three Groups are Correlated to the Level of Phenotypic Pb.
a, Non-Negative Matrix Factorization (NMF) and K-means analysis clustered 56 mutants into 3 groups as shown in three dendrograms (red, blue, and black). The normalized difference values from phenotypic assays are represented in each radial plot and color-coded blue (Gain-of-Function, GoF) to red (Loss-of-Function, LoF). Phenotype scores were set from −1 to +1. WT GLP1R was set as zero, values of mutants ranging from 0 to +1 represent enhanced properties, and from 0 to −1 impaired properties. b, The box plot shows the distribution of the mutants into three clusters based on their phenotype score defined in the ‘Methods’ section. c, Superimposed radial graphs of mutants belonging to the same cluster. Cluster 1 is characterized by a complete loss of β-arr2 response and also drastically reduced potency of the cAMP response. They also lost mid to high ERK efficacy. Cluster 2 shows detectable β-arr2 function but drastic losses in Emax and log(τ/KA). These mutants also have reduced ERK efficacy but increased ERK potency. Member of Cluster 3 shows lower phenotype scores than those of the other two clusters. d, The predictive evolutionary Action (EA) score of GLP1R mutants in the TM domain is correlated with the experimentally determined Phenotypic score of these mutants. R2=0.41 for the linear correlation (P < 0.0001). The TM domain was selected because of its highest predictive value for GPCRs , Pb, Perturbatio. e, Association between rare GLP1R variants and metabolic traits in the UK Biobank. β-arr2, beta arrestin 2; BMI, body mass index; DBP, diastolic blood pressure; HbA1c, glycated hemoglobin A1C; HDL, high-density lipoprotein; LDL, low-density lipoprotein; SBP, systolic blood pressure; SE, standard error.
Figure 4.
Figure 4.. Rescue of Insulin Secretion of GLP1R Mutants Expressed in INS-1 823/3 (Glp1r KO) cells.
INS-1 823/3 (Glp1r KO) pancreatic β-cell line deleted of its Glp1r gene was used to examine the capacity of GLP1R mutants to promote glucose-stimulated insulin secretion. a, Ex-4 (100 nM) and GIP (100 nM) response in mock-transfected cells. b, Ex-4 concentration-response curve in cells expressing GLP1R WT. c, Total expression of mutants determined by ELISA. d-g, Ex-4 response in cells expressing mutants with (d,e) severely defective cell surface expression or (f,g) severely defective cAMP pathway (2 logs right shifted EC50). h, Semaglutide response in cells expressing WT GLP1R, p.H173P, p.R310Q or p.R380C mutants. i,j, Ex-4 response in the presence of Compound 2 or BETP in cells expressing the p.R380C mutant. k,l, Semaglutide response in the presence of Compound 2 or BETP in cells expressing the p.R380C mutant. Responses are normalized to glucose-induced insulin secretion in the absence of Ex-4. All values are means ± SEM of at least three independent experiments. Statistical significance of differences (compared with control) was determined by one-way analysis of variance and Dunnett’s post-test *P < 0.05, **P < 0.01, ***P < 0.0001. Statistical significance of differences (compared with 0.1 nM treatment of GLP1R mutant) was determined by one-way analysis of variance and Dunnett’s post-test #P < 0.05, ###P < 0.0001. Ex-4, Exendin-4; G-ctrl, glucose control; Comp 2, Compound 2; Sema, Semaglutide.

References

    1. Muller TD, et al. Glucagon-like peptide 1 (GLP-1). Mol Metab 30, 72–130 (2019). - PMC - PubMed
    1. Graaf C, et al. Glucagon-Like Peptide-1 and Its Class B G Protein-Coupled Receptors: A Long March to Therapeutic Successes. Pharmacol Rev 68, 954–1013 (2016). - PMC - PubMed
    1. Zhang Y, et al. Cryo-EM structure of the activated GLP-1 receptor in complex with a G protein. Nature 546, 248–253 (2017). - PMC - PubMed
    1. Koole C, et al. Polymorphism and ligand dependent changes in human glucagon-like peptide-1 receptor (GLP-1R) function: allosteric rescue of loss of function mutation. Mol Pharmacol 80, 486–497 (2011). - PMC - PubMed
    1. Koole C, Savage EE, Christopoulos A, Miller LJ, Sexton PM, Wootten D. Minireview: Signal bias, allosterism, and polymorphic variation at the GLP-1R: implications for drug discovery. Mol Endocrinol 27, 1234–1244 (2013). - PMC - PubMed

LinkOut - more resources