. 2023 Oct;24(10):1671-1684.
doi: 10.1038/s41590-023-01612-z. Epub 2023 Sep 14.

Nutrition impact on ILC3 maintenance and function centers on a cell-intrinsic CD71-iron axis

Affiliations

Nutrition impact on ILC3 maintenance and function centers on a cell-intrinsic CD71-iron axis

Lifeng Xiong et al. Nat Immunol. 2023 Oct.

Abstract

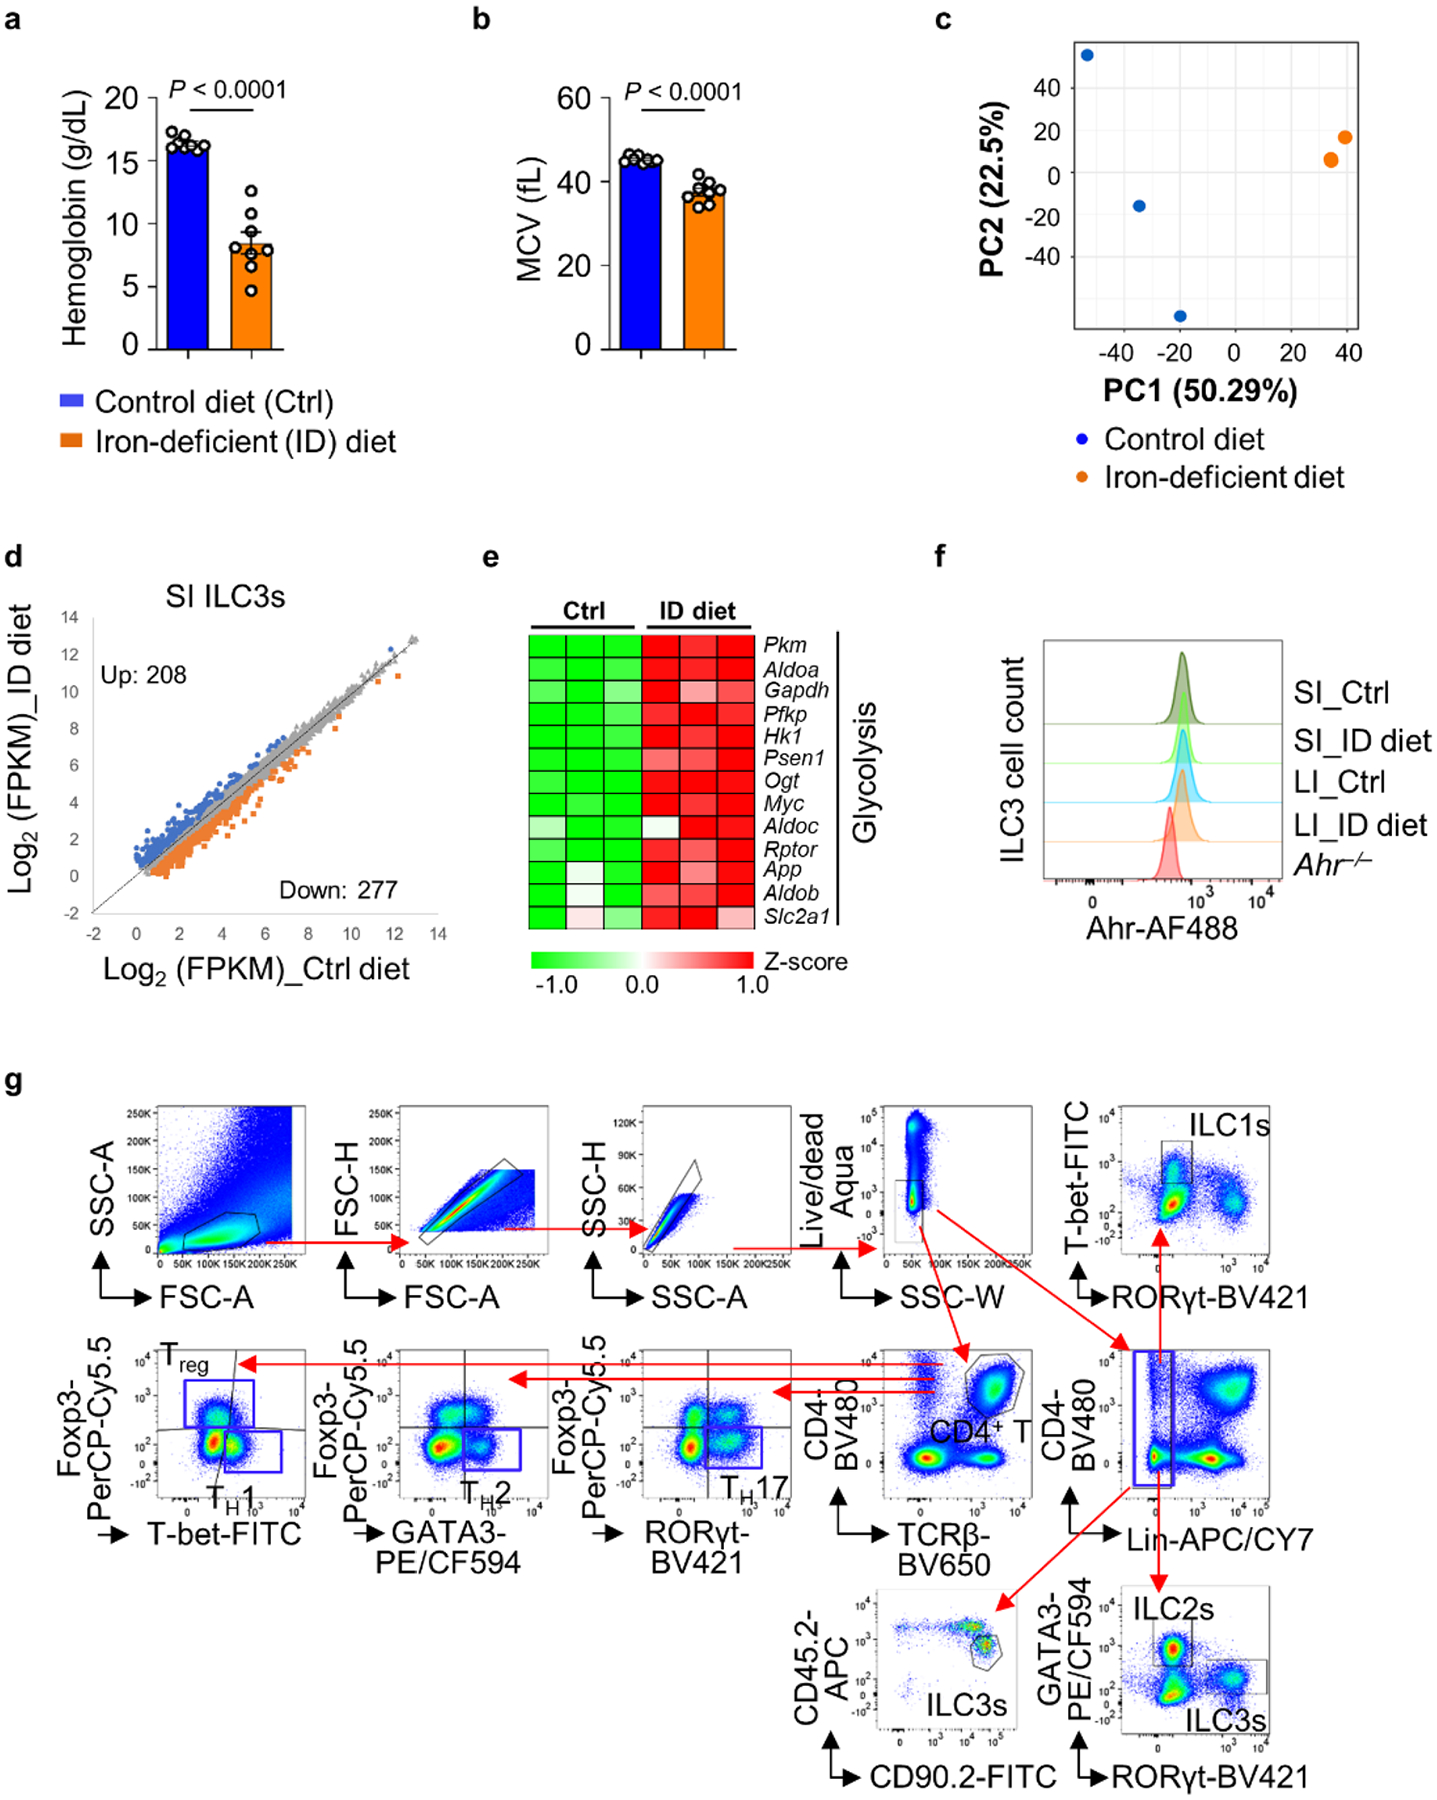
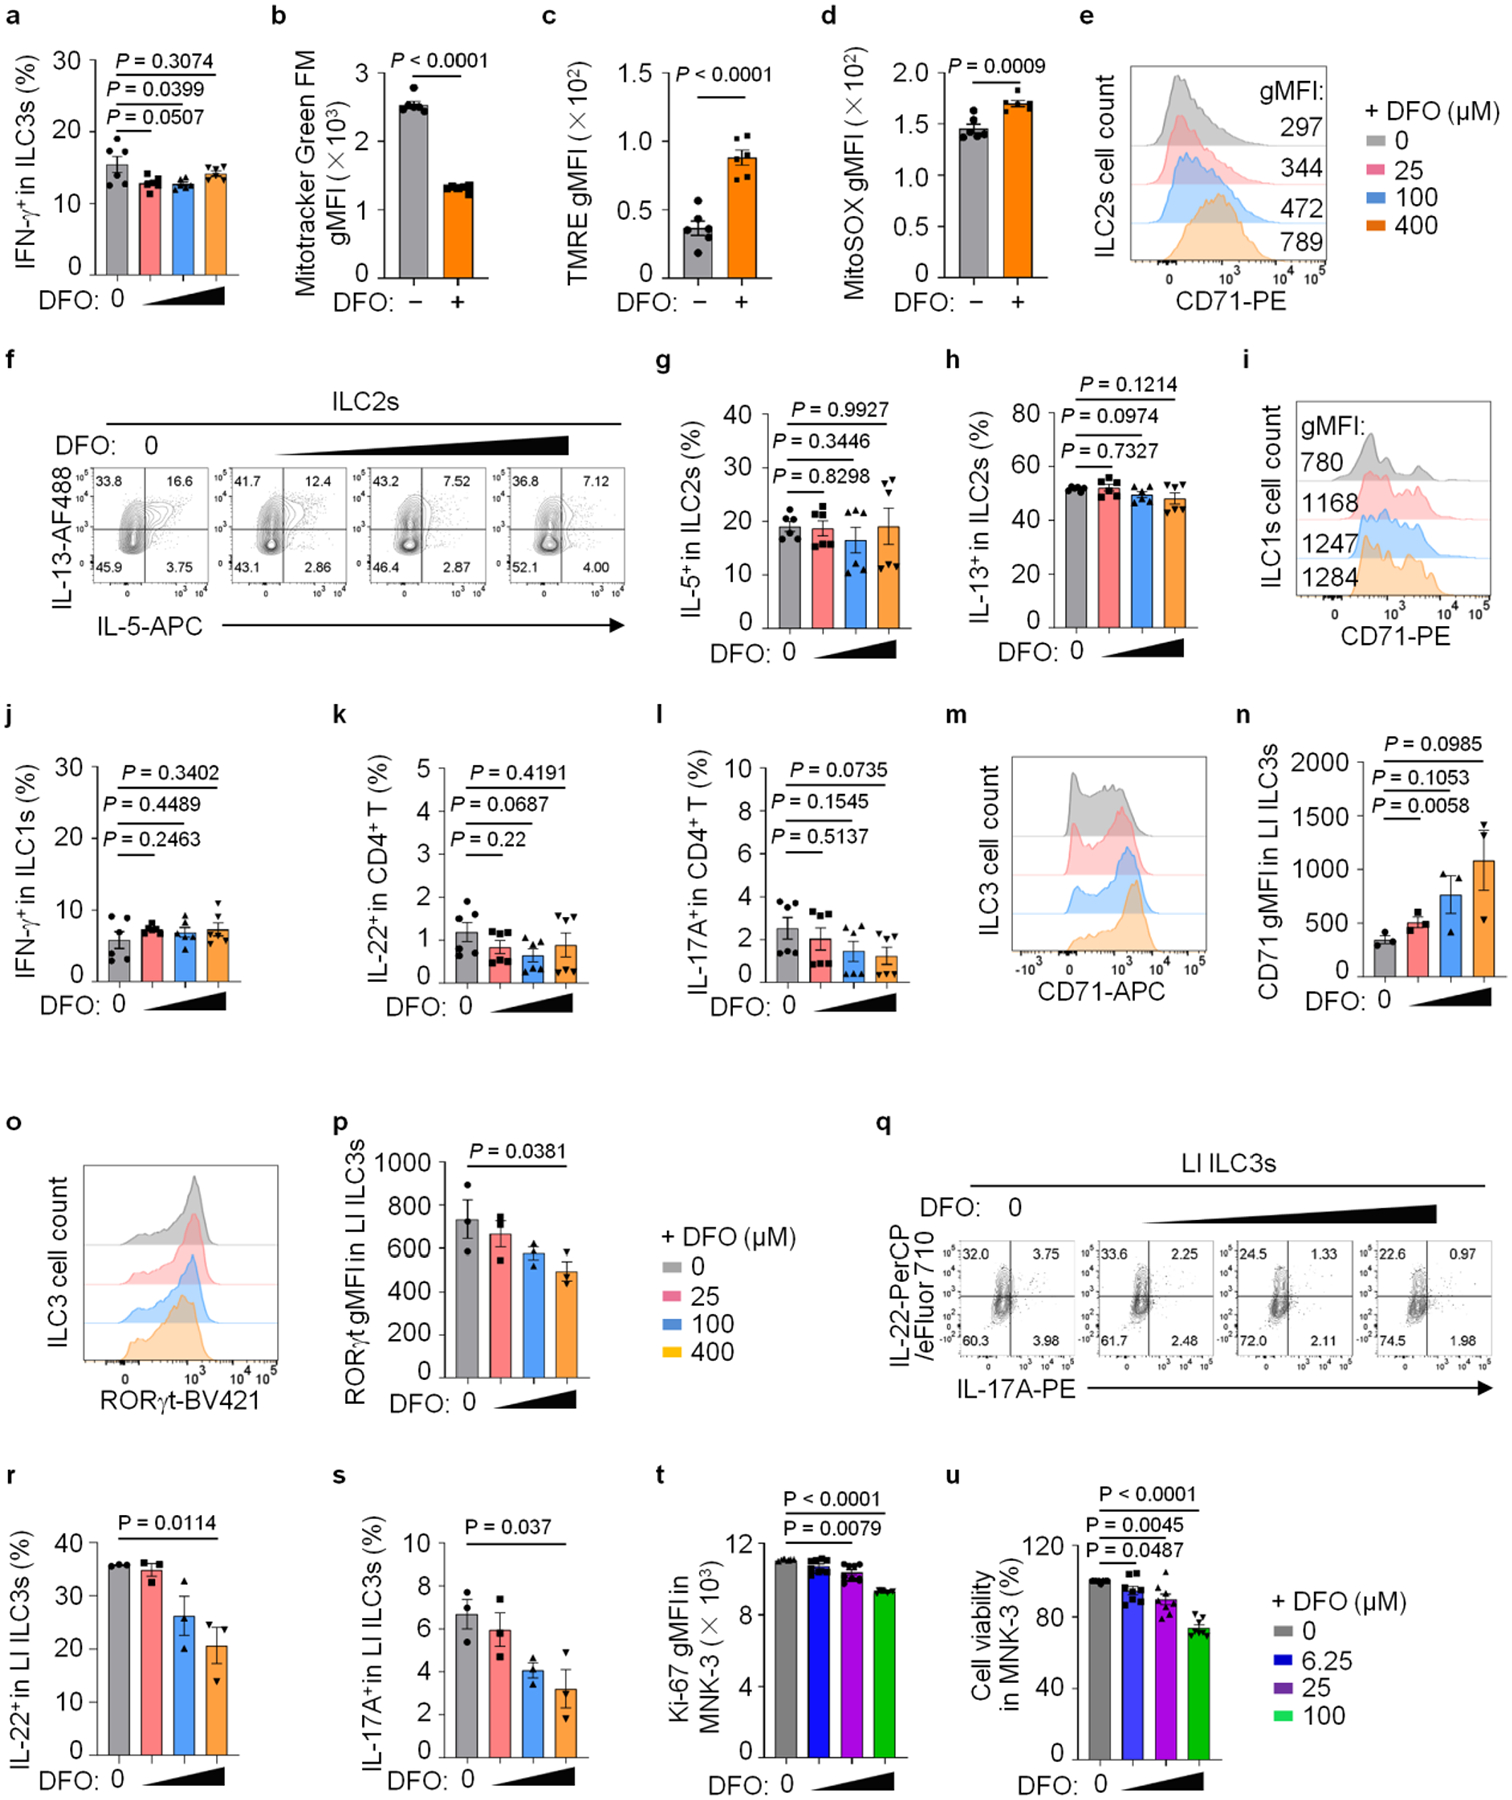
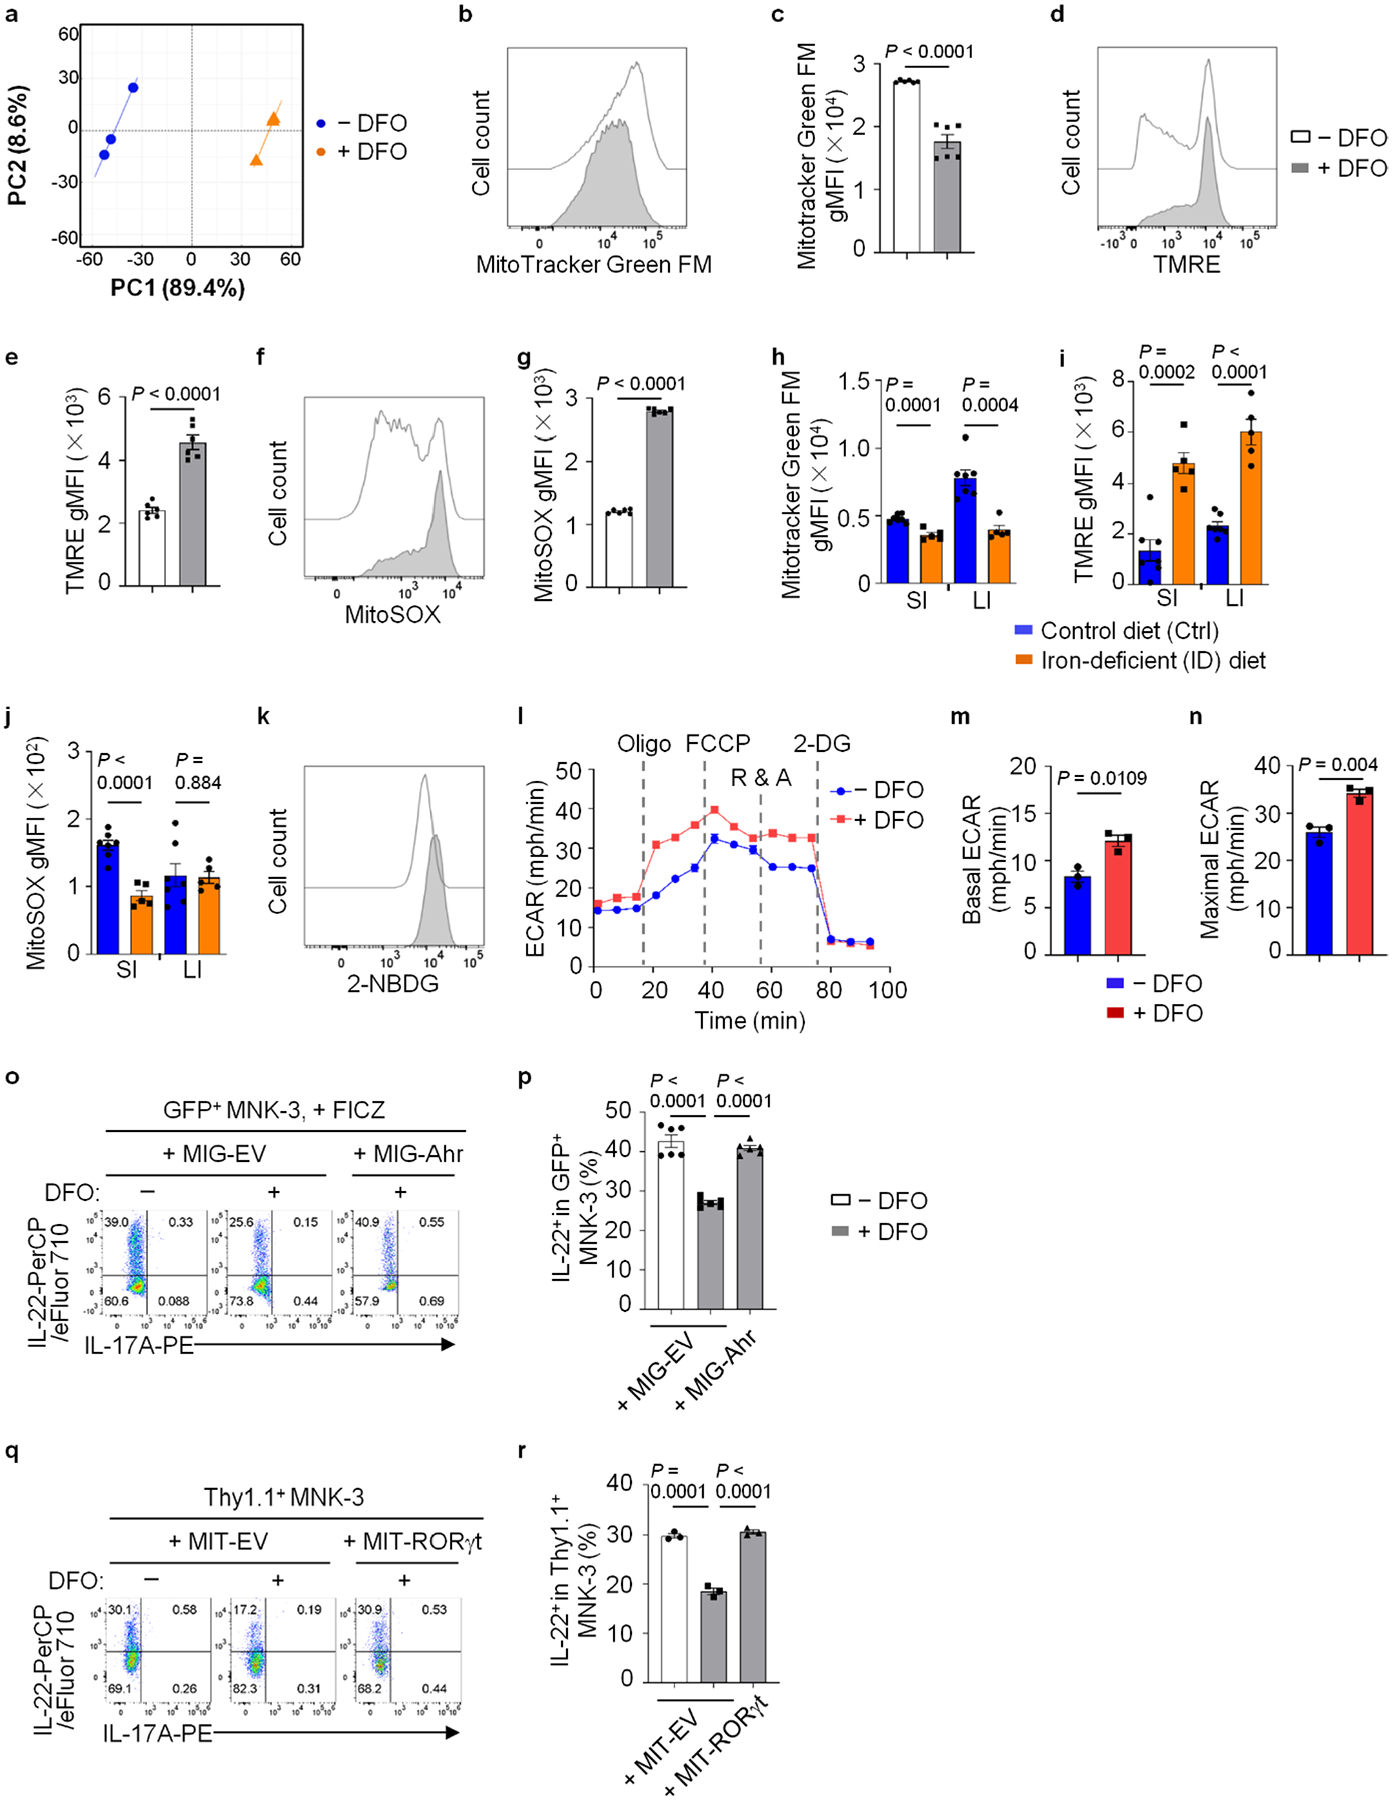
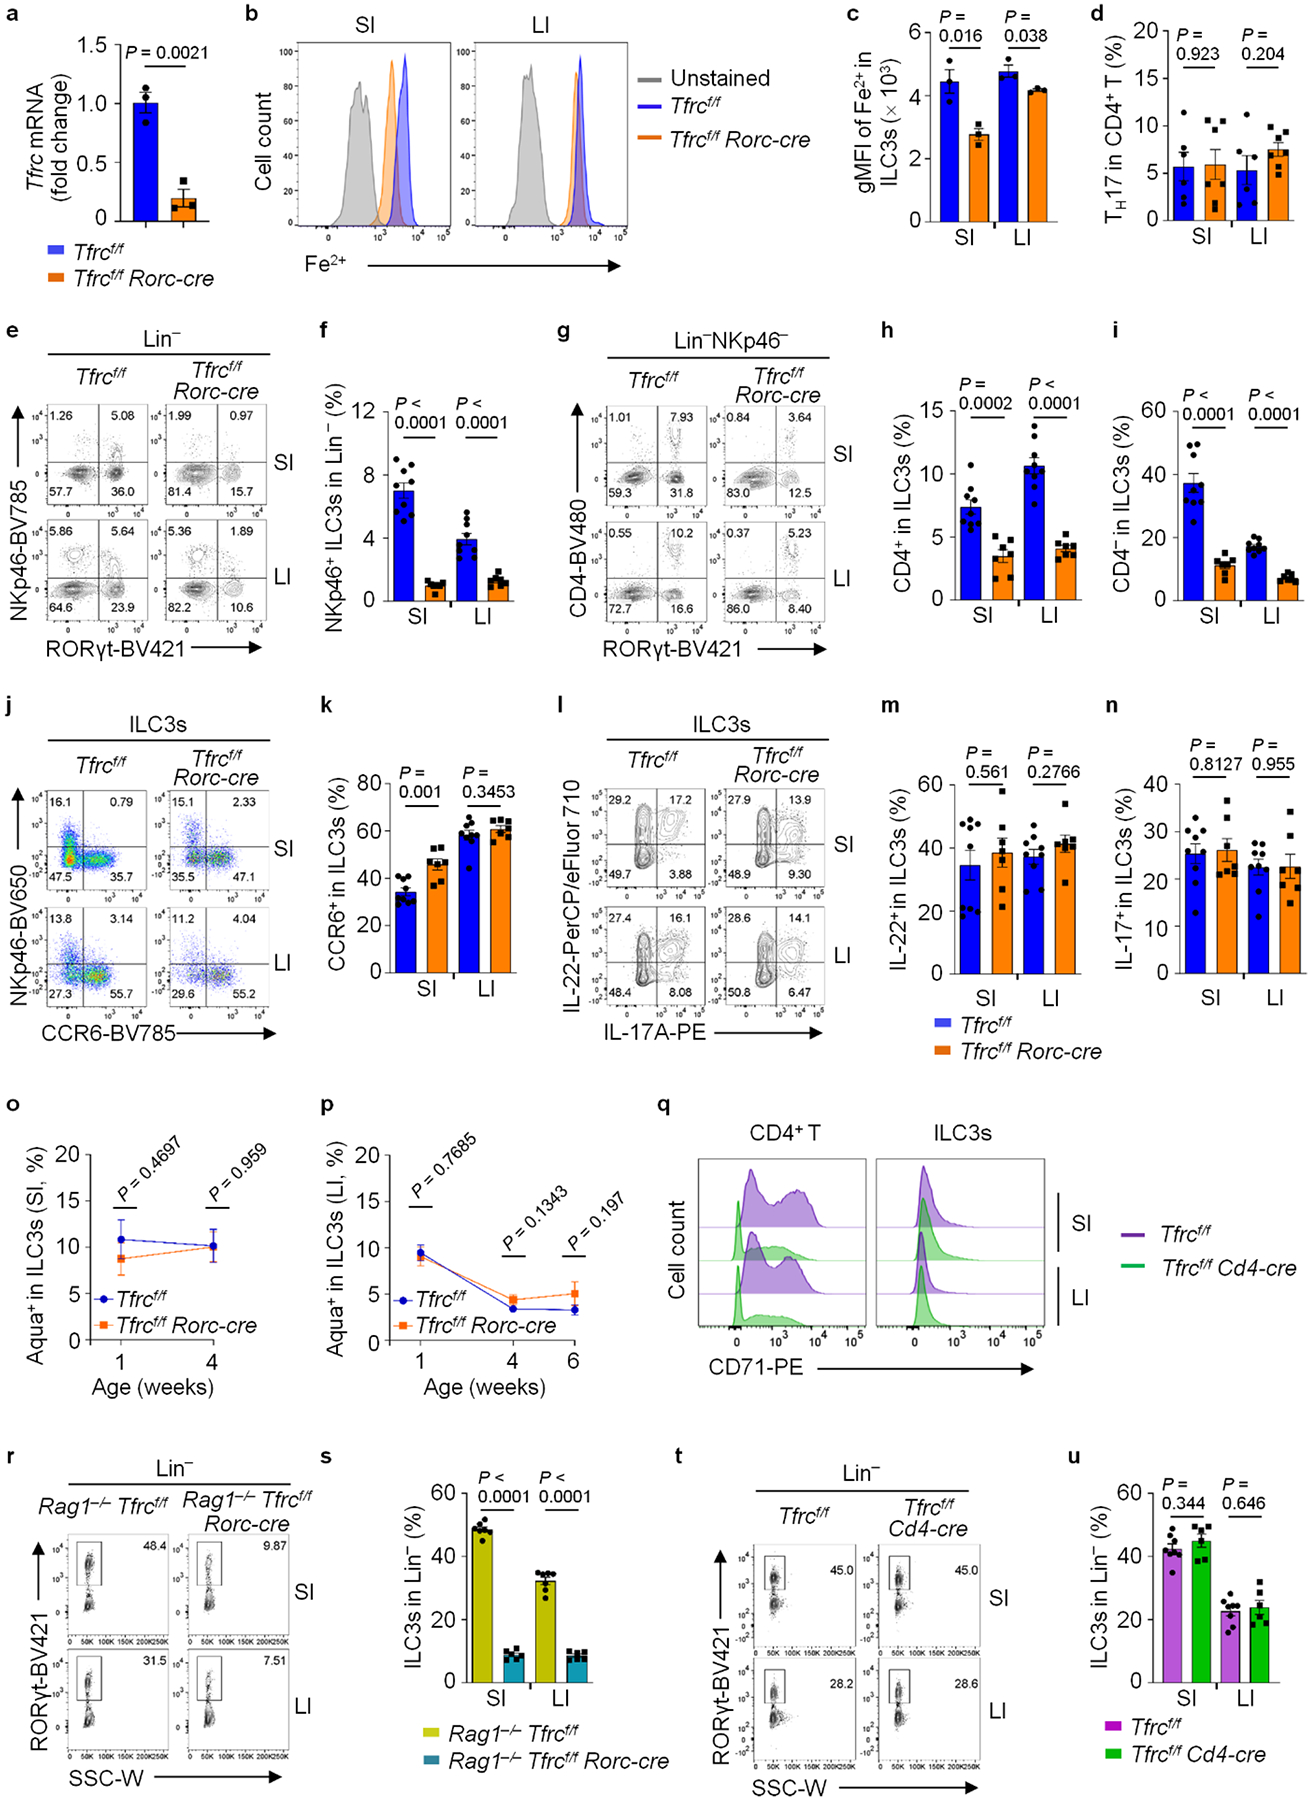
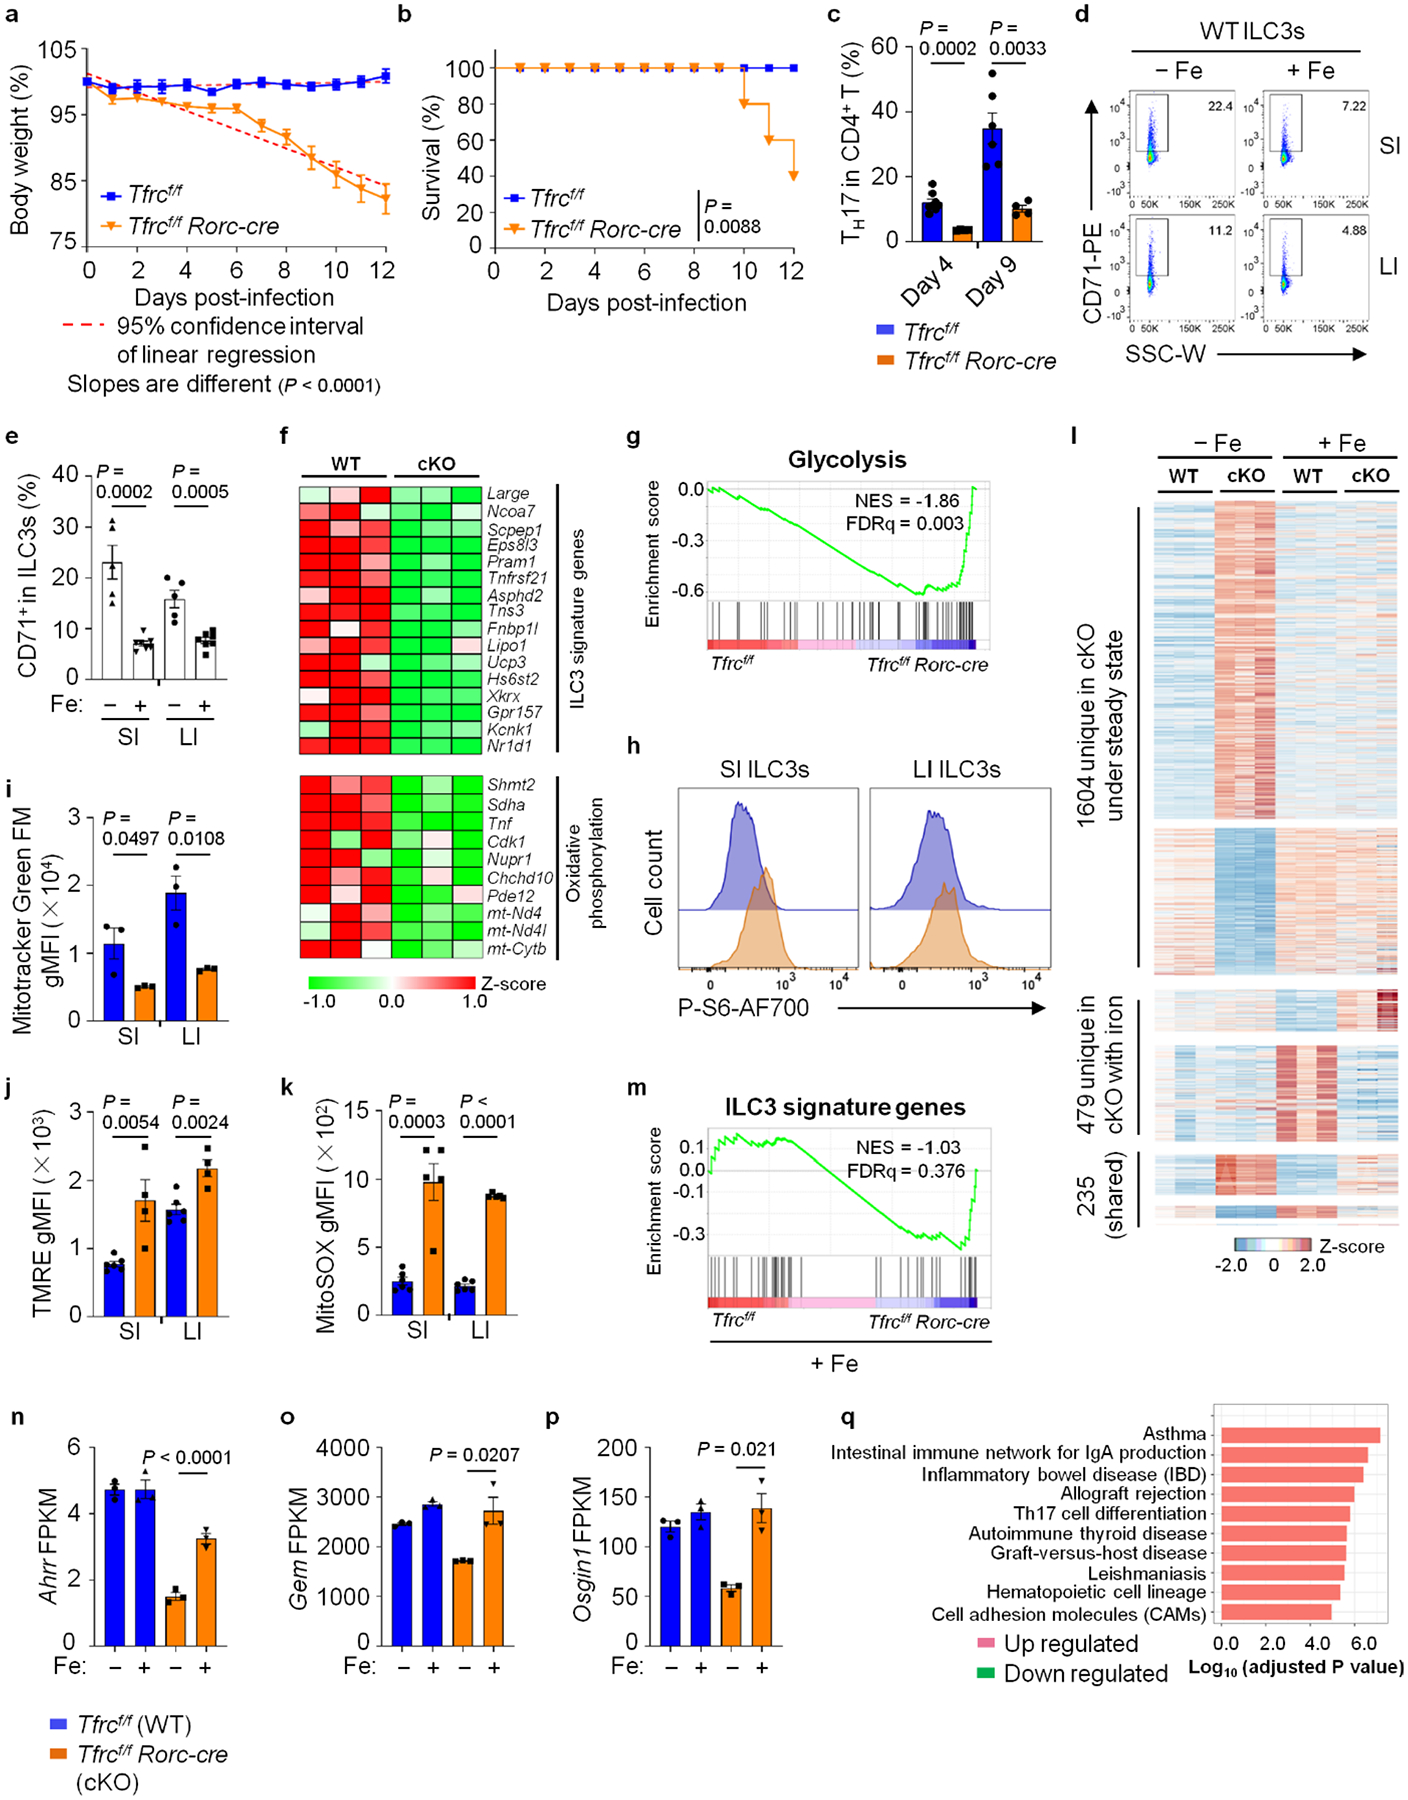
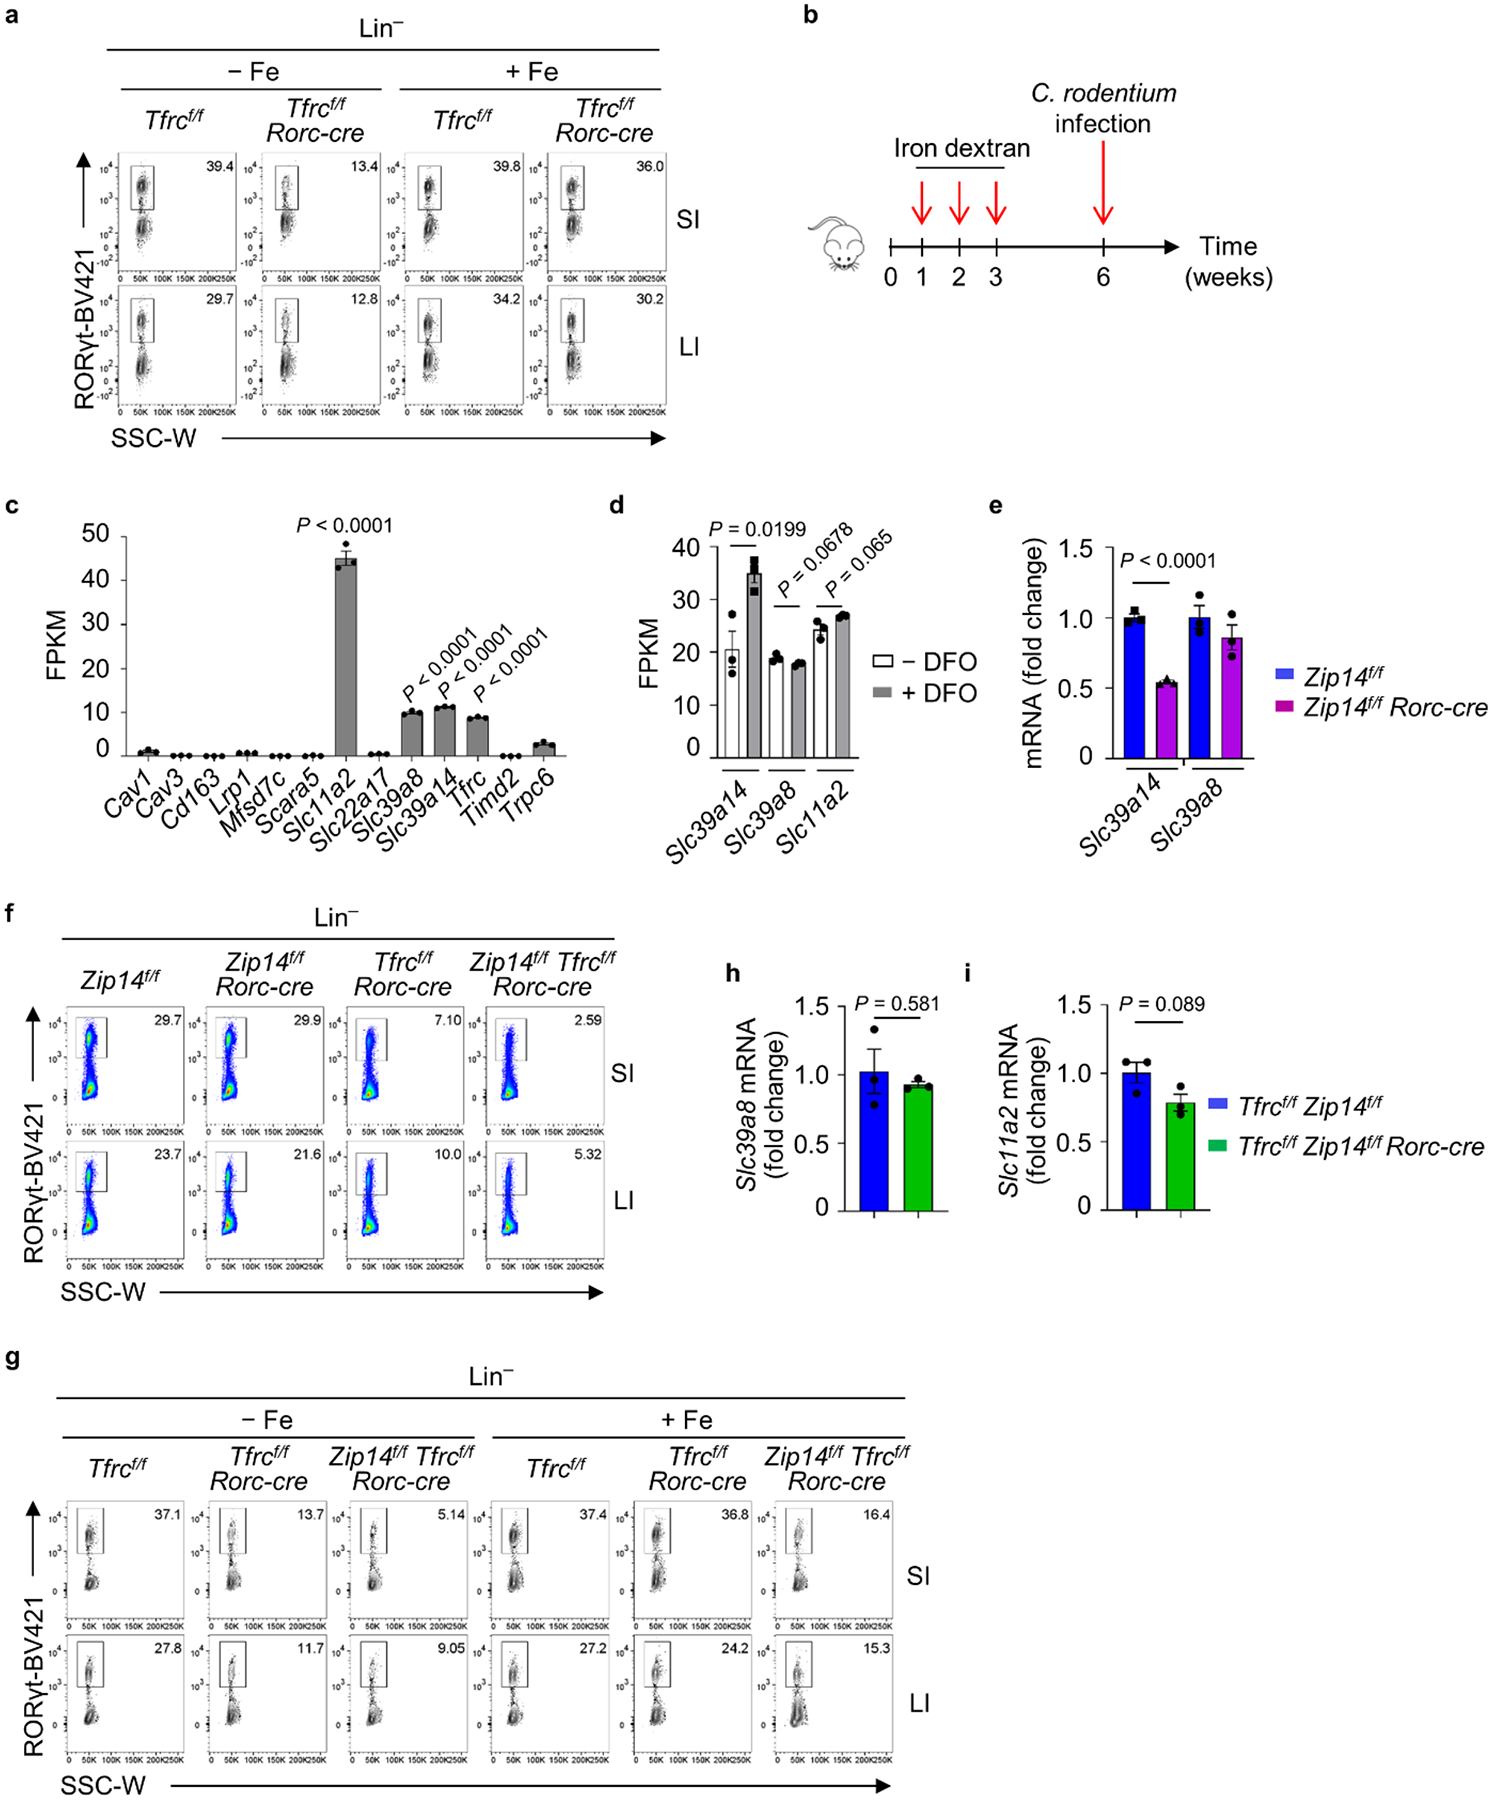
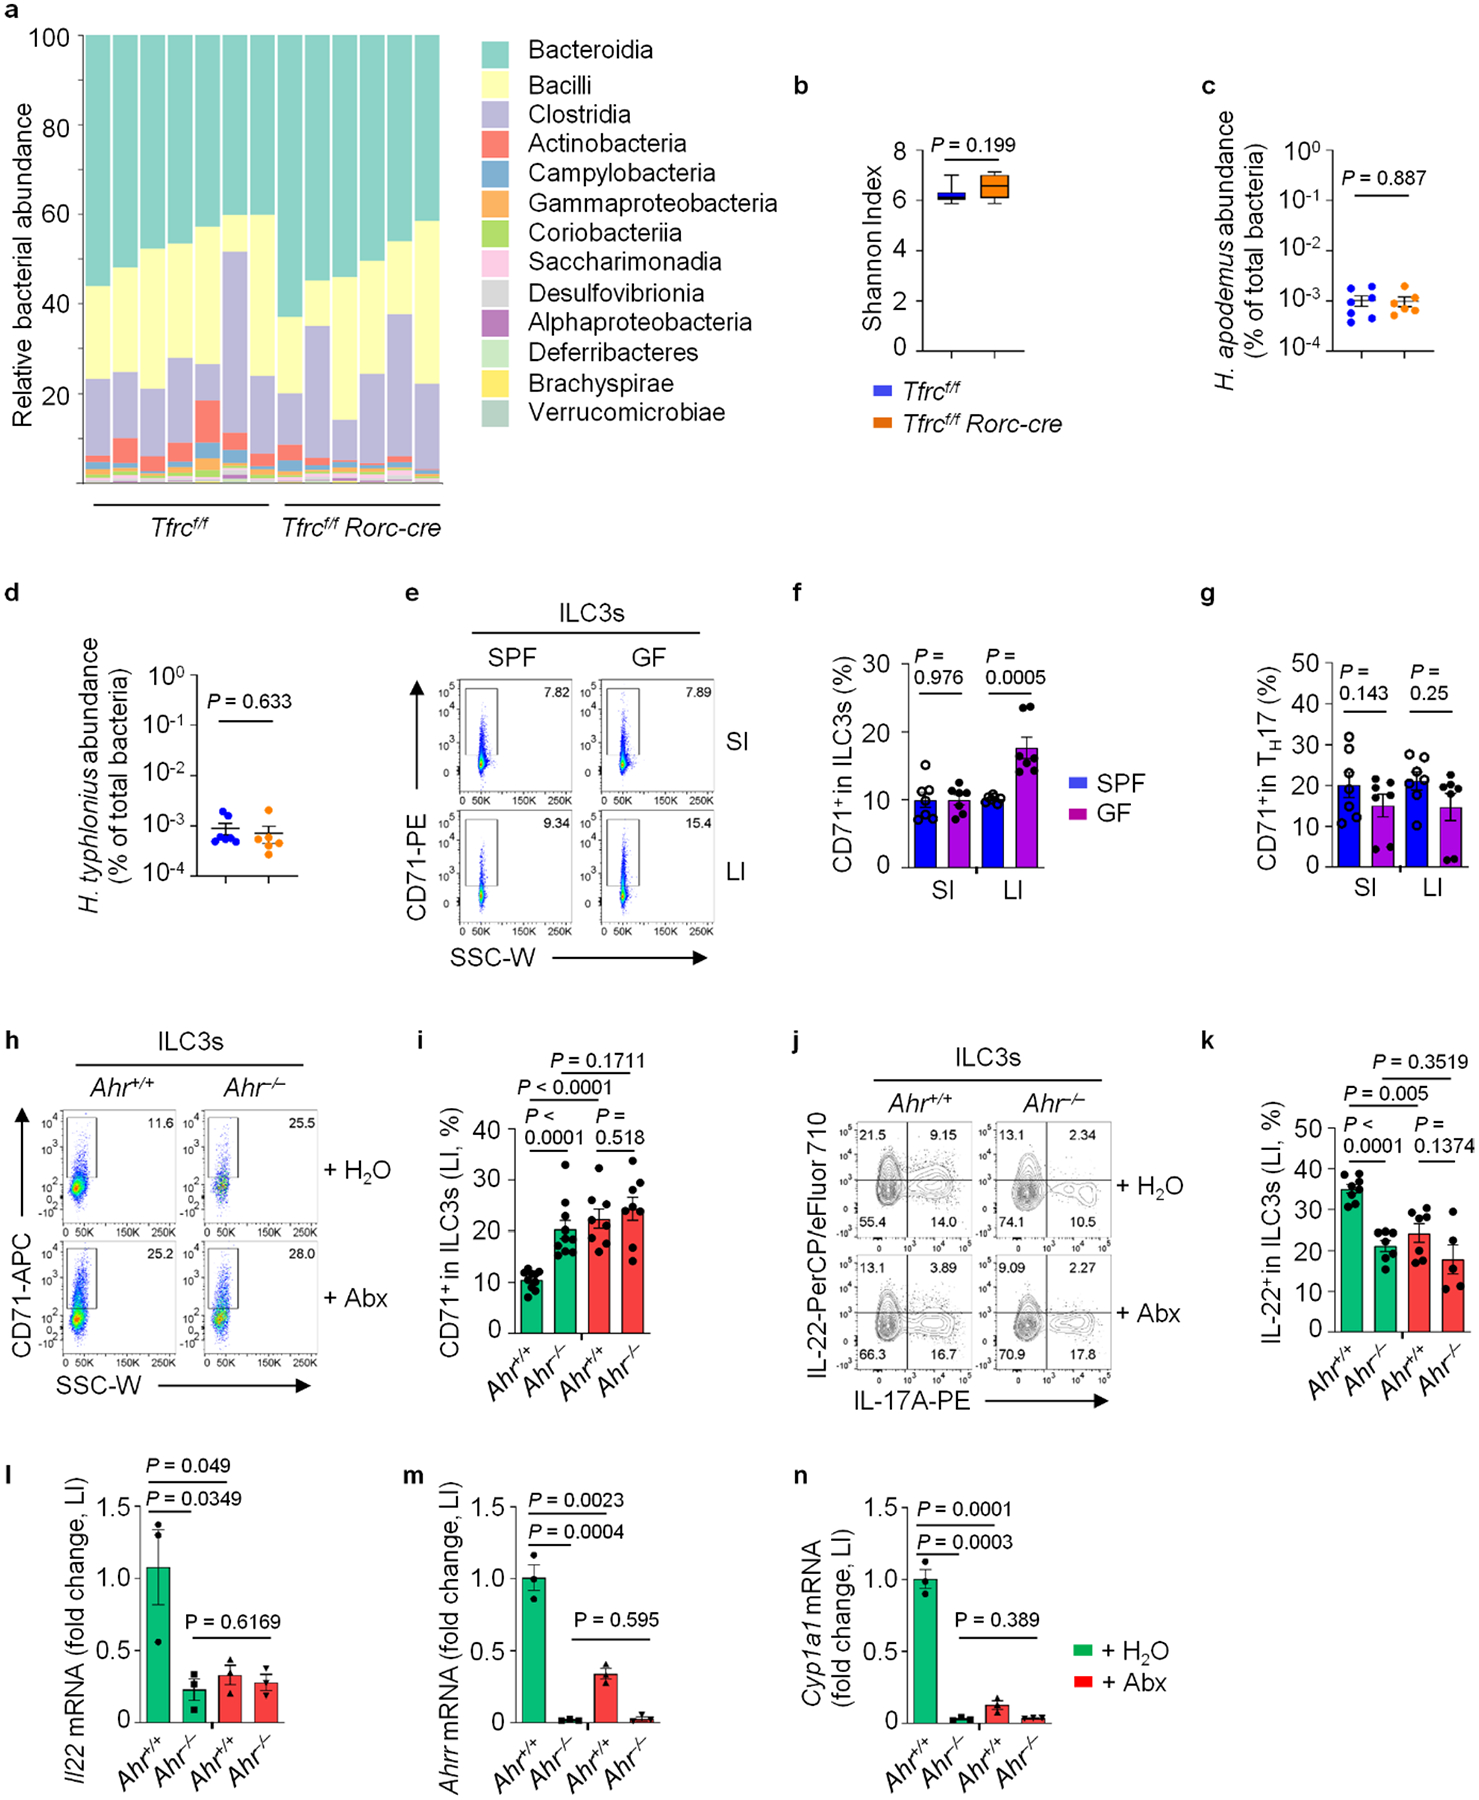
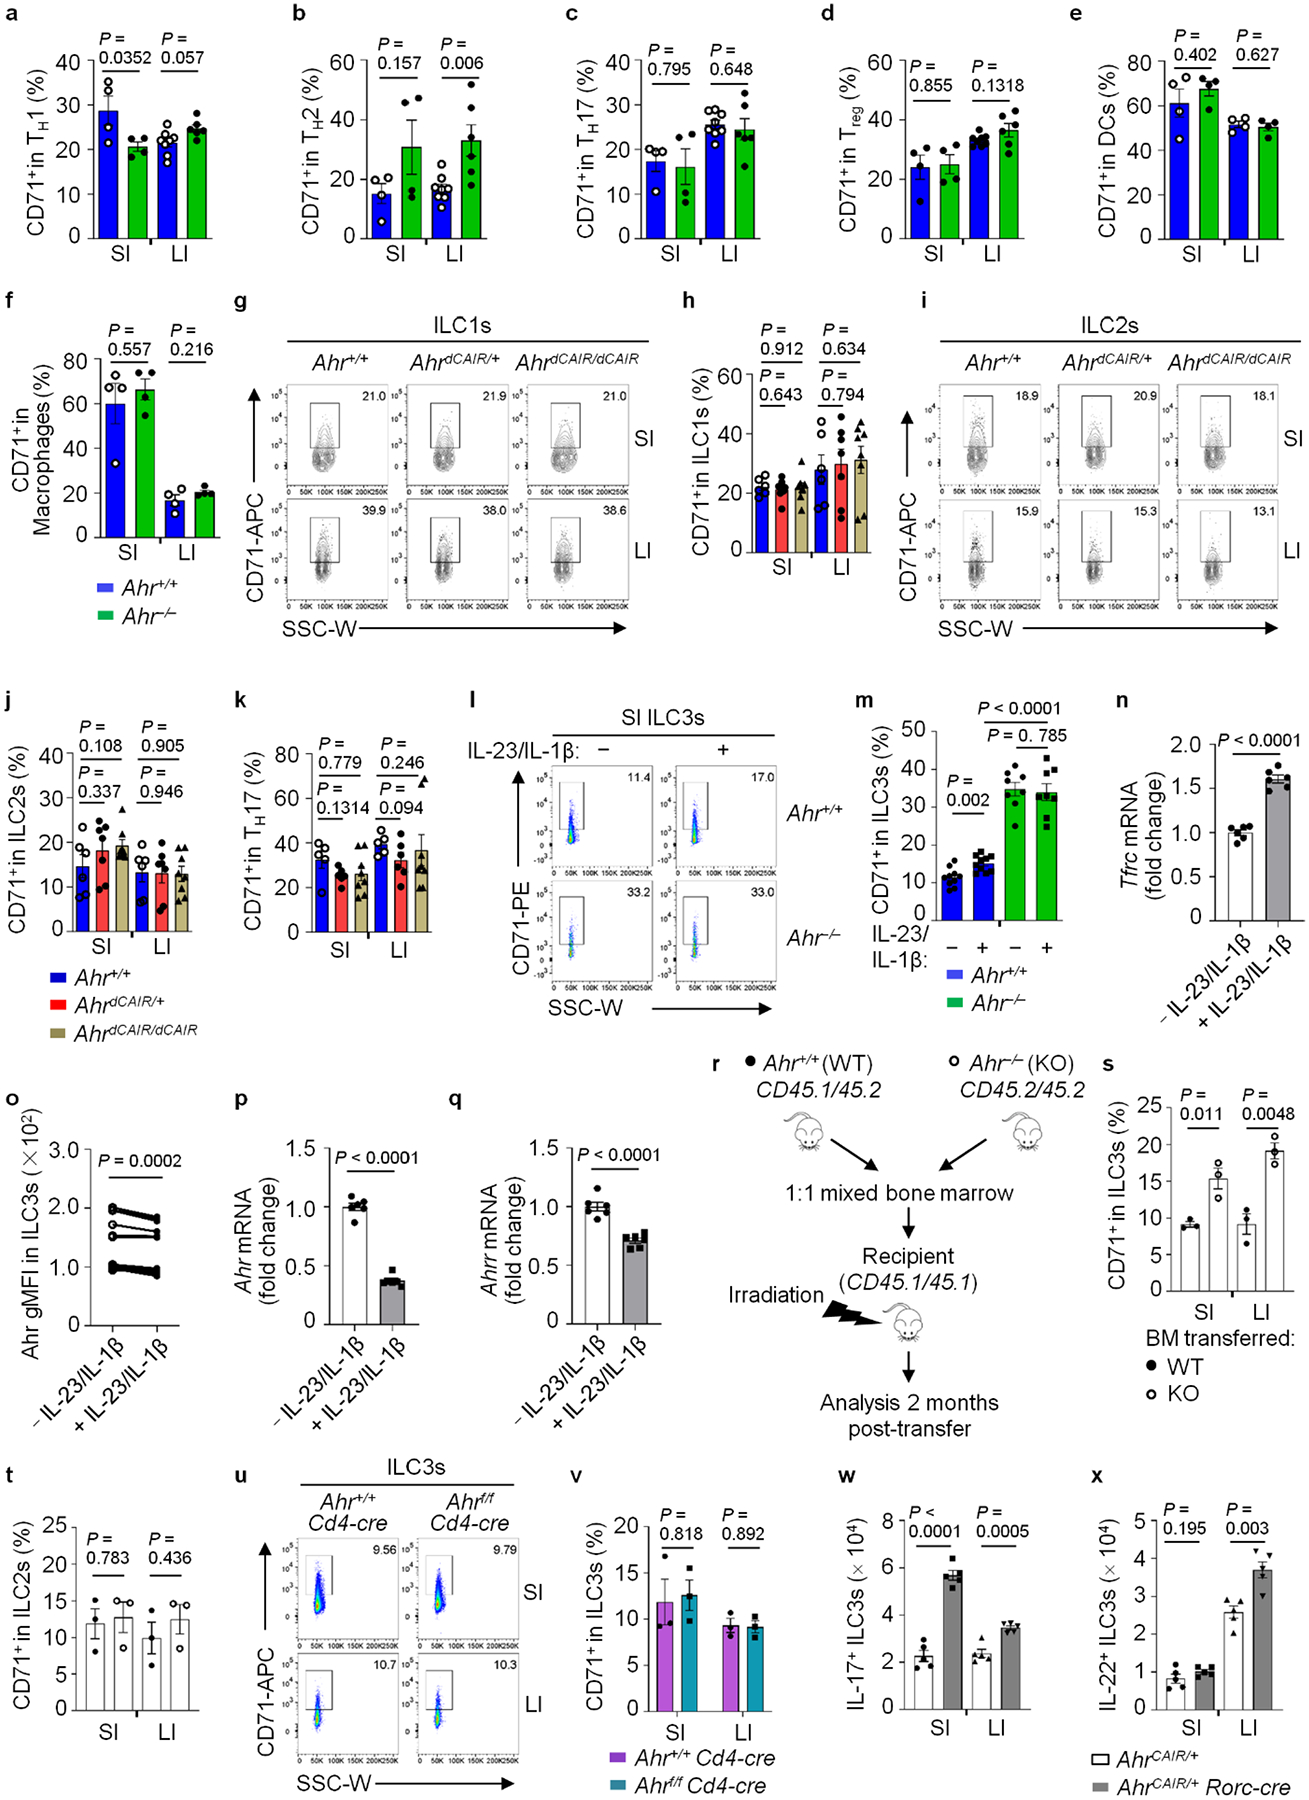
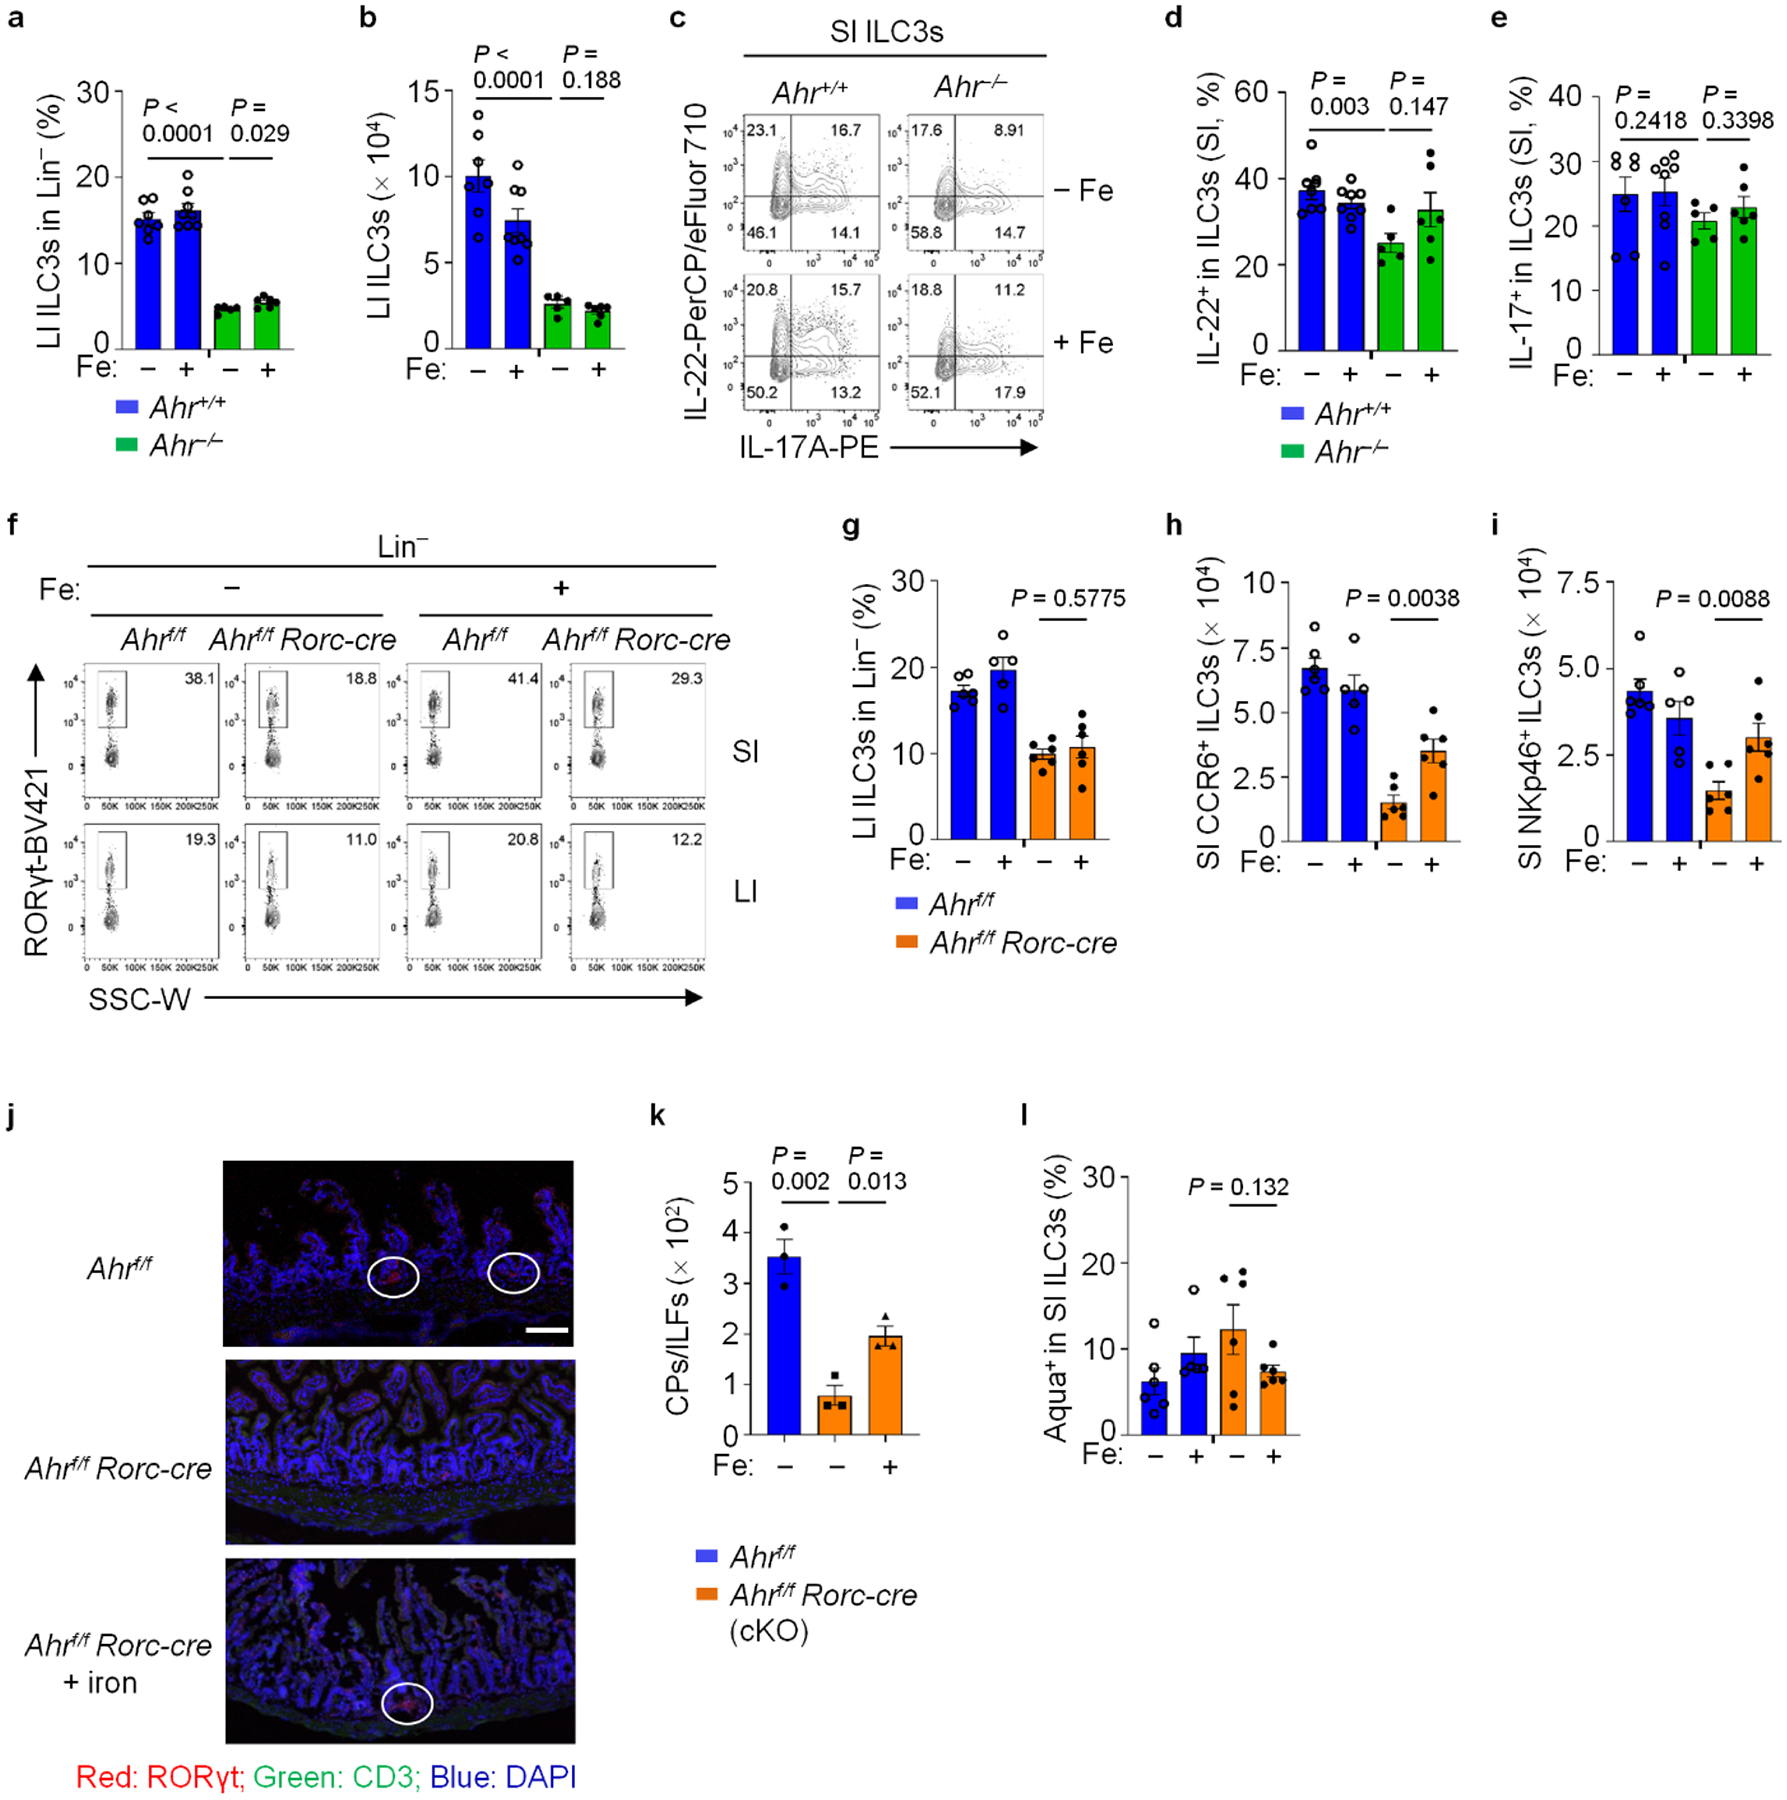
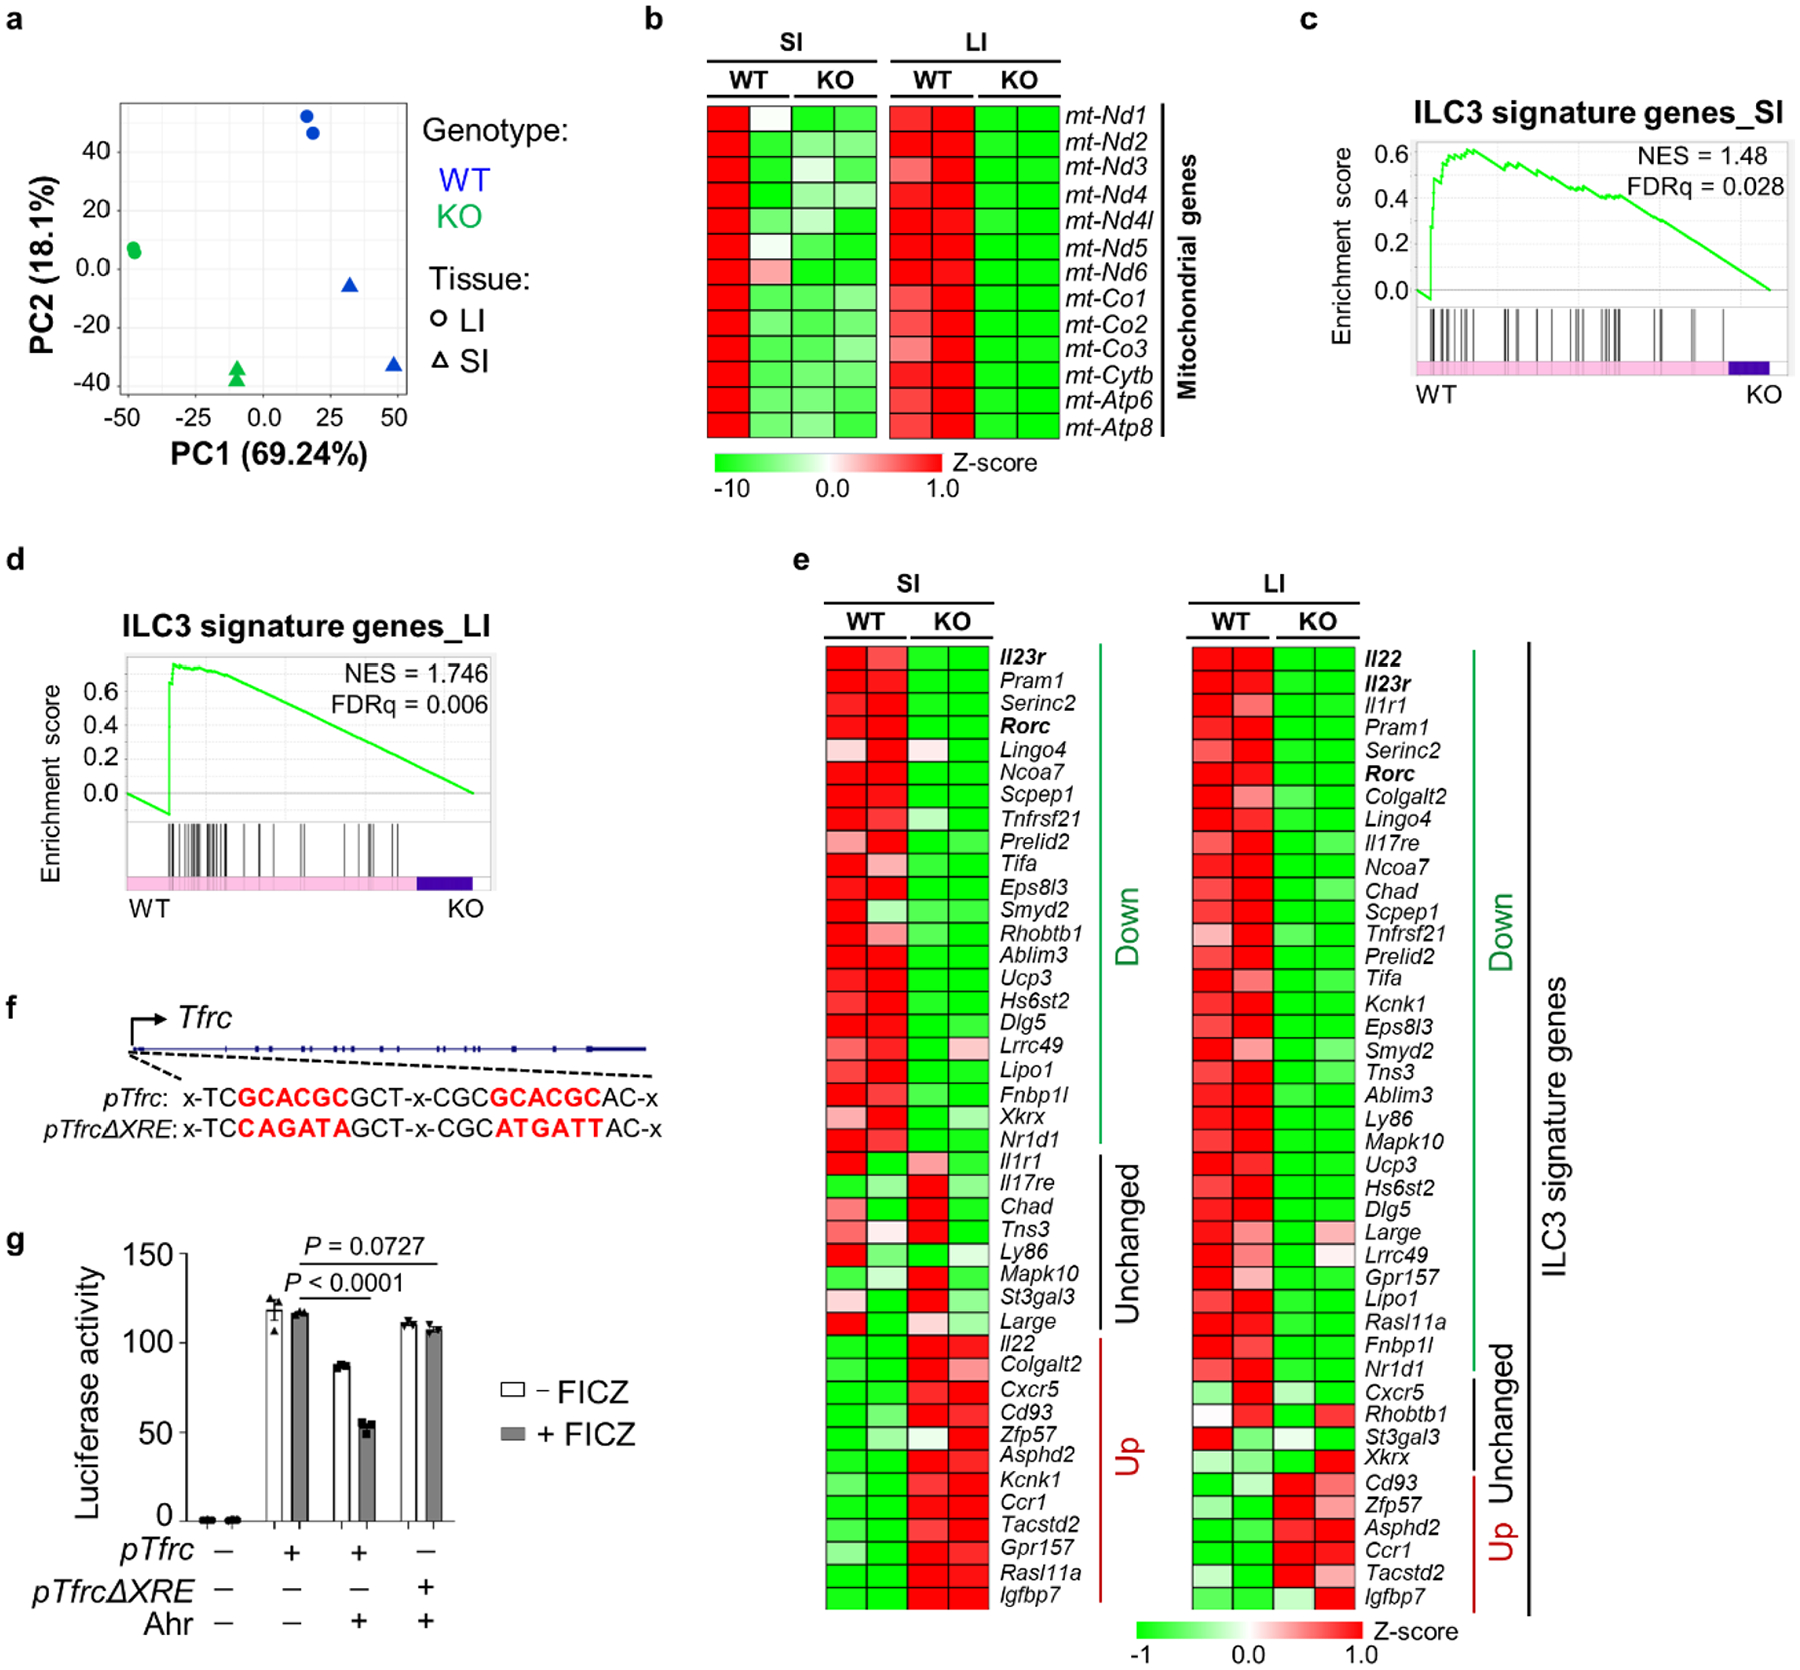
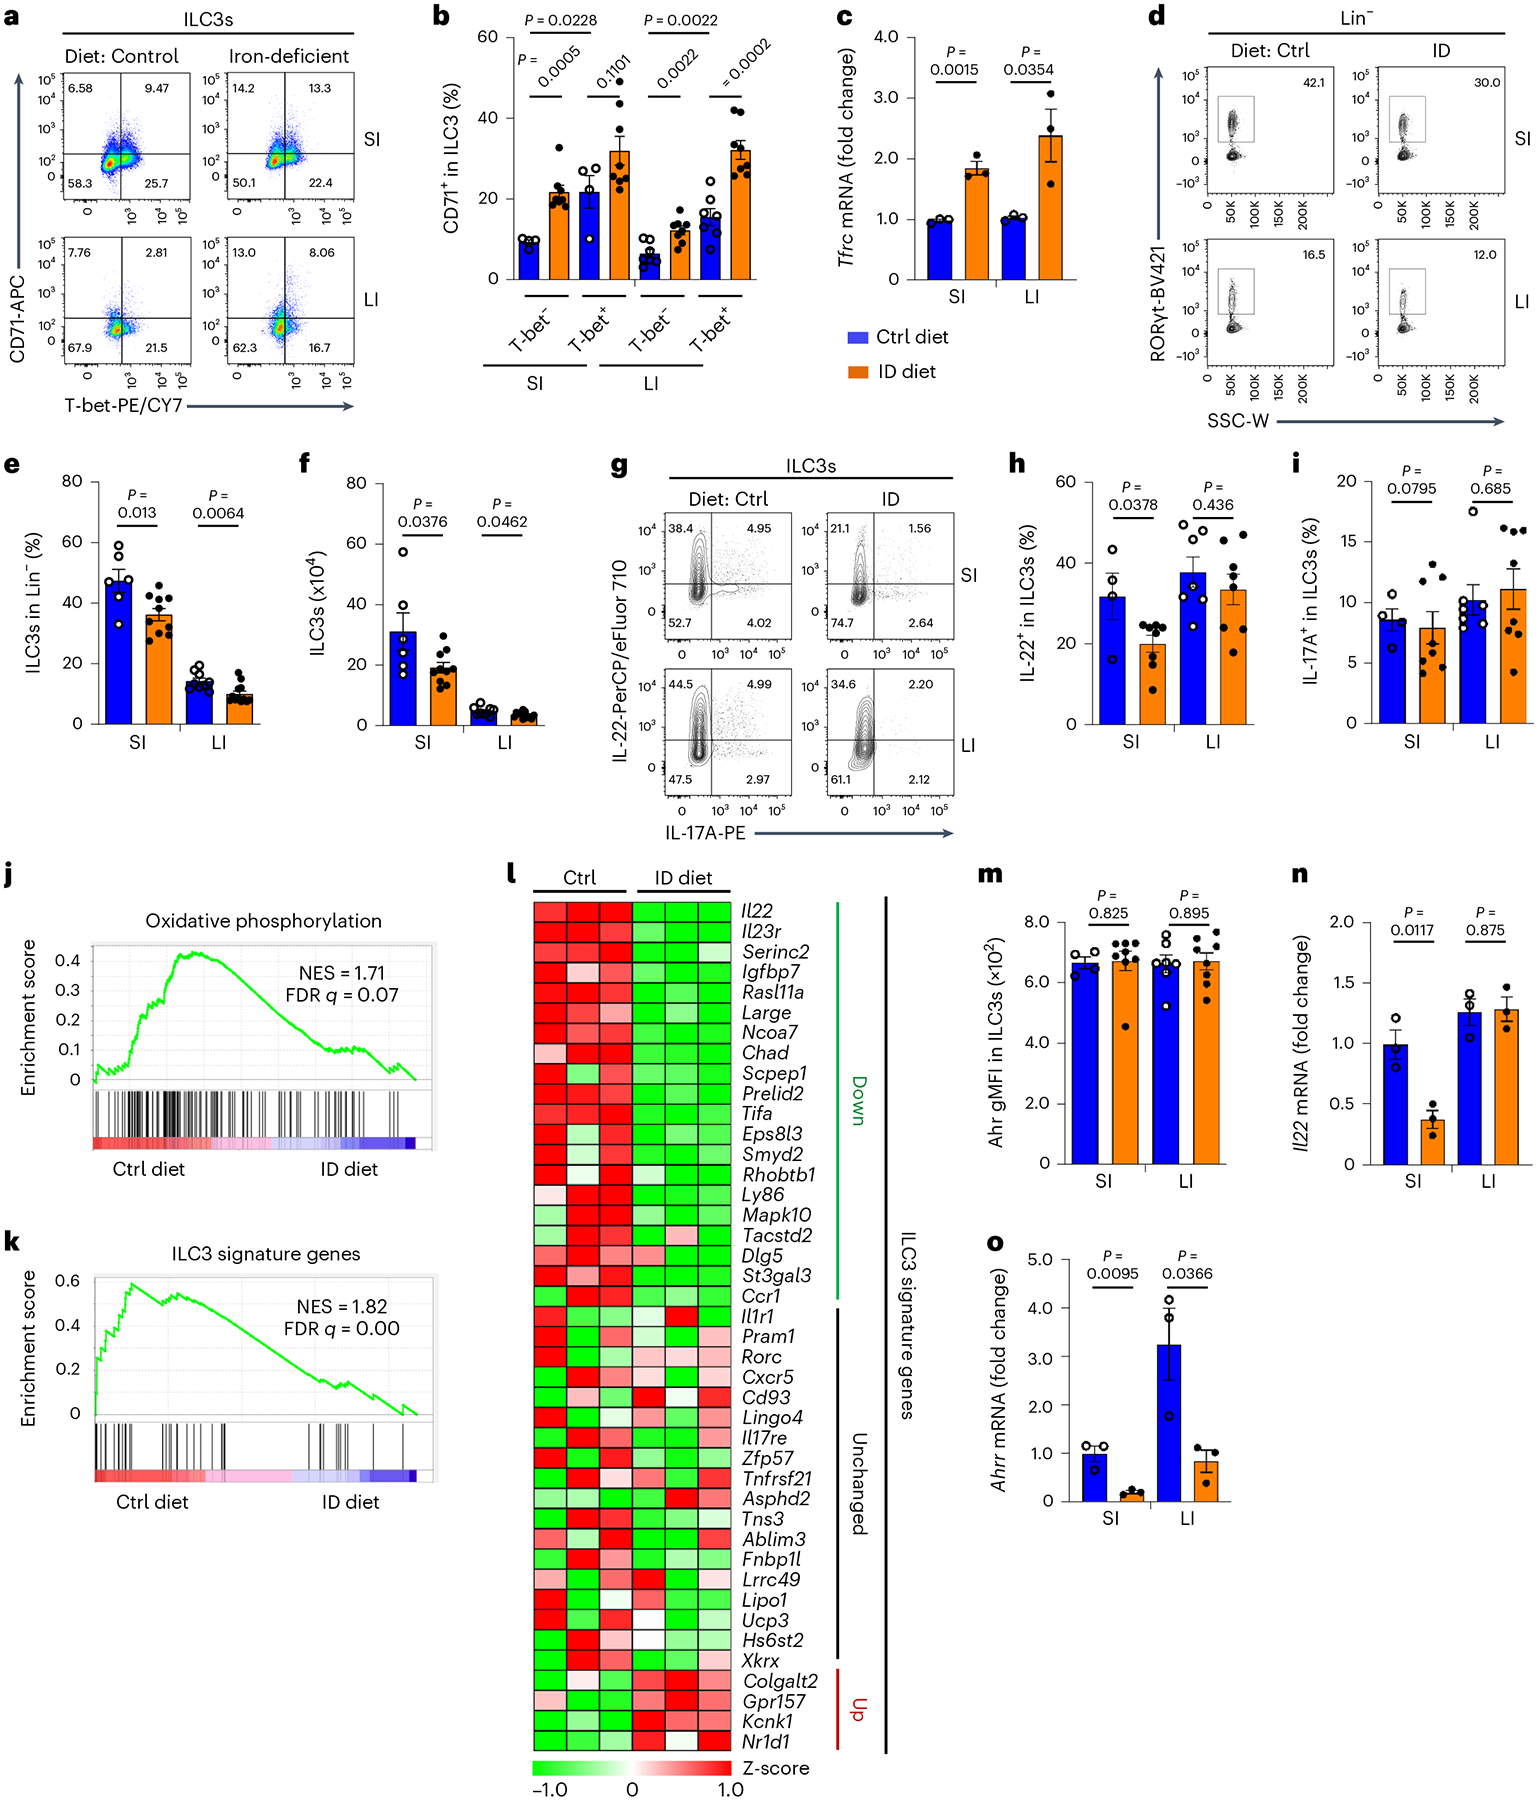
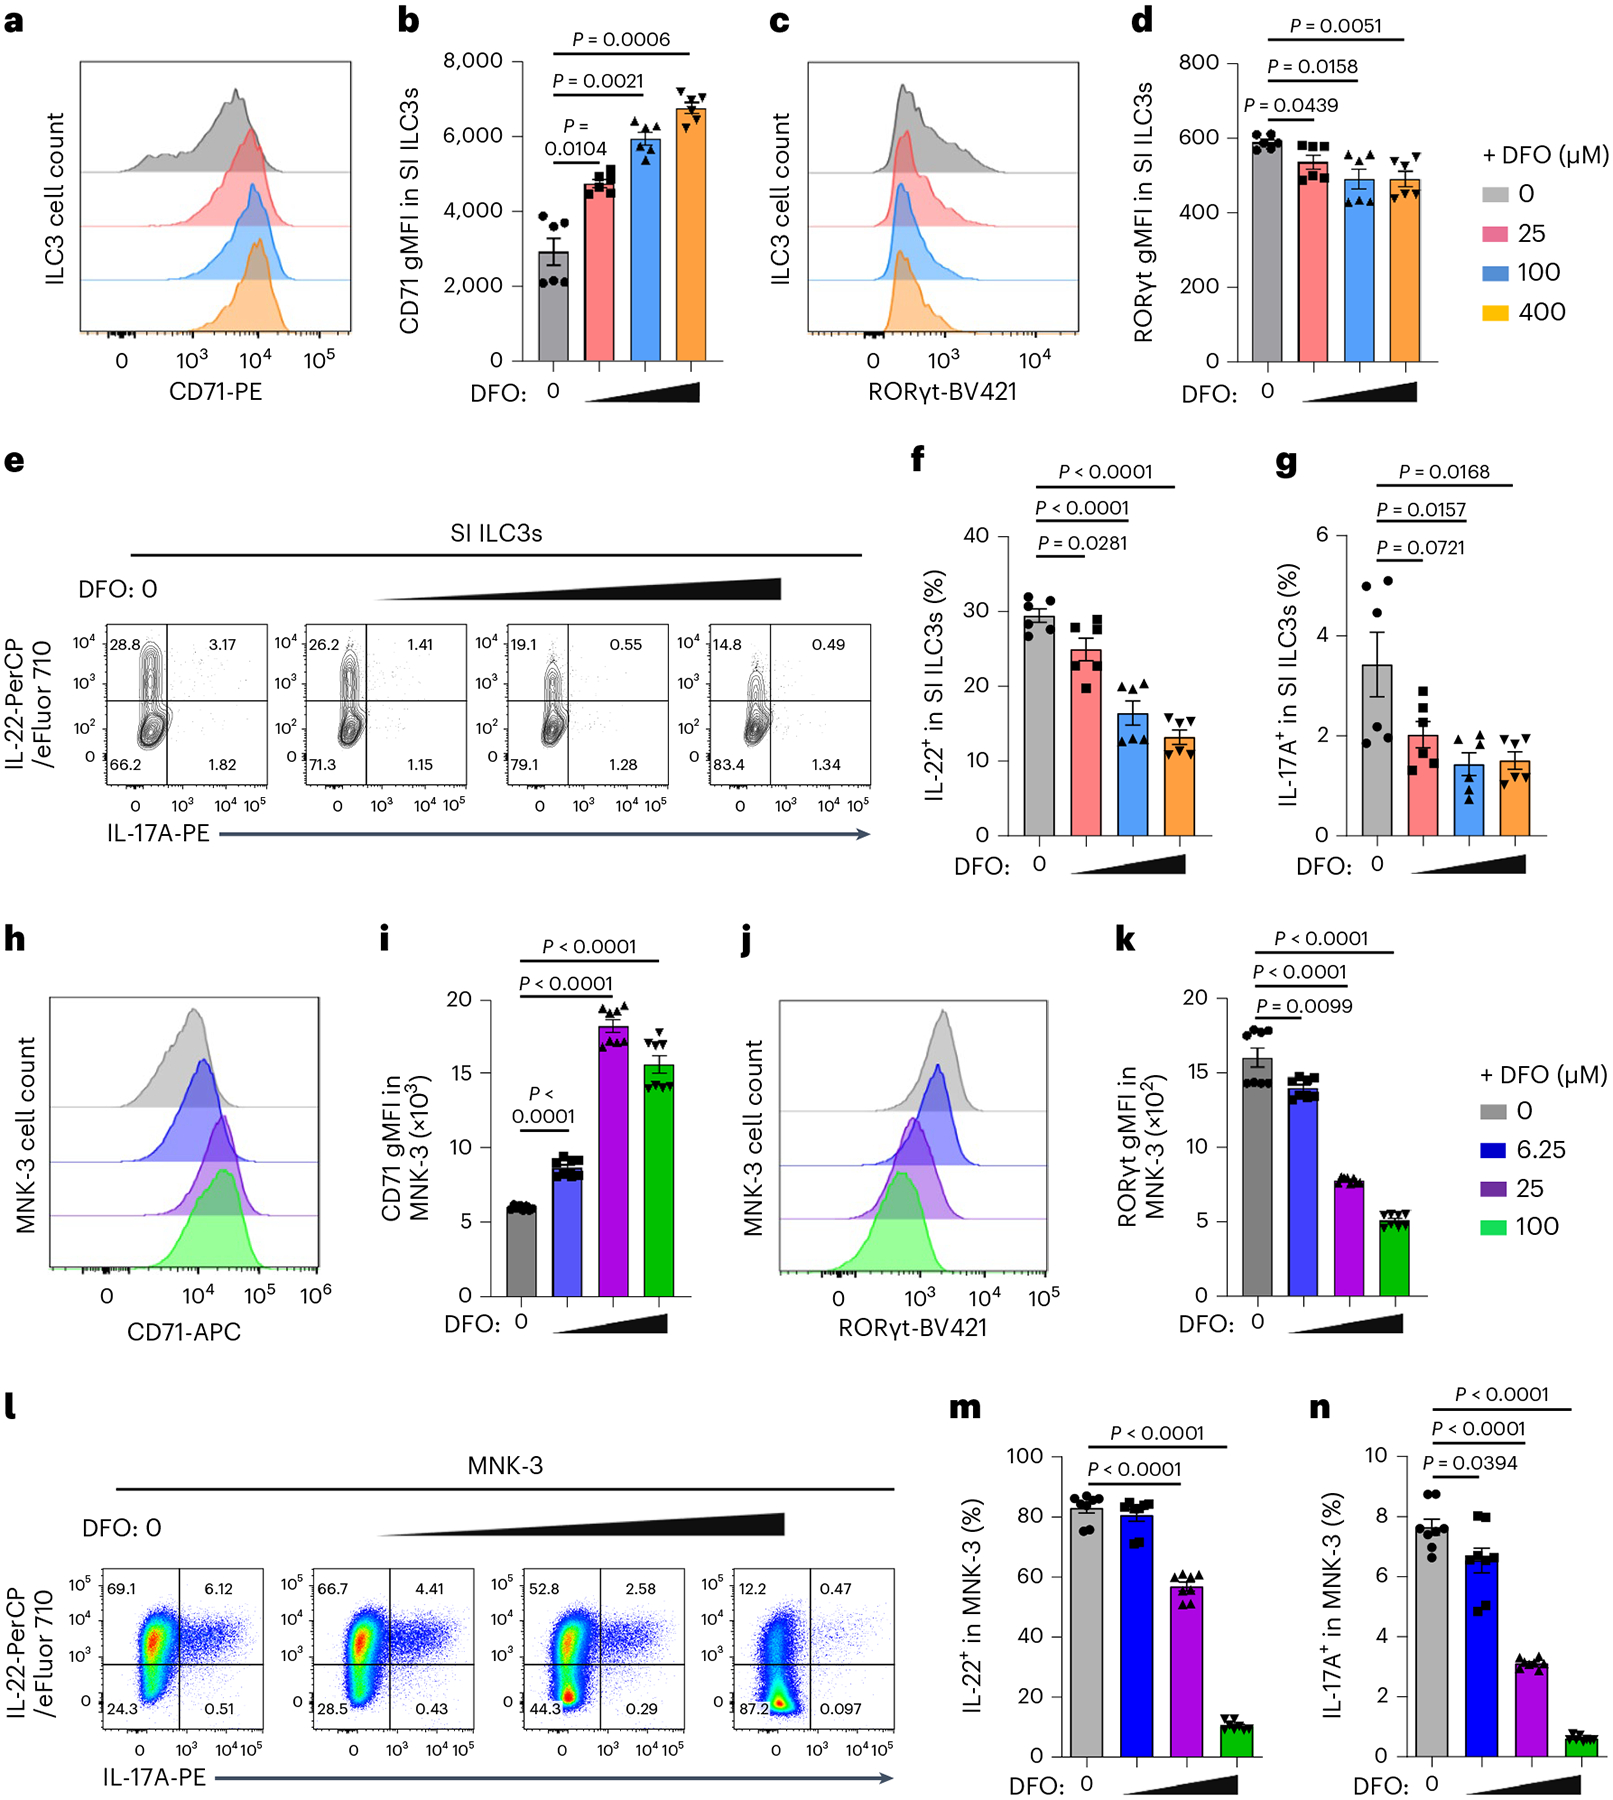
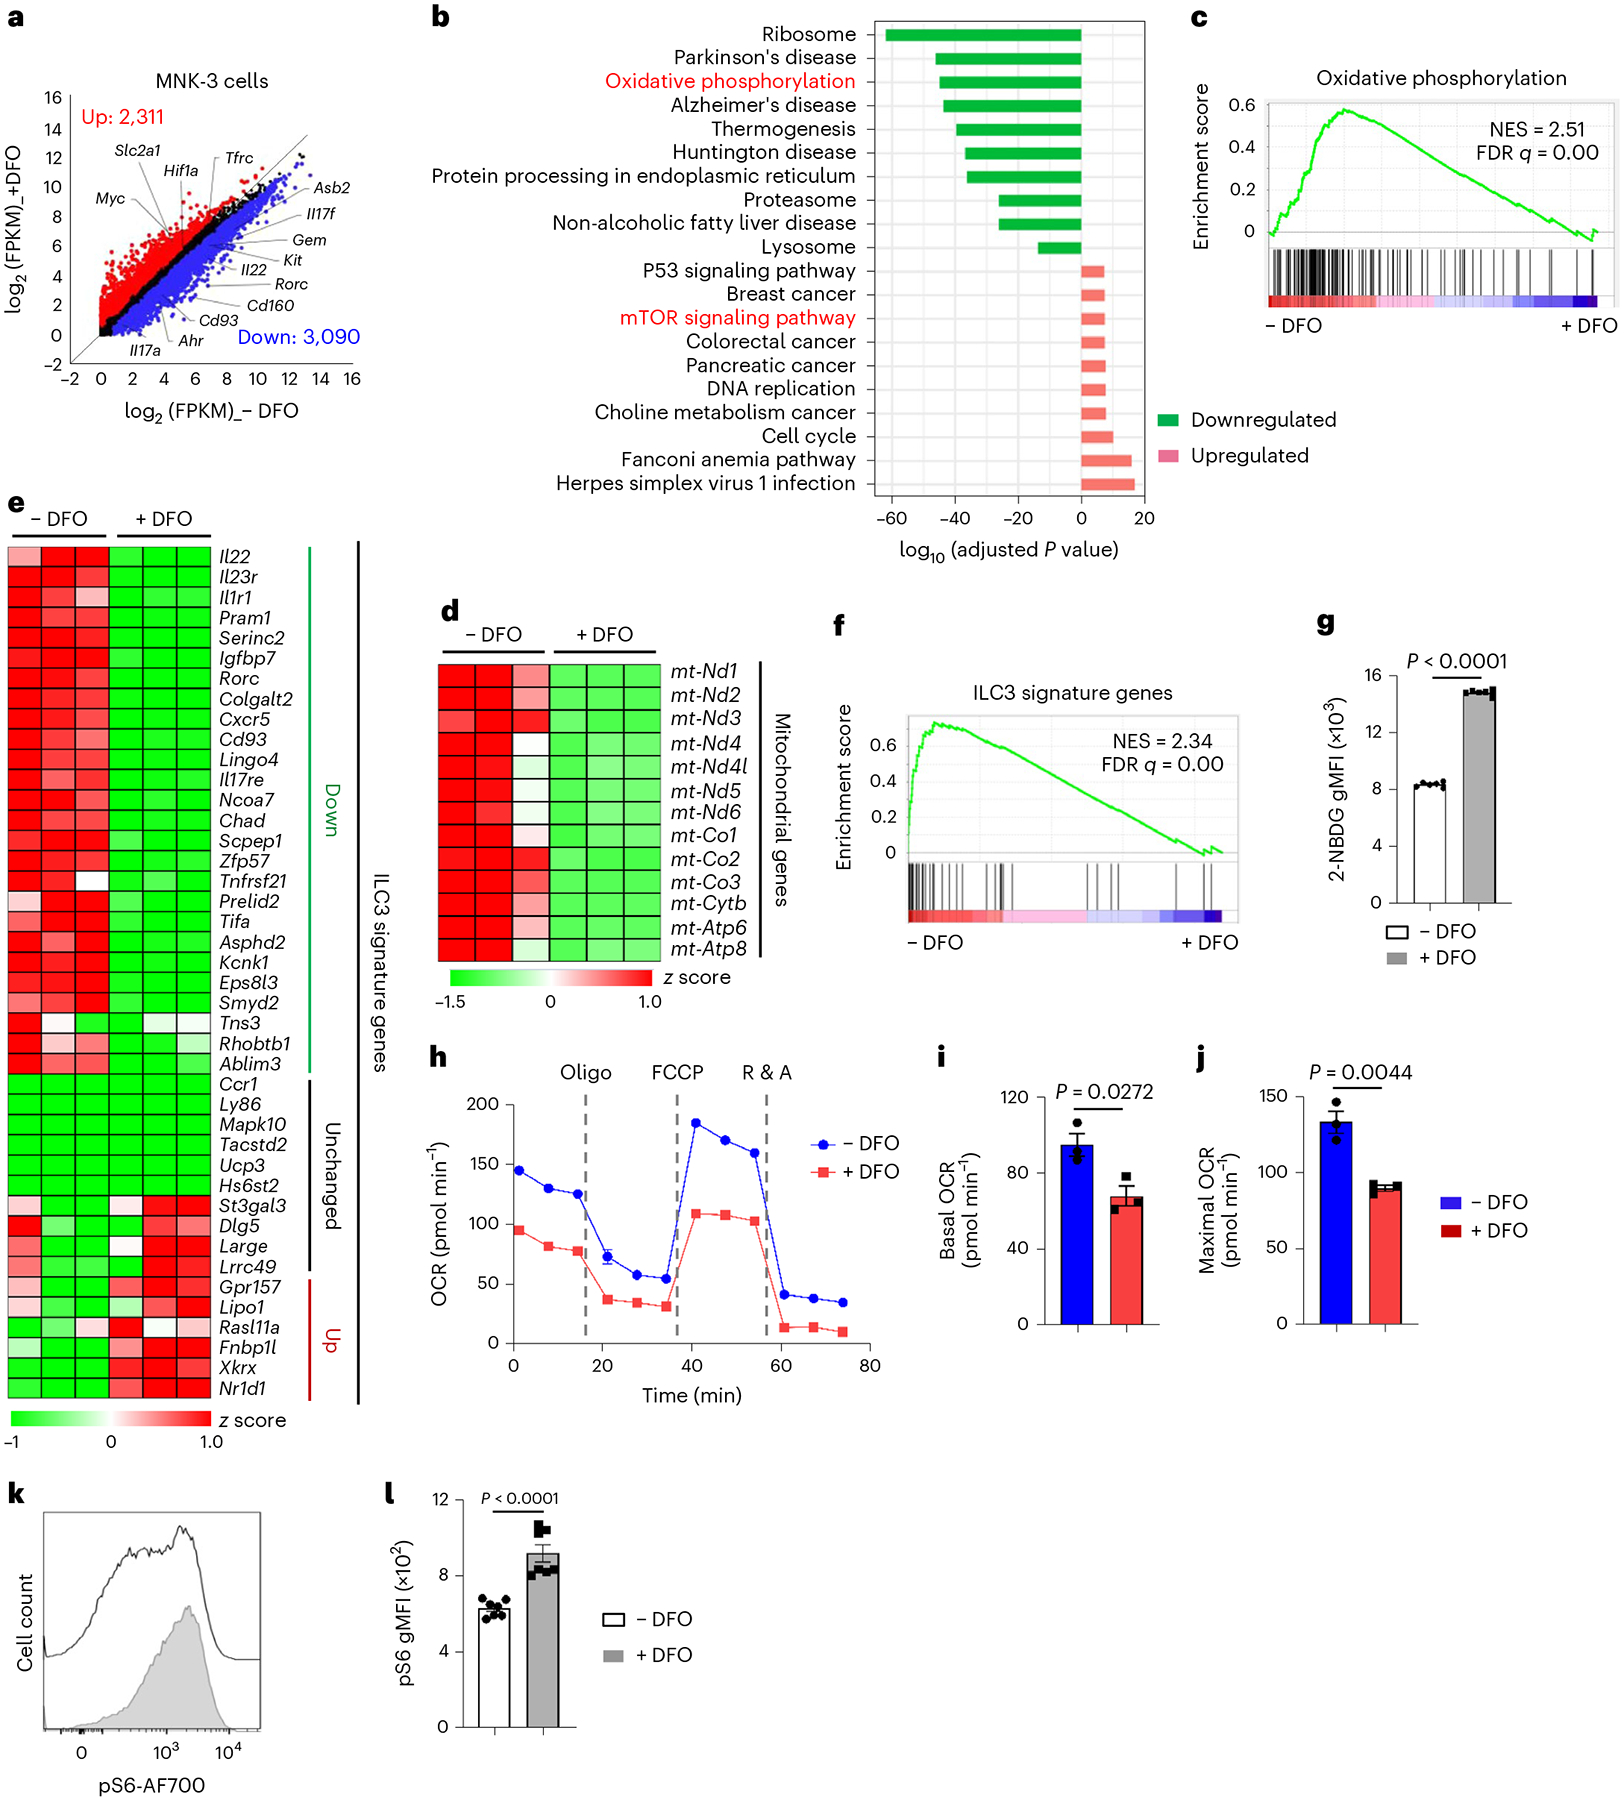
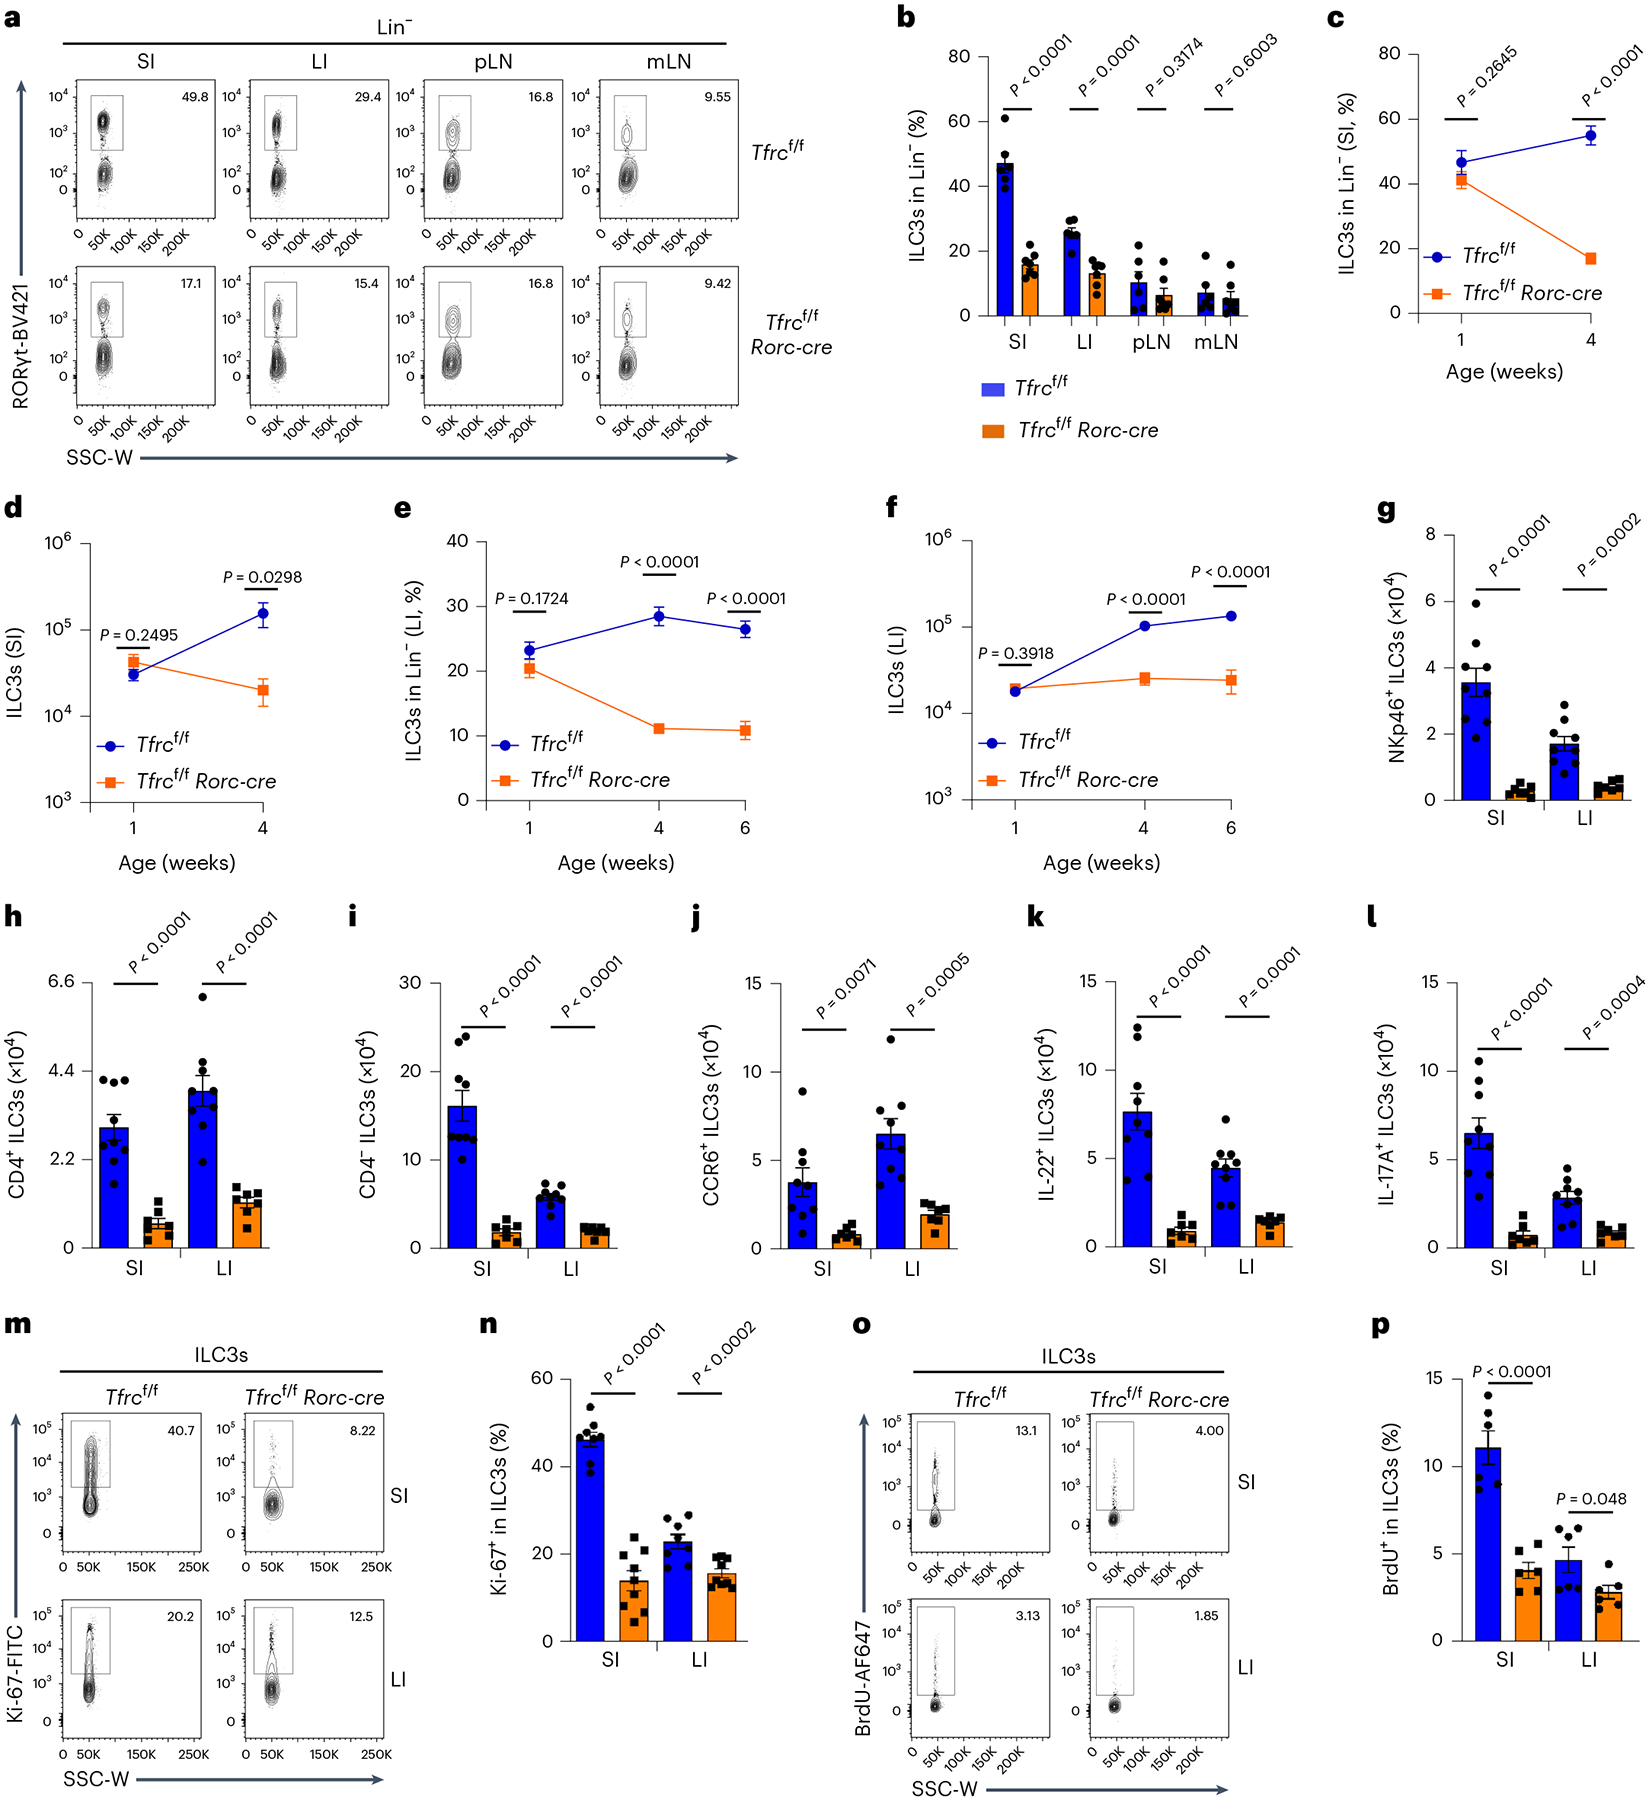
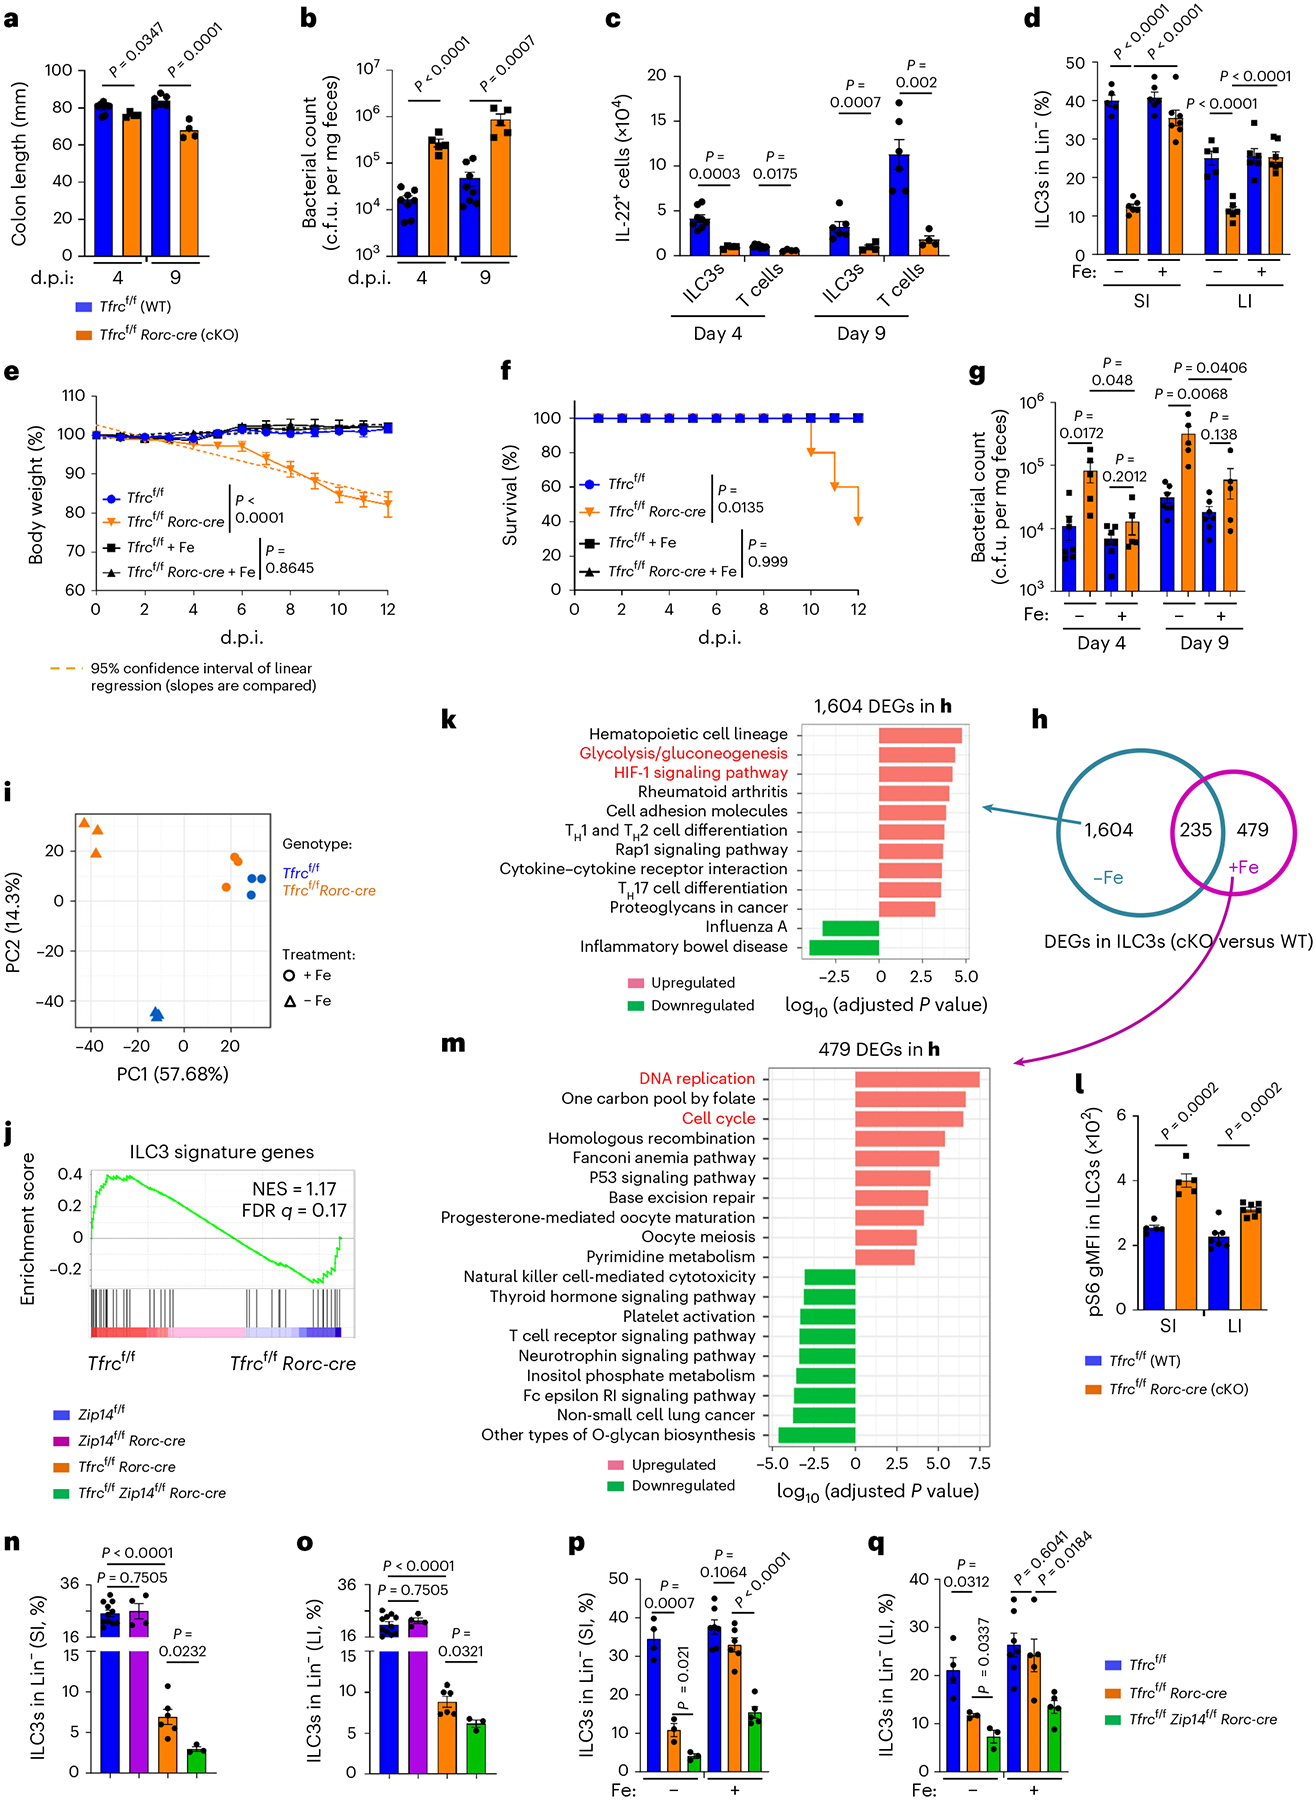
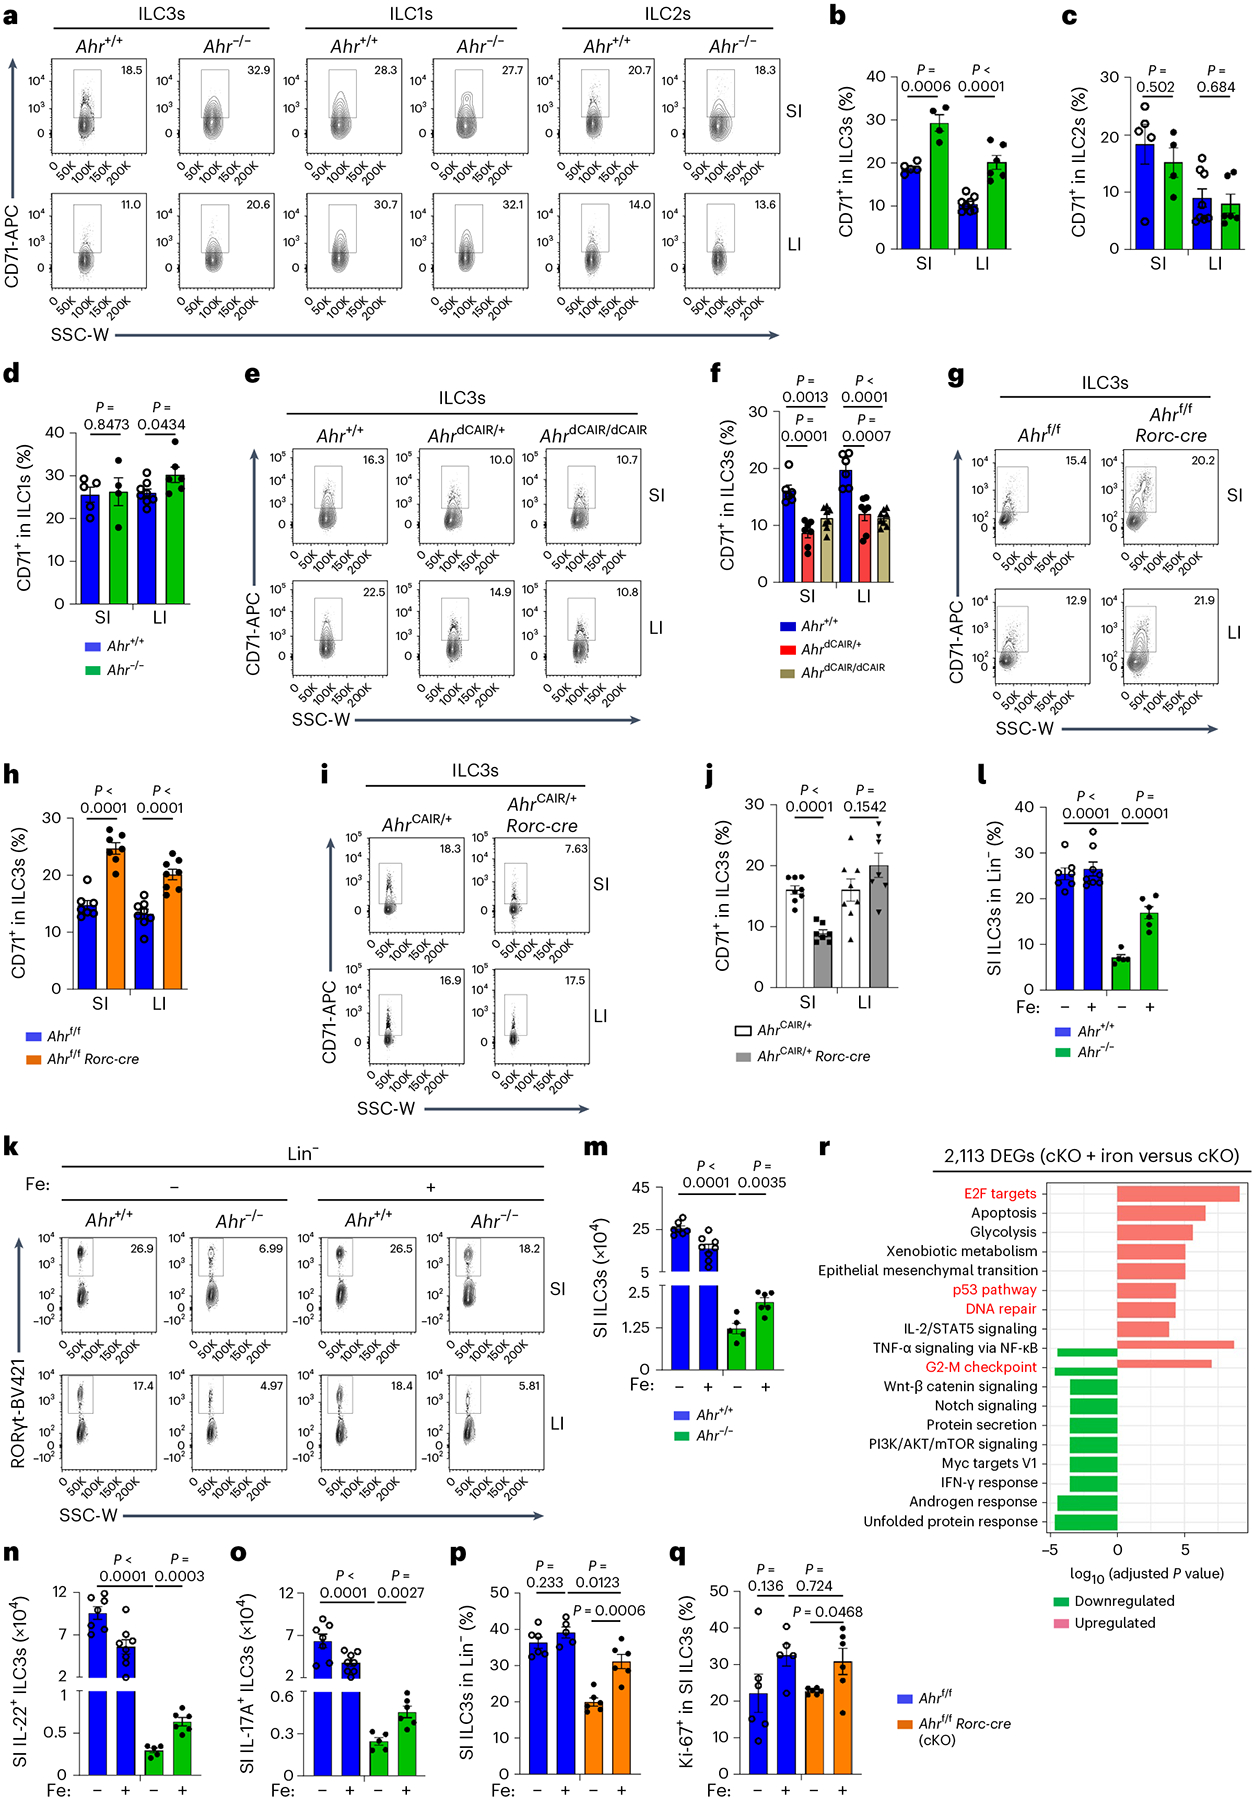
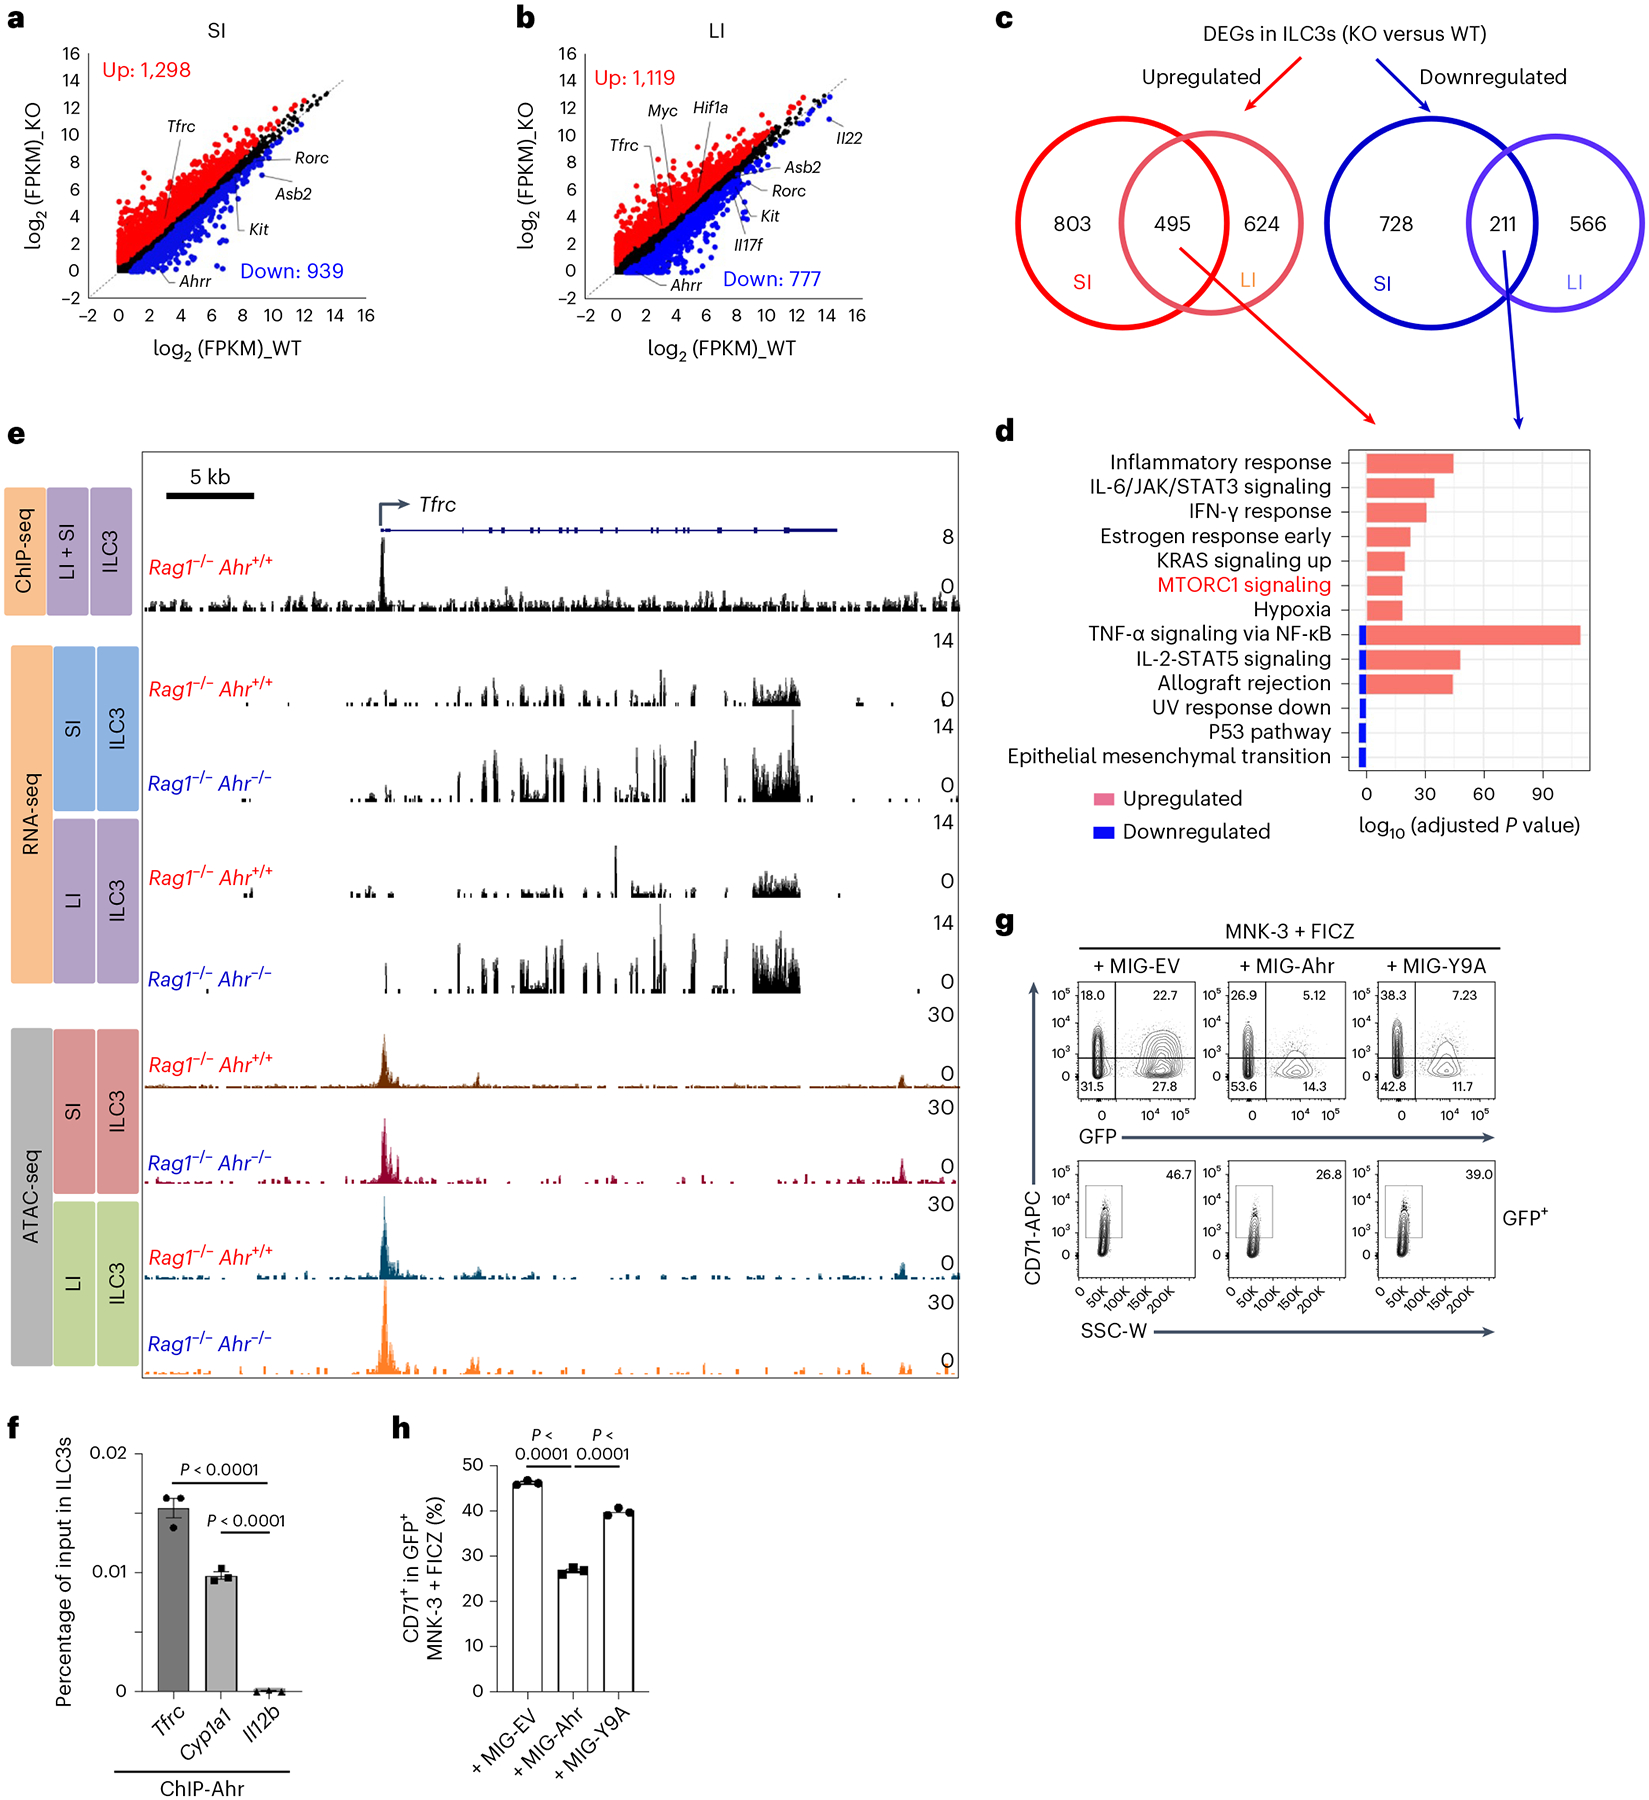
Iron metabolism is pivotal for cell fitness in the mammalian host; however, its role in group 3 innate lymphoid cells (ILC3s) is unknown. Here we show that transferrin receptor CD71 (encoded by Tfrc)-mediated iron metabolism cell-intrinsically controls ILC3 proliferation and host protection against Citrobacter rodentium infection and metabolically affects mitochondrial respiration by switching of oxidative phosphorylation toward glycolysis. Iron deprivation or Tfrc ablation in ILC3s reduces the expression and/or activity of the aryl hydrocarbon receptor (Ahr), a key ILC3 regulator. Genetic ablation or activation of Ahr in ILC3s leads to CD71 upregulation or downregulation, respectively, suggesting Ahr-mediated suppression of CD71. Mechanistically, Ahr directly binds to the Tfrc promoter to inhibit transcription. Iron overload partially restores the defective ILC3 compartment in the small intestine of Ahr-deficient mice, consistent with the compensatory upregulation of CD71. These data collectively demonstrate an under-appreciated role of the Ahr-CD71-iron axis in the regulation of ILC3 maintenance and function.


Conflict of interest statement

Competing interests

The authors declare no competing interests.

Figures

Extended Data Fig. 1 |
Extended Data Fig. 1 |. Iron-depleted diet impairs gut ILC3 maintenance and function (Related to Fig. 1).
3-week-old C57BL/6 wild-type (WT) mice were fed an iron-deficient (ID) or control (Ctrl) diet for 3 weeks before analysis. a and b, Hemoglobin concentrations (a) and MCV (b) in the indicated mice. Data are compiled from three independent experiments (n = 8 mice per group). c, Principal component analysis (PCA) plot of the RNA-seq for SI ILC3s in the indicated mice. d, Scatter-plot of log2 (FPKM) gene expression of FACS-sorted SI ILC3s from the indicated mice in RNA-seq analysis. DEGs (ID diet vs Ctrl diet, fold change ≥ 1.5, q value ≤ 0.05) are highlighted in blue (upregulated) and orange (downregulated), respectively (n = 3 mice per group). e, Heat map of the indicated gene expression in glycolysis pathway revealed by RNA-seq analysis. f, FACS analysis of Ahr expression in ILC3s of the mice with indicated treatments. Ahr–/– ILC3s were used as a negative control. Representative FACS plot of three independent experiments. g, Representative FACS gating/sorting strategies used for identification of different immune cell populations in this study.
Extended Data Fig. 2 |
Extended Data Fig. 2 |. Iron chelation represses ILC3 functions ex vivo and in vitro (Related to Fig. 2).
al, SI LPLs from WT mice were treated ex vivo with or without DFO for 16 h. Percentages of IFN-γ+ in ILC3s compiled from two independent experiments (n = 6 mice per group) (a), gMFI of MitoTracker Green FM (b), TMRE (c) and MitoSox (d) in ILC3s (n = 6 mice per group from two independent experiments). FACS analysis of CD71 expression in ILC2s and representative FACS plot of three independent experiments (e). Representative FACS plots (f), percentages of IL-5+ (g) and IL-13+ (h) cells in ILC2s compiled from two independent experiments (n = 6 mice per group) are shown. FACS analysis of CD71 expression in ILC1s and representative FACS plot of three independent experiments (i). Percentages of IFN-γ+ cells in ILC1s (j), IL-22+ (k) and IL-17A+ (l) cells in CD4+ T cells compiled from three independent experiments (n = 6 mice per group). ms, LI LPLs from WT mice were treated ex vivo with or without DFO for 16 h. FACS analysis of CD71 (m) and RORγt (o) expression in ILC3s and representative FACS plots of three independent experiments are shown. gMFI of CD71 (n) and RORγt (p) expression in ILC3s from three independent experiments (n = 3 mice per group) are shown. FACS analysis of IL-22 and IL-17A expression in ILC3s and representative FACS plot of three independent experiments (q). Percentages of IL-22+ (r) and IL-17A+ (s) in ILC3s from three independent experiments (n = 3 mice per group). t and u, MNK-3 cells were treated with or without DFO for 16 h in vitro. gMFI of Ki-67 expression in MNK-3 cells (t) and percentages of MNK-3 cell viability (u) (n = 8 biologically independent replicates per group from three independent experiments).
Extended Data Fig. 3 |
Extended Data Fig. 3 |. Iron depletion impairs mitochondrial function and switches OXPHOS to glycolysis in ILC3s (Related to Fig. 3).
a, PCA of RNA-seq analysis of MNK-3 cells treated with or without DFO for 16 h in vitro (n = 3 biologically independent replicates per group). bg, Mitochondrial mass and activity in MNK-3 cells. MitoTracker Green FM (b), TMRE (d) and MitoSox (f) intensity. Representative FACS plots of three independent experiments. gMFI of MitoTracker Green FM (c), TMRE (e) and MitoSox (g) (n = 6 biologically independent replicates per group). Data are compiled from three independent experiments. hj, Mitochondrial mass and activity of ILC3s from WT mice fed an ID or Ctrl diet. gMFI of MitoTracker Green FM (h), TMRE (i) and MitoSox (j) in ILC3s (control diet: n = 7; ID diet: n = 5). Data are compiled from three independent experiments. k, FACS analysis of 2-NBDG uptake in MNK-3 cells. Representative FACS plot of three independent experiments. ln, Seahorse metabolic flux analysis. Real-time ECAR (l) are representative of two independent experiments, and compiled data on quantification of basal (m) and maximal (n) ECAR of one experiment are shown (n = 3 biologically independent replicates per group). o and p, FACS analysis of IL-22 and IL-17A expression in MNK-3 cells transduced with the indicated retroviral constructs. The cells were treated with FICZ on day 2. Representative FACS plot (o) and percentages of IL-22+ cells in MNK-3 cells from two independent experiments (n = 6 biologically independent replicates per group) (p). q and r, FACS analysis of IL-22 and IL-17A expression in MNK-3 cells transduced with the indicated retroviral constructs. Representative FACS plot (q) and percentages of IL-22+ cells in MNK-3 cells compiled from two independent experiments (n = 3 biologically independent replicates per group) (r).
Extended Data Fig. 4 |
Extended Data Fig. 4 |. CD71 deficiency impairs ILC3 maintenance in a cell-intrinsic manner (Related to Fig. 4).
a, Tfrc mRNA determined by RT-qPCR in SI ILC3s. Data are compiled from three independent experiments (n = 3 mice per group). b and c, FACS analysis of intracellular Fe2+ in ILC3s. Representative FACS plot (b) and gMFI of Fe2+ in ILC3s (n = 3 mice per group) (c). d, Percentages of TH17 cells (CD4+TCRβ+Foxp3GATA3RORγt+) in CD4+ T cells from three independent experiments (Tfrcf/f: n = 6; Tfrcf/f Rorc-cre: n = 7). ek, FACS analysis of ILC3 subsets. NKp46 and RORγt expression in Lin (e), CD4 and RORγt expression in LinNKp46 (g), NKp46 and CCR6 expression in LinRORγt+ (j) LPLs. Percentages of NKp46+ ILC3s (f), CD4+ ILC3s (h) and CD4 ILC3s in Lin (i), and CCR6+ in ILC3s (k) from three independent experiments (Tfrcf/f: n = 9; Tfrcf/f Rorc-cre: n = 7). ln, FACS analysis of ILC3 cytokines. Representative FACS plot (l), percentages of IL-22+ (m) and IL-17A+ (n) cells in ILC3s from three independent experiments (Tfrcf/f: n = 9; Tfrcf/f Rorc-cre: n = 7). o and p, Percentages of Aqua+ in ILC3s from three independent experiments (Tfrcf/f: n = 7 per age; Tfrcf/f Rorc-cre: n = 6 (1-week-old and 4-week-old) or 5 (6-week-old)). q, FACS analysis of CD71 expression in CD4+ T cells and ILC3s. Representative FACS plots of three independent experiments. r and s, FACS analysis of RORγt expression in Lin LPLs. Representative FACS plot (r) and percentages of ILC3s from three independent experiments (Rag1−/− Tfrcf/f: n = 7; Rag1−/− Tfrcf/f Rorc-cre: n = 6) (s). t and u, FACS analysis of RORγt expression in Lin LPLs. Representative FACS plot (t) and percentages of ILC3s from three independent experiments (Tfrcf/f: n = 8; Tfrcf/f Cd4-cre: n = 6) (u).
Extended Data Fig. 5 |
Extended Data Fig. 5 |. CD71 ablation in ILC3s impairs gut immunity to C. rodentium infection (Related to Fig. 5).
Body weight (a) and survival (b) of C. rodentium-infected mice (Tfrcf/f: n = 8; Tfrcf/f Rorc-cre: n = 5). Statistical analysis by the log-rank test. Data are compiled from three independent experiments. c, TH17 percentages in CD4+ T cells in C. rodentium-infected mice from two independent experiments (for each time point: Tfrcf/f: n = 8 and 6; Tfrcf/f Rorc-cre: n = 4). d and e, FACS analysis of CD71 in ILC3s of WT (Tfrcf/f) mice treated with or without iron dextran. Representative FACS plot (d) and percentages of CD71+ cells in ILC3s from three independent experiments (n = 5 for untreated; n = 7 for treated) (e). f, Heat map of OXPHOS pathway and ILC3 signature genes by RNA-seq analysis of SI ILC3s (n = 3 mice per group). g, GSEA showing glycolysis gene pathway enrichment in the indicated ILC3s. h, Representative FACS plot of pS6 in ILC3s of three independent experiments. ik, FACS analysis of mitochondrial mass and activity. gMFI of MitoTracker Green FM (i) (n = 3 mice per group), TMRE (j) (Tfrcf/f: n = 6; Tfrcf/f Rorc-cre: n = 4), MitoSox (k) (Tfrcf/f: n = 6; Tfrcf/f Rorc-cre: n = 5) in ILC3s from three independent experiments. lq, RNA-seq analysis of SI ILC3s from mice with or without iron dextran treatment (n = 3 mice per group). Heat map of the DEGs by RNA-seq analysis in the indicated ILC3s shown in Fig. 5h (l). GSEA showing ILC3 signature gene enrichment (m). FPKM of Ahrr, Gem and Osgin1 in the indicated ILC3s (np) (n = 3 mice per group). GO analysis showing enriched top 10 pathways of the shared 235 DEGs (cKO vs WT, with or without iron dextran) shown in Fig. 5h (q).
Extended Data Fig. 6 |
Extended Data Fig. 6 |. Zip14 is a NTBI transporter in ILC3s (Related to Fig. 5).
a, FACS analysis of RORγt expression in Lin LPLs of the indicated mice, with or without iron dextran treatment. Representative FACS plot of three independent experiments are shown. b, Schematic depiction of experimental design for iron dextran pre-treatment, followed by C. rodentium infection. c, FPKM of literature-reported iron-related potential transporters in RNA-seq of SI ILC3s from WT mice (n = 3 mice per group). d, FPKM of RNA-seq of MNK-3 cells treated with or without DFO (100 μM) for 16 h in vitro (n = 3 biologically independent replicates per group). e, Expression of Slc39a14 and Slc39a8 mRNA determined by RT-qPCR in ILC3s from SI LPLs of Zipf/f and Zip14f/f Rorc-cre littermate mice. Data are representative of two independent experiments (n = 3 mice per group). f, FACS analysis of RORγt expression in Lin LPLs of the indicated mice. Representative FACS plot of three independent experiments. g, FACS analysis of RORγt expression in Lin LPLs of the indicated mice with or without iron dextran treatment. Representative FACS plot of three independent experiments. h and i, Expression of Slc39a8 and Slc11a2 mRNA determined by RT-qPCR in ILC3s from the indicated mice treated with iron dextran (n = 3 mice per group). Data are compiled from two independent experiments.
Extended Data Fig. 7 |
Extended Data Fig. 7 |. Microbiota inhibit CD71 expression in an Ahr-dependent manner (Related to Fig. 6).
ad, Fecal microbiome analysis of the indicated mice. Bacterial (Class) abundance (a) and Shannon Index measuring bacterial diversity (b) revealed by 16 S rRNA gene sequencing in the indicated cohoused mice (Tfrcf/f: n = 7; Tfrcf/f Rorc-cre: n = 6). Data are displayed as box and whisker plots showing the median and the 25th and 75th percentiles and two whiskers at the minimum and maximum Shannon Entropy Index. Statistical significance was determined using the Kruskal-Wallis test. H. apodemus (c) and H. typhlonius (d) bacterial abundance measured by qPCR in the indicated cohoused mice (Tfrcf/f: n = 7; Tfrcf/f Rorc-cre: n = 6). eg, FACS analysis of CD71 expression in ILC3s and TH17 cells in WT SPF and GF mice. Representative FACS plot (e) and percentages of CD71+ cells in ILC3s from three independent experiments (n = 7 mice per group) are shown (f). Percentages of CD71+ cells in TH17 cells from three independent experiments (n = 7 mice per group) are shown (g). Representative FACS plot of CD71 (h) and percentages of CD71+ cells in ILC3s from LI LPLs of the indicated mice treated with broad-spectrum antibiotics (abx) or control water. Data are compiled from five independent experiments (n = 10 for controls; n = 8 for abx-treated) (i). Representative FACS plot (j) and percentages of IL-22+ cells in ILC3s from four independent experiments (Ahr+/+: n = 8 and 7 for control and abx-treated groups; Ahr−/−: n = 7 and 5 for control and abx-treated groups) (k). ln, Il22 (l), Ahrr (m) and Cyp1a1 (n) mRNA determined by RT-qPCR in LI tissues of the indicated mice treated with abx or control water (n = 3 mice per group compiled from two independent experiments).
Extended Data Fig. 8 |
Extended Data Fig. 8 |. Ahr cell-intrinsically inhibits CD71 transcription in ILC3s (Related to Fig. 6).
af, CD71+ percentages in the indicated cells. Data are compiled from three independent experiments (ad: Ahr+/+: n = 4 and 8 for SI and LI; Ahr−/−: n = 4 and 6 for SI and LI); (e and f: n = 4 mice per group). gk, FACS analysis of CD71 in the indicated cells. Representative FACS plots (g and i), and CD71+ percentages in ILC1s (h), ILC2s (j), TH17 cells (k) from three independent experiments (Ahr+/+: n = 6; AhrdCAIR/+: n = 7; AhrdCAIR/dCAIR: n = 8). lq, FACS analysis of CD71 in the indicated ILC3s with or without IL-23 and IL-1β treatment for 6 hours ex vivo. Representative FACS plot (l) and CD71+ percentages in ILC3s compiled from three independent experiments (Ahr+/+: n = 10 per group; Ahr−/−: n = 8 per group) (m). Tfrc mRNA (n), gMFI of the Ahr (o), Ahr (p) and Ahrr (q) mRNAs determined by RT-qPCR in the indicated SI ILC3s (n = 6 mice per group from three independent experiments). rt, Mixed bone marrow (BM) experiment. Data are compiled from two independent experiments (n = 3 mice per group). A schematic depiction of experimental design (note: donor cells were age and sex matched; recipients and donors were sex matched) (r), and CD71+ percentages in the indicated ILC3s (s) and ILC2s (t). u and v, FACS analysis of CD71 in ILC3s. Representative FACS plot (u) and CD71+ percentages in ILC3s from two independent experiments (n = 3 mice per group) (v). w and x, FACS analysis of IL-17A and IL-22 in ILC3s. Absolute numbers of IL-17A+ (w) and IL-22+ (x) ILC3s in the indicated mice (n = 5 mice per group from two independent experiments).
Extended Data Fig. 9 |
Extended Data Fig. 9 |. Iron treatment alleviates ILC3 defects in Ahr-deficient mice (Related to Fig. 6).
a and b, LI-ILC3 percentages in Lin LPLs (a) and absolute numbers (b) in the indicated mice with or without iron dextran treatment. Data are compiled from three independent experiments (Ahr+/+: n = 7 and 8 for untreated and treated; Ahr−/−: n = 5 and 6 for untreated and treated). ce, FACS analysis of IL-22 and IL-17A expression in SI ILC3s of the indicated mice. Representative FACS plot (c), IL-22+ (d) and IL-17A+ (e) percentages in the indicated ILC3s from three independent experiments (Ahr+/+: n = 7 and 8 for untreated and treated; Ahr−/−: n = 5 and 6 for untreated and treated). f and g, FACS analysis of RORγt in Lin LPLs of the mice with indicated treatment. Representative FACS plot (f) and LI-ILC3 percentages in Lin LPLs from three independent experiments (g) (Ahrf/f: n = 6 and 5 for untreated and treated; Ahrf/f Rorc-cre: n = 6 mice per group). h and i, Numbers of CCR6+ ILC3s (h) and NKp46+ ILC3s (i) in SI LPLs of the indicated mice from three independent experiments (Ahrf/f: n = 6 and 5 for untreated and treated; Ahrf/f Rorc-cre: n = 6 mice per group). j, Cryptopatches (CPs)/intestinal lymphoid follicles (ILFs) in representative SI sections of the indicated mice were stained with RORγt (red), CD3 (green), and DAPI (blue) and analyzed by fluorescence microscopy. Scale bar, 100 μm. Data are representative of two independent experiments. k, Numbers of CPs/ILFs in the SI of the indicated mice (n = 3 mice per group compiled from two independent experiments). l, Percentages of Aqua+ in SI ILC3s from three independent experiments (Ahrf/f: n = 6 and 5 for untreated and treated; Ahrf/f Rorc-cre: n = 6 mice per group).
Extended Data Fig. 10 |
Extended Data Fig. 10 |. Ahr regulates CD71 transcription by directly binding to the Tfrc locus (Related to Fig. 7).
ae, RNA-seq analysis of ILC3s from SI and LI LPLs of Rag1−/−Ahr+/+ (WT) and Rag1−/−Ahr−/− (KO) littermate mice (n = 2 mice per group). PCA plot revealed by RNA-seq analysis of ILC3s from the indicated mice (a). Heat maps of the indicated mitochondria-encoding gene expression revealed by RNA-seq analysis (b). GSEA showing enrichment of ILC3 signature genes in SI (c) and LI (d) ILC3s in RNA-seq analysis. Heat maps of the ILC3 signature gene expression revealed by RNA-seq analysis (e). f, Schematic depiction of the Ahr motifs (highlighted in red) in the Ahr ChIP-seq peak at the Tfrc promoter. g, The firefly luciferase pTfrc-pGL2B or pTfrcΔXRE-pGL2B constructs and pRL-TK-Renilla luciferase construct were co-transfected into HEK293T cells, together with Ahr-expression or control plasmids. Cells were stimulated with or without FICZ and the firefly luciferase activity was normalized to Renilla luciferase activity. Representative data of two independent experiments (n = 3 biologically independent replicates per group from one experiment) are shown.
Fig. 1 |
Fig. 1 |. Iron-depleted diet impairs gut ILC3 maintenance and function.
The 3-week-old WT mice were fed an iron-deficient (ID) or control (Ctrl) diet for 3 weeks before analysis. a,b, FACS analysis of CD71 and T-bet expression in ILC3s of the indicated mice. Representative FACS plot (a) and percentages of CD71+ cells in ILC3s compiled from three independent experiments (control diet, n = 4 and 7 mice for SI and LI; ID diet, n = 8 mice for SI and LI) are shown (b). c, Expression of Tfrc mRNA determined by RT–qPCR in SI ILC3s. Data are compiled from three independent experiments (n = 3 mice per group). df, FACS analysis of RORγt expression in Lin LPLs of the indicated mice. Representative FACS plot (d) and percentages of ILC3s in Lin LPLs (e) and absolute numbers of ILC3s (f) compiled from four independent experiments (control diet, n = 6 and 9 for SI and LI; ID diet, n = 10 and 12 for SI and LI) are shown. gi, FACS analysis of IL-22 and IL-17A expression in ILC3s of the indicated mice. Representative FACS plot (g) and percentages of IL-22+ (h) and IL-17A+ (i) cells in ILC3s compiled from three independent experiments (control diet, n = 7 and 4 for SI and LI; ID diet, n = 8) are shown. j,k, GSEA showing enrichment of genes of OXPHOS pathway (j) and ILC3 signature genes (k) in RNA-seq analysis (n = 3 mice per group). l, Heat map of the ILC3 signature gene expression revealed by RNA-seq analysis. m, Geometric mean fluorescence intensity (gMFI) of the Ahr expression in ILC3s of the indicated mice. Data are compiled from three independent experiments (control diet, n = 4 and 7 for SI and LI; ID diet, n = 8 for SI and LI). n,o, Expression of Il22 (n) and Ahrr (o) mRNA determined by RT–qPCR in ILC3s from the indicated mice. Data are compiled from three independent experiments (n = 3 mice per group). See also Extended Data Fig. 1.
Fig. 2 |
Fig. 2 |. Iron chelation represses ILC3 functions ex vivo and in vitro.
ag, SI LPLs from WT mice were treated ex vivo with or without DFO for 16 h. FACS analysis of CD71 and RORγt expression in ILC3s (ad). Representative FACS plots of three independent experiments (a,c) and gMFI of CD71 (b) and RORγt (d) expression in ILC3s (n = 6 mice per group compiled from three independent experiments) are shown. eg, FACS analysis of IL-22 and IL-17A expression in ILC3s. Representative FACS plot of three independent experiments (e) and percentages of IL-22+ (f) and IL-17A+ (g) cells in ILC3s (n = 6 mice per group compiled from three independent experiments) are shown. hn, MNK-3 cells were treated with or without DFO for 16 h in vitro (n = 8 biologically independent replicates per group compiled from three independent experiments). FACS analysis of CD71 and RORγt expression in MNK-3 cells (hk). Representative FACS plot of three independent experiments (h,j) and gMFI of the CD71 (i) and RORγt (k) expression in MNK-3 cells are shown. ln, FACS analysis of IL-22 and IL-17A expression in MNK-3 cells. Representative FACS plot of three independent experiments (l) and percentages of IL-22+ (m) and IL-17A+ cells (n) in MNK-3 cells compiled from three independent experiments are shown. See also Extended Data Fig. 2.
Fig. 3 |
Fig. 3 |. Iron depletion impairs mitochondrial function and switches OXPHOS to glycolysis in MNK-3 cells.
af, RNA-seq analysis of MNK-3 cells treated with or without DFO (100 μM) for 16 h in vitro (n = 3 biologically independent replicates per group). Scatter-plot of log2 (FPKM) gene expression of the RNA-seq analysis. DEGs (fold change ≥ 1.5, q value ≤ 0.05) are highlighted in red (upregulated) and blue (downregulated), respectively (a). GO analysis showing the top ten up- and downregulated pathways of the DEGs identified by RNA-seq in MNK-3 cells (b). GSEA showing enrichment of genes of OXPHOS pathway in MNK-3 cells without DFO treatment (c). Heat maps of the indicated mitochondria-encoding gene expression (d) and ILC3 signature gene expression (e) in RNA-seq analysis of MNK-3 cells. GSEA showing enrichment of ILC3 signature genes in MNK-3 cells without DFO treatment (f). g, FACS analysis of 2-NBDG uptake in MNK-3 cells (n = 6 biologically independent replicates per group compiled from three independent experiments). hj, Seahorse metabolic flux analysis. Real-time OCR (h) are representative of two independent experiments and compiled data on quantification of basal (i) and maximal (j) OCR of one experiment are shown (n = 3 biologically independent replicates per group). k,l, FACS analysis of mTORC1-associated marker S6 phosphorylation (pS6) in MNK-3 cells. Representative FACS plot of three independent experiments (k) and gMFI of pS6 in MNK-3 cells compiled from three independent experiments (n = 7 biologically independent replicates per group) (l) are shown. See also Extended Data Fig. 3.
Fig. 4 |
Fig. 4 |. CD71 deficiency impairs ILC3 maintenance in a cell-intrinsic manner.
a,b, FACS analysis of RORγt expression in Lin LPLs isolated from various organs (SI, LI, pLNs and mLNs) of Tfrcf/f and Tfrcf/f Rorc-cre littermate mice. Representative FACS plot of three independent experiments (a) and percentages of ILC3s in Lin LPLs compiled from three independent experiments (Tfrcf/f, n = 6 mice; Tfrcf/f Rorc-cre, n = 7 mice) are shown (b). cf, Percentages and absolute numbers of SI (c,d) and LI (e,f) ILC3s in Lin LPLs at different ages of mice of indicated genotypes. Data are compiled from four independent experiments (Tfrcf/f, n = 7 per age group; Tfrcf/f Rorc-cre, n = 6 (1-week-old and 4-week-old) or 5 (6-week-old) mice)). gl, Absolute numbers of NKp46+ ILC3s (g), CD4+ ILC3s (h), CD4 ILC3s (i), CCR6+ ILC3s (j), IL-22+ ILC3s (k) and IL-17A+ ILC3s (l) in SI and LI LPLs of Tfrcf/f and Tfrcf/f Rorc-cre littermate mice. Data are compiled from three independent experiments (Tfrcf/f, n = 9 mice; Tfrcf/f Rorc-cre, n = 7 mice). m,n, FACS analysis of Ki-67 expression in ILC3s. Representative FACS plot of three independent experiments (m) and percentages of Ki-67+ cells in ILC3s compiled from three independent experiments (Tfrcf/f, n = 8 mice; Tfrcf/f Rorc-cre, n = 9 mice) are shown (n). o,p, FACS analysis of 5-bromo-2ʹ-deoxyuridine (BrdU) expression in ILC3s. Representative FACS plot of two independent experiments (o) and percentages of BrdU+ cells in ILC3s compiled from two independent experiments (n = 6 mice per group) are shown (p). See also Extended Data Fig. 4.
Fig. 5 |
Fig. 5 |. CD71 ablation in ILC3s impairs gut immunity to C. rodentium.
ac, C. rodentium infection in mice. Colon length (a) and absolute numbers of IL-22+ cells (c) were compiled from two independent experiments (Tfrcf/f, n = 8 and 6 for day 4 and day 9 d.p.i.; Tfrcf/f Rorc-cre, n = 4). Bacterial counts in the feces (b) were compiled from three independent experiments (Tfrcf/f, n = 8; Tfrcf/f Rorc-cre, n = 5). d, Percentages of ILC3s in Lin LPLs of the indicated mice with or without iron dextran treatment compiled from three independent experiments (Tfrcf/f, n = 5 and 6 for untreated and treated; Tfrcf/f Rorc-cre, n = 6 and 7 for untreated and treated). eg, C. rodentium infection in the indicated mice with or without iron dextran pre-treatment of two independent experiments (Tfrcf/f, n = 7 per treatment group; Tfrcf/f Rorc-cre, n = 5 per treatment group). Body weight (e), survival (f), fecal bacterial counts of the indicated mice (g). Survival was assessed with the log-rank test. hm, RNA-seq analysis of SI ILC3s from the indicated mice, with or without iron dextran treatment (n = 3 mice per group). Venn diagrams of DEGs (h) and principal-component analysis (PCA) plot (i). GSEA showing ILC3 signature gene enrichment (j). GO analysis showing the top pathways of 1,604 DEGs (k) and 479 DEGs (m). l, gMFI of pS6 in ILC3s from three independent experiments (SI, n = 5; LI, n = 7). n,o, Percentages of ILC3s in Lin LPLs of SI (n) and LI (o) from the indicated mice of three independent experiments (Zip14f/f, n = 11; Zip14f/f Rorc-cre, n = 4; Tfrcf/f Rorc-cre, n = 7; Tfrcf/f Zip14f/f Rorc-cre, n = 4). p,q, Percentages of ILC3s in Lin LPLs of SI (p) and LI (q) from the indicated mice of three independent experiments (Tfrcf/f, n = 4 and 7 for untreated and treated; Tfrcf/f Rorc-cre, n = 3 and 6 for untreated and treated; Tfrcf/f Zip14f/f Rorc-cre, n = 3 and 5 for untreated and treated). See also Extended Data Figs. 5 and 6.
Fig. 6 |
Fig. 6 |. Ahr cell-intrinsically inhibits CD71 transcription in ILC3s.
ad, FACS analysis of CD71 expression in ILC3s, ILC1s and ILC2s of the indicated mice. Representative FACS plot (a) and percentages of CD71+ cells in ILC3s (b), ILC2s (c) and ILC1s (d) from three independent experiments (Ahr+/+, n = 5 and 8 for SI and LI; Ahr−/−, n = 4 and 6 for SI and LI). e,f, FACS analysis of CD71 expression in ILC3s of the indicated mice. Representative FACS plot (e) and percentages of CD71+ cells in ILC3s compiled from three independent experiments (Ahr+/+, n = 6; AhrdCAIR/+, n = 7; AhrdCAIR/dCAIR, n = 8) (f). g,h, FACS analysis of CD71 expression in ILC3s of the indicated mice. Representative FACS plot (g) and percentages of CD71+ cells in ILC3s compiled from four independent experiments (Ahrf/f, n = 7 and 9 for SI and LI; Ahrf/f Rorc-cre, n = 7 and 8 for SI and LI) (h). i,j, FACS analysis of CD71 expression in ILC3s of the indicated mice. Representative FACS plot (i) and percentages of CD71+ cells in ILC3s compiled from three independent experiments (AhrCAIR/+, n = 8; AhrCAIR/+ Rorc-cre, n = 7) (j). ko, FACS analysis of RORγt expression in Lin LPLs and IL-22+ and IL-17A+ ILC3s of the indicated mice from three independent experiments (Ahr+/+, n = 7 and 8 for untreated and treated; Ahr−/−, n = 5 and 6 for untreated and treated). Representative FACS plot (k), percentages of SI ILC3s in Lin LPLs (l) and absolute numbers of SI ILC3s (m). n,o, Absolute numbers of SI IL-22+ (n) and IL-17A+ ILC3s (o). p,q, Percentages of SI ILC3s in Lin LPLs (p) and percentages of Ki-67+ cells in SI ILC3s of the indicated mice compiled from three independent experiments (q) (Ahrf/f, n = 6 and 5 for untreated and iron-treated; Ahrf/f Rorc-cre, n = 6). r, GO analysis showing the top ten pathways of the 2,113 DEGs identified in RNA-seq (cKO + iron versus cKO) (cKO, Ahrf/f Rorc-cre). See also Extended Data Figs. 7–9.
Fig. 7 |
Fig. 7 |. Ahr regulates CD71 transcription by directly binding to the Tfrc locus.
ad, RNA-seq analysis of FACS-sorted ILC3s from SI and LI LPLs of Rag1−/−Ahr+/+ (WT) and Rag1−/−Ahr−/− (KO) littermate mice (n = 2 mice per group). Scatter-plot of log2 (FPKM) gene expression in SI (a) and LI (b) ILC3s of RNA-seq analysis. DEGs (KO versus WT, fold change ≥ 1.5, q value ≤ 0.05) are highlighted in red (upregulated) and blue (downregulated), respectively. Venn diagrams of DEGs identified by RNA-seq indicate the shared DEGs regulated by Ahr between SI and LI ILC3s (c). GO analysis showing the top pathways of the shared DEGs between SI and LI (cKO versus WT) (d). e, ChIP-seq (this study), recruitment of Ahr to the Tfrc locus in FACS-sorted gut ILC3s (SI + LI) as measured by ChIP-seq. RNA-seq (this study), representative RNA-seq tracks at the Tfrc locus in FACS-sorted ILC3s from SI and LI LPLs of Rag1−/−Ahr+/+ and Rag1−/−Ahr−/− littermate mice. ATAC-seq: Representative ATAC-seq tracks at the Tfrc locus in FACS-sorted ILC3s from SI and LI LPLs of Rag1−/−Ahr+/+ and Rag1−/−Ahr−/− littermate mice. f, ChIP assay of ILC3s FACS-sorted from gut LPLs of Rag1−/−Ahr+/+ mice. Enrichment of Ahr at the promoter region of Tfrc locus was determined by real-time qPCR and data are representative of two independent experiments (n = 3 reactions per group compiled from one experiment). Cyp1a1 and Il12b loci were used as positive and negative controls, respectively. g,h, FACS analysis of CD71 expression in MNK-3 cells transduced with retroviral constructs encoding MIG-Ahr or control (MIG-EV). The cells were treated with FICZ on day 2 following transduction. Representative FACS plot of two independent experiments (g) and percentages of CD71+ cells in GFP+ MNK-3 cells. Data are representative of two independent experiments (n = 3 biologically independent replicates per group compiled from one experiment) are shown (h). See also Extended Data Fig. 10.

References

    1. Lieu PT, Heiskala M, Peterson PA & Yang Y The roles of iron in health and disease. Mol. Asp. Med 22, 1–87 (2001). - PubMed
    1. Hentze MW, Muckenthaler MU, Galy B & Camaschella C Two to tango: regulation of mammalian iron metabolism. Cell 142, 24–38 (2010). - PubMed
    1. Donovan A et al. Positional cloning of zebrafish ferroportin1 identifies a conserved vertebrate iron exporter. Nature 403, 776–781 (2000). - PubMed
    1. Abboud S & Haile DJ A novel mammalian iron-regulated protein involved in intracellular iron metabolism. J. Biol. Chem 275, 19906–19912 (2000). - PubMed
    1. McKie AT et al. A novel duodenal iron-regulated transporter, ireg1, implicated in the basolateral transfer of iron to the circulation. Mol. Cell 5, 299–309 (2000). - PubMed

Publication types