. 2023 Oct;29(10):2633-2642.
doi: 10.1038/s41591-023-02552-9. Epub 2023 Sep 14.

Optimized glycemic control of type 2 diabetes with reinforcement learning: a proof-of-concept trial

Affiliations

Optimized glycemic control of type 2 diabetes with reinforcement learning: a proof-of-concept trial

Guangyu Wang et al. Nat Med. 2023 Oct.

Abstract

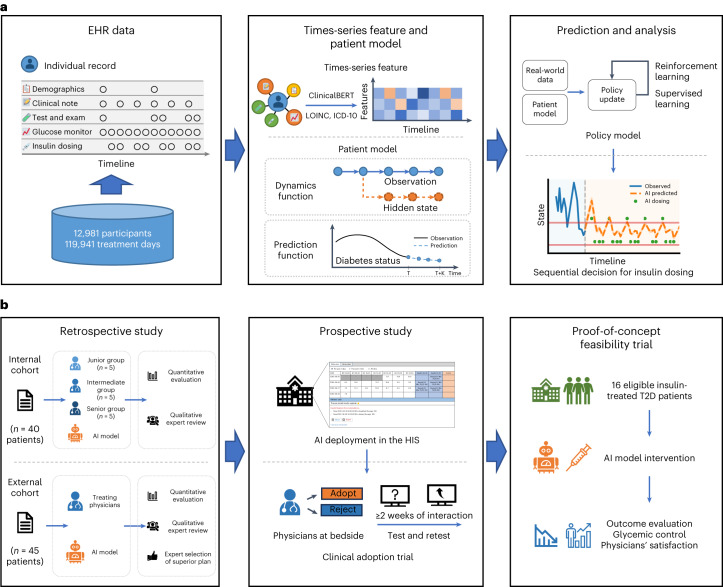
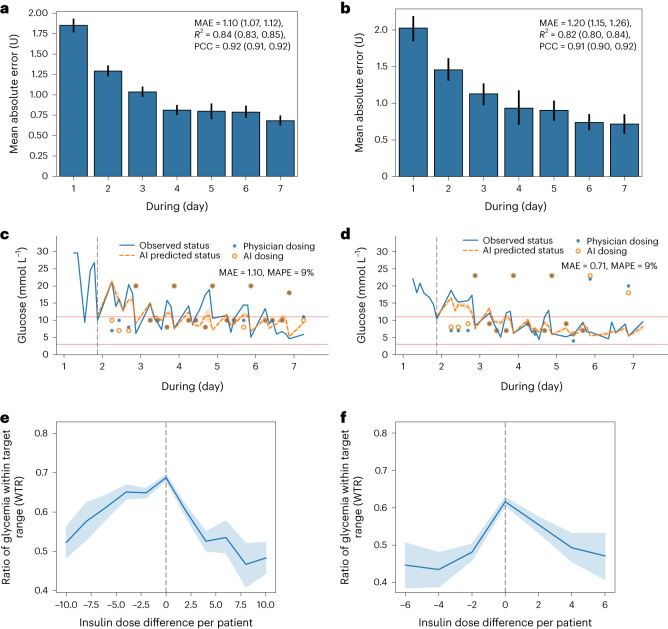
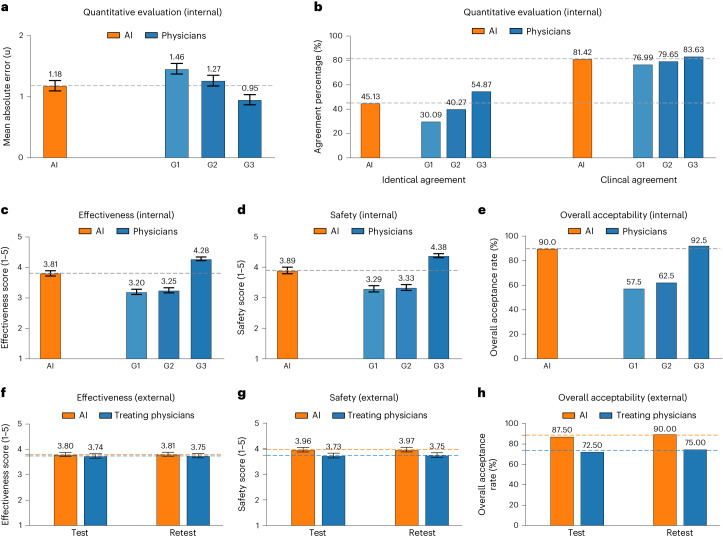
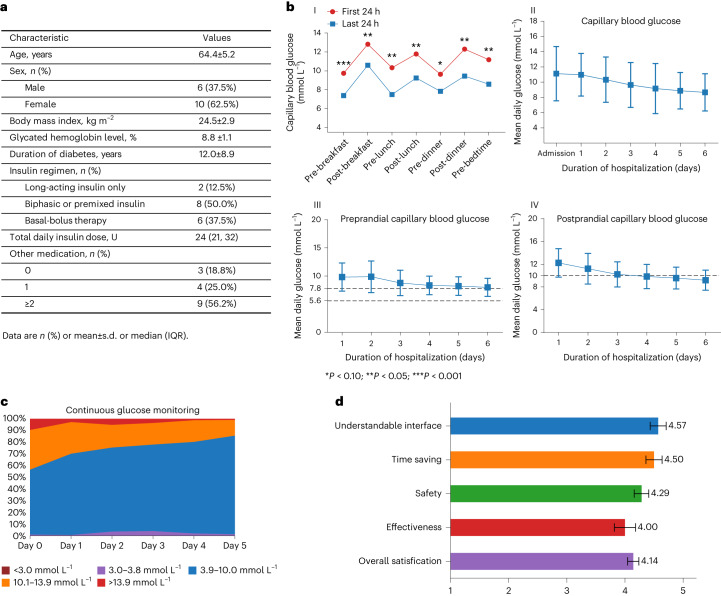
The personalized titration and optimization of insulin regimens for treatment of type 2 diabetes (T2D) are resource-demanding healthcare tasks. Here we propose a model-based reinforcement learning (RL) framework (called RL-DITR), which learns the optimal insulin regimen by analyzing glycemic state rewards through patient model interactions. When evaluated during the development phase for managing hospitalized patients with T2D, RL-DITR achieved superior insulin titration optimization (mean absolute error (MAE) of 1.10 ± 0.03 U) compared to other deep learning models and standard clinical methods. We performed a stepwise clinical validation of the artificial intelligence system from simulation to deployment, demonstrating better performance in glycemic control in inpatients compared to junior and intermediate-level physicians through quantitative (MAE of 1.18 ± 0.09 U) and qualitative metrics from a blinded review. Additionally, we conducted a single-arm, patient-blinded, proof-of-concept feasibility trial in 16 patients with T2D. The primary outcome was difference in mean daily capillary blood glucose during the trial, which decreased from 11.1 (±3.6) to 8.6 (±2.4) mmol L-1 (P < 0.01), meeting the pre-specified endpoint. No episodes of severe hypoglycemia or hyperglycemia with ketosis occurred. These preliminary results warrant further investigation in larger, more diverse clinical studies. ClinicalTrials.gov registration: NCT05409391 .


Conflict of interest statement

The authors declare no competing interests.

Figures

Fig. 1
Fig. 1. Schematic illustration of the AI system from development to deployment for dynamic insulin dosage titration for patients with T2D.
a, Model development of the AI system—a model-based RL-DITR system consisting of ‘patient model’ and ‘policy model’. Left, we constructed a large multi-center EHR dataset consisting of records of long-term continuous clinical observation and medication of hospitalized patients with T2D. Middle, with the standardized time-series data as input, the patient model generated hidden state transition, status prediction and reward estimation. Right, the policy model is optimized by interacting with the patient model as an environment. b, Comprehensive evaluation of the AI system step-by-step for integration into the real-world clinical workflow. Left, we conducted multi-center retrospective studies, including quantitative and qualitative evaluations in the internal and external cohorts. Middle, a prospective study with test–retest was conducted in an academic hospital after AI deployment in the HIS. Right, a proof-of-concept feasibility trial was conducted to evaluate the glycemic control of and physician satisfaction with the AI system.
Fig. 2
Fig. 2. Performance of AI model system in the prediction of patient state trajectory.
a,b, Comparison of actual patient trajectories and model-based state roll-outs for patients from the internal test set (a) and the external test set (b). Each predicted value, based on an individual patient, is generated within K steps from the last timestep of the previous day (K = 7 for 1 d ahead of time). The blue curve is measured patient glucose values, and the orange curve is predicted glucose values. c,d, Correlation analysis of the predicted glucose value versus the actual glucose value generated using the AI glucose model in the internal test set (c) and the external test set (d). e,f, ROC curves showing performance of daily WTR prediction on the internal test set (e) (n = 20,961 treatment days) and the external test set (f) (n = 16,077 treatment days). Each predicted value is based on the last timestep of the previous day. Box plots show the median (center lines), interquartile range (hinges) and 1.5× interquartile range (whiskers) (bootstrapping with n = 1,000 resamples). Each value generated by our RL-DITR system represents an individual-level prediction. These were then aggregated to produce population-level results. The correlation analysis is shown with 95% CIs in c and d. AUROC, area under the receiver operating characteristic; ROC, receiver operating characteristic.
Fig. 3
Fig. 3. Performance of AI treatment model in the insulin dosage prediction.
a,b, Performance of daily treatment dosage prediction on the internal test set (a) (n = 42,037 insulin data points) and the external test set (b) (n = 32,484 insulin data points). Each predicted value was subsequently unrolled recurrently for K steps from the last timestep of the previous day (K = 7 for 1 d ahead of time). The error bars represent the 95% CIs. We aggregated the individual-level predictions to obtain population-level results. c,d, Comparison of actual treatment regimens and model-based treatment roll-outs of two individual patients from the internal test set (c) and the external test set (d). The blue curve is measured patient glucose values, and the orange curve is predicted glucose values given by the AI model. e,f, Association analysis of the patient outcome (for example, WTR) versus the dosage difference in treatment actions between the AI policy and the clinician policy for the internal test set (e) and the external test set (f). The dose excess, referring to the difference between the given and the AI model, suggested dose summed over per day for all patients. The shaded area represents the 95% CI. R2, coefficient of determination. MAPE, mean absolute percentage error.
Fig. 4
Fig. 4. Performance evaluation between the AI model and human physicians in retrospective studies.
ae, Comparison with quantitative metrics (a and b) and qualitative clinical evaluations (ce) on insulin titration regimens given by the AI model and human physician groups in the internal cohort (n = 40 patients with T2D). The AI model was compared with three physician groups with different levels of clinical experience: group 1, junior physicians (n = 5); group 2, intermediate physicians (n = 5); and group 3, senior physicians (n = 5). a,b, Quantitative evaluation of dosage titration by expert panel consensus as reference (n = 226 insulin data points). a, Predicted error (MAE) of AI model and human physicians; b, dosage adjustment agreement of the AI model and human physicians evaluated separately by identical agreement (same direction, same dosage) and clinical agreement (same direction, dose difference ≤20%). ce, Qualitative clinical performances were evaluated by the expert panel (n = 40 regimens) separately in effectiveness (c), safety (d) and overall acceptability (e). fh, Performance comparison of the AI-generated and previously delivered insulin regimens in the test–retest external cohort (n = 40 regimens). Evaluation was based on the expert panel review including effectiveness (f), safety (g) and overall acceptability (h). Orange dashed line represents the average performance of AI; blue dashed line represents the average performance of treating physicians. Bar graphs indicate the mean ± s.e.m. G, group.
Fig. 5
Fig. 5. Performance evaluation of the AI model in the prospective study.
ad, The performance of effectiveness (a), safety (b), overall acceptability (c) and adoption rate of AI-generated regimen (d) evaluated by endocrinologists at the bedside at test–retest review in the prospective study (n = 40 regimens). The score scale of effectiveness and safety is 1–5. The adoption rate refers to the percentage of the AI regimens adopted by endocrinologists at the bedside for patient treatment. Bar graphs depict the mean ± s.e.m.
Fig. 6
Fig. 6. A proof-of-concept feasibility trial to evaluate the AI system on glycemic control in patients with T2D.
a, The baseline clinical characteristics of patients with T2D included in the proof-of-concept feasibility trial (n = 16). b, The capillary blood glucose of a patient with T2D during the treatment period. (I) Illustration of the seven-point glucose profile during the first and last 24 h of the treatment period. Statistical significance was determined by two-sided paired t-test: pre-breakfast ***P < 0.001; post-breakfast, pre-lunch, post-lunch, post-dinner and pre-bedtime **P < 0.05; pre-dinner *P < 0.10. (II) Mean daily capillary blood glucose. (III) Mean preprandial capillary blood glucose. (IV) Mean postprandial capillary blood glucose during the treatment period. The preprandial blood glucose target was 5.6–7.8 mmol L−1; the postprandial capillary blood glucose target was <10.0 mmol L−1. (II–IV) Line, median; error bar, interquartile; n = 16 patients. c, Average percentage of continuous glucose monitoring data within glycemic ranges throughout the treatment period. The percentage of continuous glucose measurement <3.0 mmol L−1, 3.0–3.8 mmol L−1, 3.9–10.0 mmol L−1, 10.1–13.9 mmol L−1 and >13.9 mmol L−1 is presented. d, Post-intervention evaluation of the AI system during the treatment trial, assessed by physicians (n = 14) using questionnaires (see more in Extended Data Fig. 7c). The satisfaction agreement was scored from a scale of 1–5. Bar graphs indicate the mean ± s.e.m. IQR, interquartile range.
Extended Data Fig. 1
Extended Data Fig. 1. The development of the AI system.
a, The sequential decision process with patient model and policy model in AI system. Given a trajectory, for the initial step, the representation function fR receives as input the past observations O1:t from the trajectory. The model is subsequently unrolled recurrently for K steps. At each step κ∈[1,K], the policy model π receives the hidden state st+k1 and generates an action at+k1. The dynamics function fT of patient model subsequently receives as input the hidden state st+k1 from the previous step and the action at+k1 and produces the hidden state of the next step st+k, and the prediction function of patient model predicts diabetes status yt+k1. The hidden states and actions recurrently update. b, The AI system training pipeline. Left, the patient model learning for patient tracking. Given a hidden state st and an actual action at, the patient generates the predicted status yˆt to estimate the current status yt, and produces the next state st+1. The estimated reward rˆt compared to the actual reward rt was calculated from yˆt. The patient model is joint optimized by the objective of consistency loss of state transition LT and supervised loss of status prediction Lp. Right, the policy update for dynamic regimen with combined supervised learning and reinforcement learning. The policy model π receives the hidden state st and then generates an action aˆt. Subsequently, the patient model receives as input the hidden statest from the previous step and the action at, then produces the hidden state of the next step st+1 and returns a reward rˆt. The policy model π is joint optimized by the objective of combined reinforcement learning LRL1, LRL2 and supervised learning LSL.
Extended Data Fig. 2
Extended Data Fig. 2. The performance evaluation of the AI system for patient trajectory prediction using WTR for overall glucose variability.
a, Visualization of the patient hidden states. Projection of patients’ hidden state embeddings onto PC 1 and PC 2, derived from principal component analysis (PCA). Each node indicates a patient state. The state distribution showed association with diabetic outcome, colored by glucose level distribution. The samples are 1000 patients from internal test dataset. PC: principal component. b, Illustration of reward function. It is a measurement of overall glucose variability that focus on the relationship between glucose variability and risks for hypo- and hyperglycemia. c and d, Performance of the AI model on assessment of WTR shown as AUC curves. c, internal test set and d, external test set. ROC curves showing the pre-prandial time, the postprandial and overall performance. e-f, Correlation analysis of the ratio of glycemia within target range (WTR) vs the estimated cumulative reward of the clinicians’ treatment actions. e, internal test set, and f, external test set. The shaded area represents the 95% confidence interval.
Extended Data Fig. 3
Extended Data Fig. 3. Performance of the AI for daily treatment dosage prediction and off-policy evaluation.
a-f, Each column represents the performance of AI grouped by insulin types, including (a and b) short/rapid acting, (c and d) biphasic or premixed, and (e and f) long acting. Each predicted data is based on is generated within K steps based on the last time step of previous day (K = 7 for one day ahead of time). The bars represent the mean with 95% confidence intervals of MAE on the internal test set (n = 20,961 treatment days) and the external test set (n = 16,077 treatment days). MAE, mean absolute error; R2, coefficient of determination; PCC, Pearson’s correlation coefficient. a, c and e: the internal test set; b, d and f: external test set. g, Off-policy evaluation of RL-based model versus other SL-based and clinician methods in the internal test set in the AI development phase, measured by weighted importance sampling (WIS) score with standard deviation. ne indicates the effective sample size with the WIS score.
Extended Data Fig. 4
Extended Data Fig. 4. Performance evaluation of the AI system in the retrospective phase study of internal and external cohorts.
a, Study design of internal cohort: 40 eligible T2D patients were included in the study. 80 treatment cases from 40 patients (2 per person) were randomly selected to compare the performance of quantitative metrics between the AI system and human physicians. 1 case for 40 patients was further selected for qualitative clinical evaluations (effectiveness, safety, and overall acceptability). b, Study design of external cohort: 45 T2D patients were collected, and a total of 796 insulin points were included in the external validation analysis. An assessment with quantitative metrics was conducted to compare the performance between treating physicians and AI by expert panel. 40 cases randomly selected from the total 338 cases were used for further qualitative evaluation (effectiveness, safety, and overall acceptability). After 2 weeks, a retest review was conducted. c, Demographics and baseline measurements of the patients in the internal (n = 40) and external (n = 45) cohorts. BMI, body mass index; A1c, glycated hemoglobin. Numerical variables were reported as mean±SD. d. Quantitative comparisons of insulin dosage given by human physicians and AI stratified by insulin catalogs in the external cohort. e, Superior plan (AI versus human physicians) was selected by the expert panel (n = 3) with test-retest review in the external cohort (n = 40 regimens). Orange dashed line, average performance of AI; blue dashed line, average performance of treating physicians. Bar graphs indicate the mean±SEM.
Extended Data Fig. 5
Extended Data Fig. 5. Performance evaluation of AI system in the prospective deployment study.
a, The user interface of AI deployment. b, Demographics and baseline measurements of patients in the deployment phase study (n = 20). BMI, body mass index; A1c, glycated hemoglobin. Numerical variables were reported as mean±SD.
Extended Data Fig. 6
Flow diagram of the proof-of-concept feasibility trial.
Extended Data Fig. 7
Extended Data Fig. 7. Performance evaluation of the AI system in the proof-of-concept feasibility trial.
a, Patient example during the proof-of-concept feasibility trial using the seven-point capillary blood glucose measurement. b, Glucose control based on the sensor glucose measurements at the first 24 hours and the last 24 hours of the trial. GMI, glucose management indicator; CV, coefficient of variation. c, Post-intervention evaluation by physicians who used the AI during the feasibility trial. The post-intervention evaluation questionnaire included 13 items questions: 8 items for pertaining to the physician’s experience with the AI use and recommendation and 5 items for assessing the physician’s view regarding integration of the AI into daily routine practice.

References

    1. Sun H, et al. IDF Diabetes Atlas: global, regional and country-level diabetes prevalence estimates for 2021 and projections for 2045. Diabetes Res. Clin. Pract. 2022;183:109119. doi: 10.1016/j.diabres.2021.109119. - DOI - PMC - PubMed
    1. Stratton IM, et al. Association of glycaemia with macrovascular and microvascular complications of type 2 diabetes (UKPDS 35): prospective observational study. BMJ. 2000;321:405–412. doi: 10.1136/bmj.321.7258.405. - DOI - PMC - PubMed
    1. Holman RR, Paul SK, Bethel MA, Matthews DR, Neil HA. 10-year follow-up of intensive glucose control in type 2 diabetes. N. Engl. J. Med. 2008;359:1577–1589. doi: 10.1056/NEJMoa0806470. - DOI - PubMed
    1. ElSayed NA, et al. 9. Pharmacologic approaches to glycemic treatment: standards of care in diabetes—2023. Diabetes Care. 2023;46:S140–S157. doi: 10.2337/dc23-S009. - DOI - PMC - PubMed
    1. American Diabetes Association. 6. Glycemic targets: standards of medical care in diabetes—2021. Diabetes Care. 2021;44:S73–S84. doi: 10.2337/dc21-S006. - DOI - PubMed

Publication types

Associated data