. 2023 Nov;20(11):1790-1801.
doi: 10.1038/s41592-023-02004-9. Epub 2023 Sep 14.

Crystal ribcage: a platform for probing real-time lung function at cellular resolution

Affiliations

Crystal ribcage: a platform for probing real-time lung function at cellular resolution

Rohin Banerji et al. Nat Methods. 2023 Nov.

Abstract

Understanding the dynamic pathogenesis and treatment response in pulmonary diseases requires probing the lung at cellular resolution in real time. Despite advances in intravital imaging, optical imaging of the lung during active respiration and circulation has remained challenging. Here, we introduce the crystal ribcage: a transparent ribcage that allows multiscale optical imaging of the functioning lung from whole-organ to single-cell level. It enables the modulation of lung biophysics and immunity through intravascular, intrapulmonary, intraparenchymal and optogenetic interventions, and it preserves the three-dimensional architecture, air-liquid interface, cellular diversity and respiratory-circulatory functions of the lung. Utilizing these capabilities on murine models of pulmonary pathologies we probed remodeling of respiratory-circulatory functions at the single-alveolus and capillary levels during disease progression. The crystal ribcage and its broad applications presented here will facilitate further studies of nearly any pulmonary disease as well as lead to the identification of new targets for treatment strategies.


Conflict of interest statement

Competing interests: H.T.N has received research funding from Johnson & Johnson Lung Cancer Initiative at Boston University. The funding has supported the development of the lung cancer models described in the manuscript. All other authors report no competing interests.

Figures

Extended Data Figure 1 |
Extended Data Figure 1 |. Mouse strain specific μCT informed 3D molds scaled by age and fabrication of crystal ribcages.
(a) Recreating mouse ribcage geometry from μCT data, here shown for C57/B6 mice. Top: Sagittal view of mouse chest with fully inflated lung (dark region), distribution of axial control points to recapitulate ribcage cross-section and comparison of reconstructed geometry overlaid on sagittal and coronal μCT slices. Lung volume variation with age was normalized against the mean volume at 3 months to construct a linear fit for scaling 3D lung inserts by age. (b-e) 3D printed models were used to make both PDMS and polystyrene crystal ribcages in two independent processes.
Extended Data Figure 2 |
Extended Data Figure 2 |. Native mouse ribcage does not show significant variation in diameter across its anatomy and alveolar function (diameter in μm) remains unchanged between crystal ribcage and mouse ribcage.
Previous μCT data used to define the mouse chest cavity was also used to (a) quantify the expansion of the native mouse ribcage as a function of pressure and anatomical location during in situ ventilation. There was no significant difference between the ribcage diameter at tracheal pressures ranging from 10 to 40 cmH2O in both the frontal and sagittal planes from the apex to the base of the ribcage. The increase in volume with increasing pressure was accommodated by the increasing length of the lung (movement of diaphragm and abdomen) and not the width of the ribcage. This confirms that there was little contribution of the changing ribcage diameter to lung volume change during normal physiological conditions in situ. The scatter of the data over n=3 mice is presented along with the mean ± SEM traces. (b) A mouse ribcage was thinned down to make a window above the pleural sheath to image the functional lung using OCT, the same lung was then measured in the crystal ribcage for the same changes in pressure. There was no significant difference between alveoli function (measured as changing diameter) across the pressure range for m=5 ROI over n=1 mouse. The scatter of the data is presented along with the mean ± SEM traces. Comparison between groups performed with two-tailed Student’s t-test for significance < 0.05.
Extended Data Figure 3 |
Extended Data Figure 3 |. Experimental setup and 3D renders of the microscopy arms used to image different orientations of the crystal ribcage with upright and inverted microscope configurations.
We successfully used the stage to image (a) with an inverted Olympus Fluoview 3000 laser scanning confocal microscope and (b) with upright microscopes, such as the ThorLabs optical coherence tomography probe and Bruker multi-photon microscope. The crystal ribcage is microscope agnostic and compatible with both air and water-immersion objective in both configurations.
Extended Data Figure 4 |
Extended Data Figure 4 |. Dynamic ventilation of mouse lung shows alveoli remain at a larger diameter for longer duration at higher ventilation rate.
Comparing the same region of the lungs ventilated at (a) 60 breaths/minute with (b) 120 breaths/minute by (c) the mean ± SEM alveolar diameter from m=4 ROI over n=2 mice with a normalized ventilation cycle. Blue traces in the inset images show the segmentation boundary drawn to quantify single alveoli. (d) The width of the normalized ventilation cycle from m=4 ROI over n=2 mice at each respiratory rate are statistically larger at the higher respiratory rate. Boxplots present median with 25th and 75th percentiles, whiskers are the maximum and minimum data points not considered outliers. Comparison between groups performed with two-tailed Student’s t-test for significance < 0.05.
Extended Data Figure 5 |
Extended Data Figure 5 |. Resident alveolar type II cells, with GFP-labelled surfactant protein C (green) can be imaged inside the crystal ribcage.
(a) Stereomicroscope fitted with a NightSea GFP filter to visualize the SPC-GFP distribution at the whole organ scale. (b) Confocal microscopy of the SPC-GFP population at the lobe scale on the right side of the lung at 1.25x magnification. Vessels are labeled by injection of 50 μL of 10 mg/ml Evans blue dye in saline in vivo prior to extraction of the lungs. (c) Confocal microscopy at the 10x magnification shows single SPC- GFP+ cells in the lung distal parenchyma. (d) Single cell nuclei and SPC-GFP signal in cell cytoplasm visible at single cell resolution using a 60x water immersion lens.
Extended Data Figure 6 |
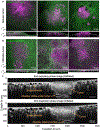
Extended Data Figure 6 |. Orthogonal views comparing the spatial distribution of nodular and infiltrative tumors, for three separate instances of each phenotype and solid phase nodular growth tumor increases imaging depth in sagittal image section using optical coherence tomography.
(a) Nodular tumors extended into the lung tissue to greater depths and bulge out of the pleural surface. (b) Infiltrative tumors are located more superficially on the pleural surface. (c) Alveolar function deeper than 100μm from the surface can be imaged through the tumor nodule up to a depth of 400μm from the surface, as the gas phase of the alveoli is replaced by the solid phase tumor, which reduces light scattering.
Extended Data Figure 7 |
Extended Data Figure 7 |. Single cell deformation in response to changing alveolar pressure.
(a) Cell-scale confocal microscopy of the lung inside the crystal ribcage with a FITC-albumin vascular lumen label showed the shadow of the cancer cell (b) which was imaged in a separate channel and merged to show cancer cells stretched in capillaries compared to arterioles and venules. (c) XY-views of the cancer cell at different depths of confocal imaging to show the cell is completely enclosed in the capillary. (d, e) Cells in capillaries quantified by the Feret ratio trended towards greater deformation in comparison to cells in larger arterioles-venules. Feret ratio quantified for n=40 cells in capillaries, n=30 cells in arteriole-venule at each alveolar pressure and data presented as mean ± S.E.M.
Extended Data Figure 8 |
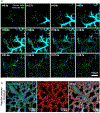
Extended Data Figure 8 |. Metastatic cancer cells disrupt vascular dye distribution in capillaries and the crystal ribcage used to visualize individual lung capillary walls and perfused lumens at high magnification (60x).
(a) Capillary scale confocal microscopy imaging of single cancer cells that disrupt the distribution of dye observed over a time lapse imaging. (b) Vascular lumens were labeled with 10 mg/ml FITC-albumin dissolved in saline, injected intravenous prior to excision of the lungs for high-resolution confocal microscopy with a 60x objective.
Extended Data Figure 9 |
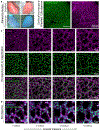
Extended Data Figure 9 |. MRP8+ Neutrophil cells co-localized with edema in lungs after at 30 hours lobar pneumonia injury.
Correlation of the edema label with neutrophil cells is imaged (a) using 1.25x, (b) 10x and (c) 60x objectives to confirm that all alveoli with neutrophils (green) are edematous (magenta). (d) The contralateral lobe was also imaged to show the absence of edema and neutrophils inside alveoli.
Extended Data Figure 10 |
Extended Data Figure 10 |. Lung adjacent organs such as the heart can also be imaged with the crystal ribcage.
Here using a laser scanning confocal (a) the heart is imaged with a 1.25x objective to show (b) the overlapping lobes of the lung followed by (c) higher resolution images of the atrial surface and (d) muscle structures.
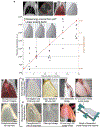
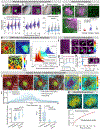
FIGURE 1 |
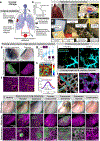
FIGURE 1 |. Development, capabilities, and application of the crystal ribcage in pulmonary research.
(a) Schematic representation of imaging, controllability, and intervention capabilities of the crystal ribcage. (b) The crystal ribcage benefits from the imaging capabilities and controllability of organ-on-chip models while preserving the complexities and cellular diversity of in vivo lungs. (c) Age- and strain-specific μCT scans used to model the mouse chest cavity to fabricate the crystal ribcage through a multistep additive and sacrificial fabrication process. (d) The portable platform to maintain, monitor, and record the lung physiological condition during real-time imaging. (e) Imaging the distal lung surface with preserved 3-D geometry, demonstrated by both stereo- and confocal-microscopy imaging of the right and left lobes of a mouse lung with a left-lobar bacterial pneumonia infection (labeled by leakage of intravascular Evans blue into the lung airspace) showing neutrophil infiltration 24 hours after initial infection. (f) Imaging desired regions of the lung and tracking alveoli (contoured alveolus for reference) across the respiratory cycle under quasi-static conditions. (g) Alveolar function assessed by measuring alveolar diameter as a function of quasi-static alveolar air pressure. The distribution of diameters are connected by the means from m=4 ROI over n=4 mice. (h) Representative map of the strain experienced by the alveolar septum during quasi-static ventilation, with sub-alveolus resolution for m=1 ROI. (i) Alveolar diameter measured at distinct points of the ventilation cycles at 120 and 60 breaths/min presented as mean ± SEM of data from m=4 ROI over n=2 mice (j) Remodeling of single capillary function in lung cancer assessed by real-time confocal microscopy of the spatiotemporal distribution of a Cascade Blue-dextran (10 kDa) flow under quasi-static inflation. (k) Cellular activity and alveolar-capillary structure-function imaged during quasi-static inflation, inset yellow box shows a single capillary with shadow of cells inside it. (l) The crystal ribcage capabilities demonstrated on models of breast cancer lung metastasis, primary lung cancer, respiratory infection, pulmonary fibrosis, and emphysema from whole organ down to alveolus, capillary, and cell length and functional scales, imaged with confocal and multi-photon microscopy.
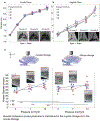
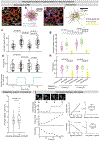
FIGURE 2 |
FIGURE 2 |. Multi-scale structure-function changes in lung cancer models.
Tumors (yellow arrow) at whole-organ and alveolar scale, distribution of alveolar diameters measured intratumorally, peritumorally, and far from tumor at each quasi-static pressure, line connects mean of distribution (a) representative nodular metastasis (green) and alveoli (magenta), for m=4 ROI over n=3 mice, (b) representative infiltrative metastasis (green) and nearly fully functional alveoli (magenta), for m=4 ROI over n=3 mice, and (c) representative primary lung cancer nodules with adjacent emphysematous alveoli, for m=3 ROI over n=3 mice. (d) Second harmonic generation imaging of collagen architecture in nodular (m=7 ROI over n=3 mice) and infiltrative (m=7 ROI over n=2 mice) metastatic cancers, and healthy (m=4 ROI over n=1 mouse), mean line of the scatter data from k=150, 188, 92 fibers respectively. (e) Representative alveolar strain as lung pressure increases from 7 to 12 cmH2O in each disease and mean ± SEM strain distribution per model for same ROI and mouse count in a, b, c. (f) Representative strain map of arrested cancer cells during quasi-static inflation in capillaries vs arterioles/venules. (g). Bulk comparison of circularity of cancer cells tracked at different pressures taken from n=30 cells in arterioles/venules and n=40 cells in capillaries, mean ± SEM of data is presented, and significance is tested between cells in each group at each pressure. (h) Alveolar function decreases with increasing cells in cancer nodule. Individual data points represent nodules and lines are mean alveolar expansion ratio for nodules =< 1 cell and >2 cells from m=60 nodules over n=16 mice. (i) Real-time imaging of the disrupted capillary function through pressure-controlled perfusion of fluorescent Cascade Blue-dextran (10kDa), and (j) distribution and retention of the same for m=4 ROI over n=5 healthy mice and m=8 ROI over n=4 tumor bearing mice. (k) Passive diffusion of a small molecule tracer into the tumor bulk and the mathematically estimated diffusion coefficient (see Methods) of the tracer in the tumor. Boxplots present median with 25th and 75th percentiles, whiskers are the maximum and minimum data points not considered outliers. Comparison between groups performed with two-tailed Student’s t-test for significance<0.05.
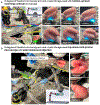
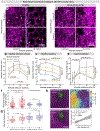
FIGURE 3 |
FIGURE 3 |. Impairment of alveolar respiratory and circulatory functions in pneumonia.
(a) Entire left lobe imaged via confocal microscopy at 7 and 18 cmH2O quasi-static alveolar pressures. (b). Representative images of alveolar deformation in a pneumonia-infected versus healthy lung in response to alveolar pressure changes. Single alveolus contoured shows dysfunctional alveoli (marked by neutrophil infiltration) are unresponsive to applied increases in air pressure compared to functional alveoli. (c) Distributed alveolar diameter data at each quasi-static pressure connected by the mean line for each infected and healthy groups for m=6 ROI over n=4 mice. (d) Representative strain map at alveolar scale strain showing reduced strain in neutrophil recruited areas. (e) Mean ± SEM of strain distribution in pneumonia infected and healthy regions, same mouse counts as c. (f) Capillary function in pneumonia infected and healthy lung perfused with CBhydrazide (550 Da) in RPMI medium at 15 cmH2O pressure-controlled flow and an alveolar pressure of 7 cmH2O. (g) Time course of fluorescence intensity in infected, infection-adjacent, and healthy capillaries. (h) Time duration when fluorescence intensity in the capillary bed was greater than 50% of the maximum intensity, indicating the tendency for dye to be retained in the capillary bed for m=4 ROI over n=5 healthy mice and m=9 ROI over n=4 pneumonia-infected mice. (i) Maximum fluorescence intensity in healthy and infection-adjacent capillaries after delivery of the bolus, for same mouse count as h. Boxplots present median with 25th and 75th percentiles, whiskers are the maximum and minimum data points not considered outliers. Comparison between groups performed with two-tailed Student’s t-test for significance < 0.05.
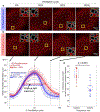
FIGURE 4 |
FIGURE 4 |. Neutrophil migration is reversibly mechano-responsive to vascular pressure.
(a) Representative image of neutrophil migration with cell trajectories (yellow) in the LPS model of acute lung injury. (b) Neutrophil migration map of paths travelled by single neutrophils over a 5-minute imaging interval. (c) Neutrophil average speed increases with vascular pressure and is reversible in LPS-damaged lungs (n=3 mice), for a constant alveolar pressure of 7 cmH2O. (d) Persistence directionality of neutrophil migration in LPS-damaged lungs (n=3 mice). (e) Representative traced neutrophil migration in intra-alveolar (yellow), interstitial (green), and intravascular (magenta) spaces in Sp3 pneumonia lungs at a pulmonary artery pressure (PA) of 15 cmH2O and a constant alveolar pressure of 7 cmH2O. (f) Neutrophil migration map for 15 cmH2O hydrostatic perfusion pressures and a constant alveolar pressure of 7 cmH2O in pneumonia lungs for 5 minutes. (g) Neutrophil average speed and (h) persistence in intra-alveolar, interstitial, and intravascular spaces under 0 or 15 cmH2O hydrostatic perfusion pressures in pneumonia lungs (n=3 mice), for a constant alveolar pressure of 7 cmH2O. (i) Neutrophil average speed in pneumonia lungs under quasi-static alveolar pressures of 3 (m=38 neutrophil across n=2 mice) versus 18 cmH2O (m=40 neutrophil across n=2 mice). (j) Representative changes in single neutrophil speed, aspect ratio, circularity of the same neutrophil with its respective aspect ratio vs. speed and circularity vs. speed linear regressions, and the regression coefficient of determination of aspect ratio vs. speed and circularity vs. speed of a population of neutrophils (m=27 cells over n=3 mice). Boxplots present median with 25th and 75th percentiles, whiskers are the maximum and minimum data points not considered outliers. Comparison between groups performed with two-tailed Student’s t-test for significance < 0.05.
FIGURE 5 |
FIGURE 5 |. Respiration-circulation coupling in healthy lungs and its disruption by acute injury.
(a) Representative image of structural changes in the lung associated with variable quasi-static alveolar and vascular pressures, with measurements of diameter changes in single lung capillaries (white arrows) and large arterioles (yellow arrows), which can be tracked in the crystal ribcage across normal respiration-circulation parameters. Respiration-circulation coupling trends can be observed by measuring the vascular diameter in response to changing pressures in (b) large, heathy arterioles and venules (m=15 ROI over n=3 mice) and (c) healthy capillaries (m=19 ROI over n=4 mice). (d) Representative images of the injured lung after challenge with LPS, showing that single capillaries (white arrows) affected by acute injury (LPS) become inflamed and distend differently for the same pressure range. (e) Capillaries acutely injured after LPS challenge become non-responsive to changes in alveolar and vascular pressure (m=16 ROI over n=4 mice). All traces are presented as mean ± SEM and the p-value determined by testing groups using two-tailed Student’s t-test for significance < 0.05. (f) Neutrophils migrate at faster speeds as vascular pressure measured at the pulmonary artery (PA) increases (m>130 neutrophils over n=2 mice) compared with little effect of increasing air pressure in the alveoli (m=40 neutrophils over n=2 mice). (g) Similarly vascular diameter changes are significantly different with increasing vascular pressure (n=2 mice), while changing alveolar pressure has little effect on it (n=2 mice). (h) Injecting Evans blue labeled agarose (green) produces a local blockage in the lung that disrupts alveolar-capillary function, as alveoli near the blockage do not deform across quasi-static air pressures and exclude perfused fluorescent tracer, while alveoli and capillaries farther away from the blockage remain functional (m=40 alveoli over n=1 mouse).

References

    1. Entenberg D et al. A permanent window for the murine lung enables high-resolution imaging of cancer metastasis. Nat Methods 15, 73–80 (2018). https://doi.org:10.1038/nmeth.4511 - DOI - PMC - PubMed
    1. Headley MB et al. Visualization of immediate immune responses to pioneer metastatic cells in the lung. Nature 531, 513–517 (2016). https://doi.org:10.1038/nature16985 - DOI - PMC - PubMed
    1. Looney MR et al. Stabilized imaging of immune surveillance in the mouse lung. Nat Methods 8, 91–96 (2011). https://doi.org:10.1038/nmeth.1543 - DOI - PMC - PubMed
    1. Ueki H, Wang IH, Zhao D, Gunzer M & Kawaoka Y Multicolor two-photon imaging of in vivo cellular pathophysiology upon influenza virus infection using the two-photon IMPRESS. Nat Protoc 15, 1041–1065 (2020). https://doi.org:10.1038/s41596-019-0275-y - DOI - PMC - PubMed
    1. Westphalen K et al. Sessile alveolar macrophages communicate with alveolar epithelium to modulate immunity. Nature 506, 503–506 (2014). https://doi.org:10.1038/nature12902 - DOI - PMC - PubMed

Method-only references

    1. Muzumdar MD, Tasic B, Miyamichi K, Li L & Luo L A global double-fluorescent Cre reporter mouse. Genesis 45, 593–605 (2007). https://doi.org:10.1002/dvg.20335 - DOI - PubMed
    1. Passegue E, Wagner EF & Weissman IL JunB deficiency leads to a myeloproliferative disorder arising from hematopoietic stem cells. Cell 119, 431–443 (2004). https://doi.org:10.1016/j.cell.2004.10.010 - DOI - PubMed
    1. Barker KA et al. Lung-resident memory B cells protect against bacterial pneumonia. J Clin Invest 131 (2021). https://doi.org:10.1172/JCI141810 - DOI - PMC - PubMed
    1. Kitzerow O, Zucker IH, Lisco SJ & Wang HJ Timeline of Multi-Organ Plasma Extravasation After Bleomycin-Induced Acute Lung Injury. Front Physiol 13, 777072 (2022). https://doi.org:10.3389/fphys.2022.777072 - DOI - PMC - PubMed
    1. Mammoto A et al. Control of lung vascular permeability and endotoxin-induced pulmonary oedema by changes in extracellular matrix mechanics. Nat Commun 4, 1759 (2013). https://doi.org:10.1038/ncomms2774 - DOI - PubMed