. 2023 Oct;20(10):1483-1492.
doi: 10.1038/s41592-023-01993-x. Epub 2023 Sep 14.

Scalable Nanopore sequencing of human genomes provides a comprehensive view of haplotype-resolved variation and methylation

Affiliations

Scalable Nanopore sequencing of human genomes provides a comprehensive view of haplotype-resolved variation and methylation

Mikhail Kolmogorov et al. Nat Methods. 2023 Oct.

Abstract

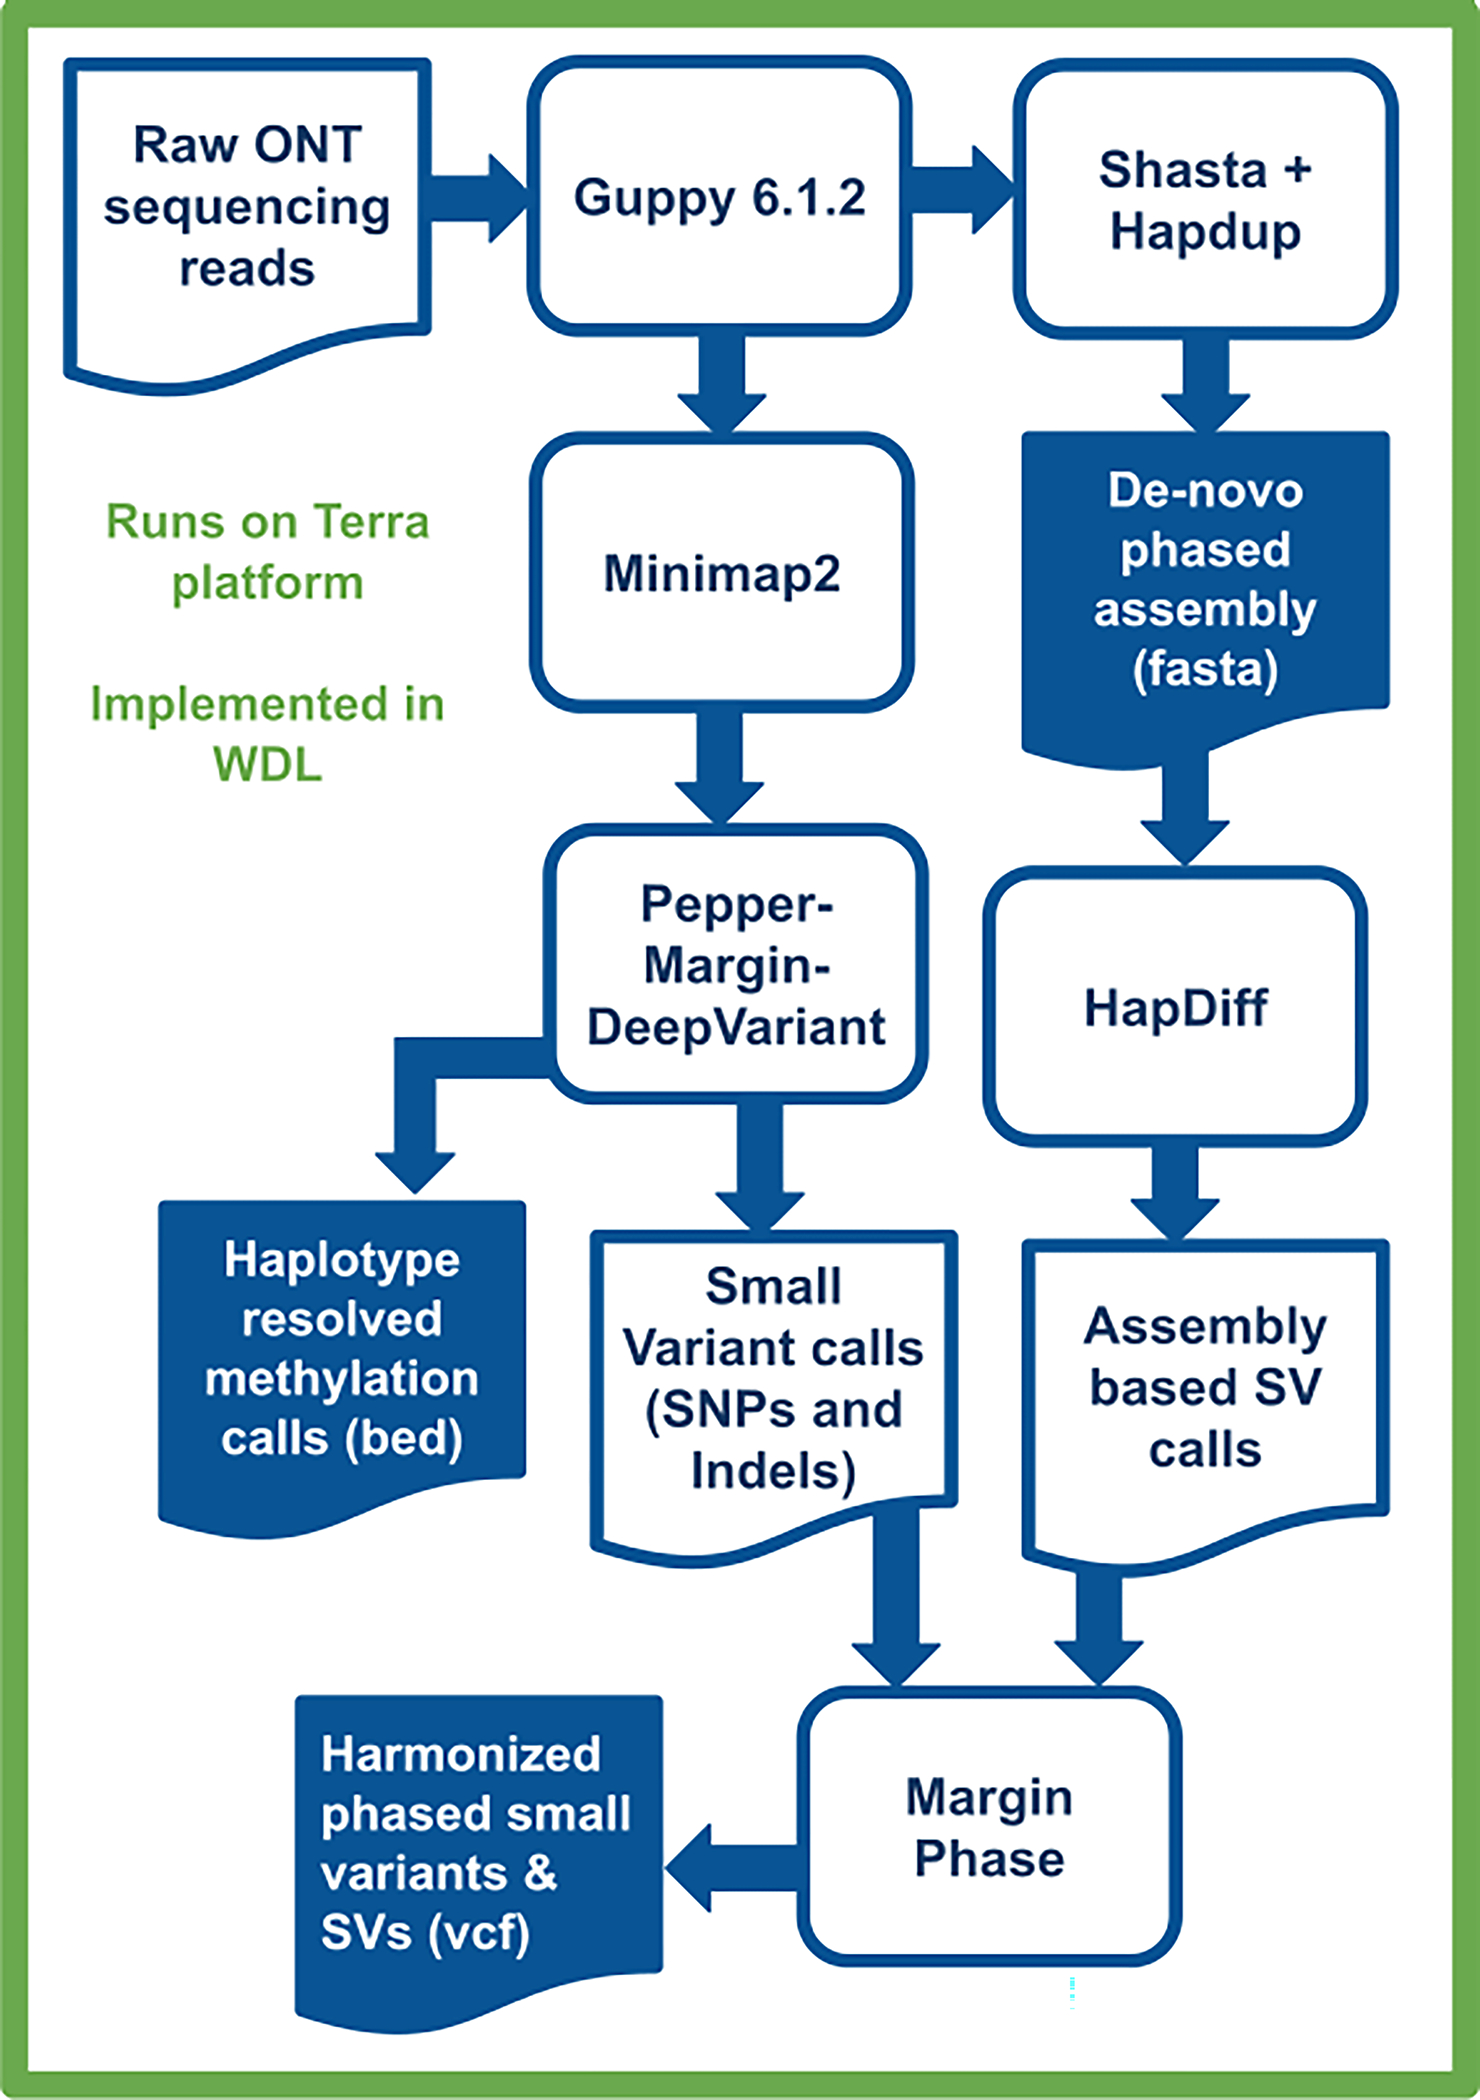
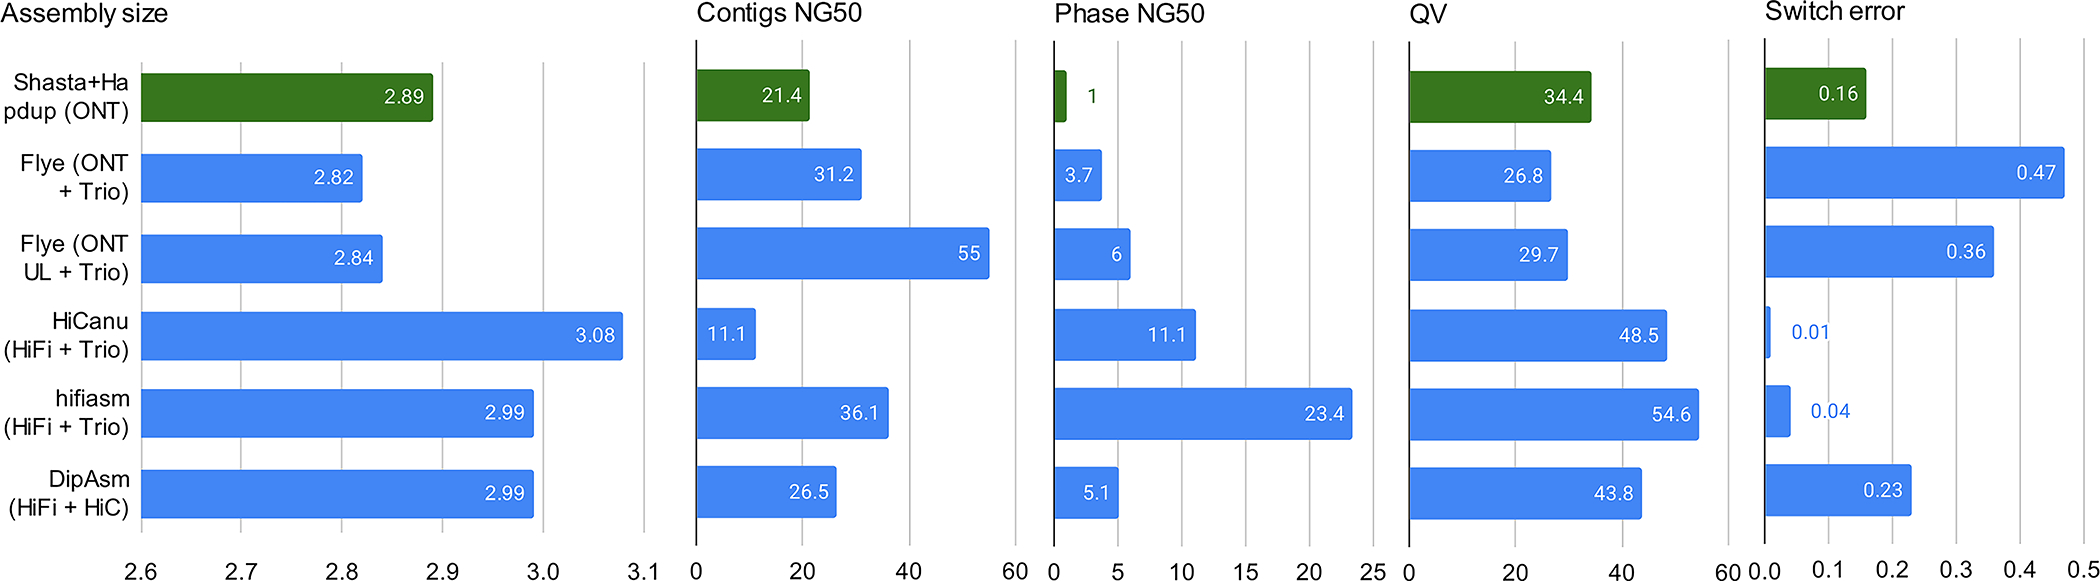
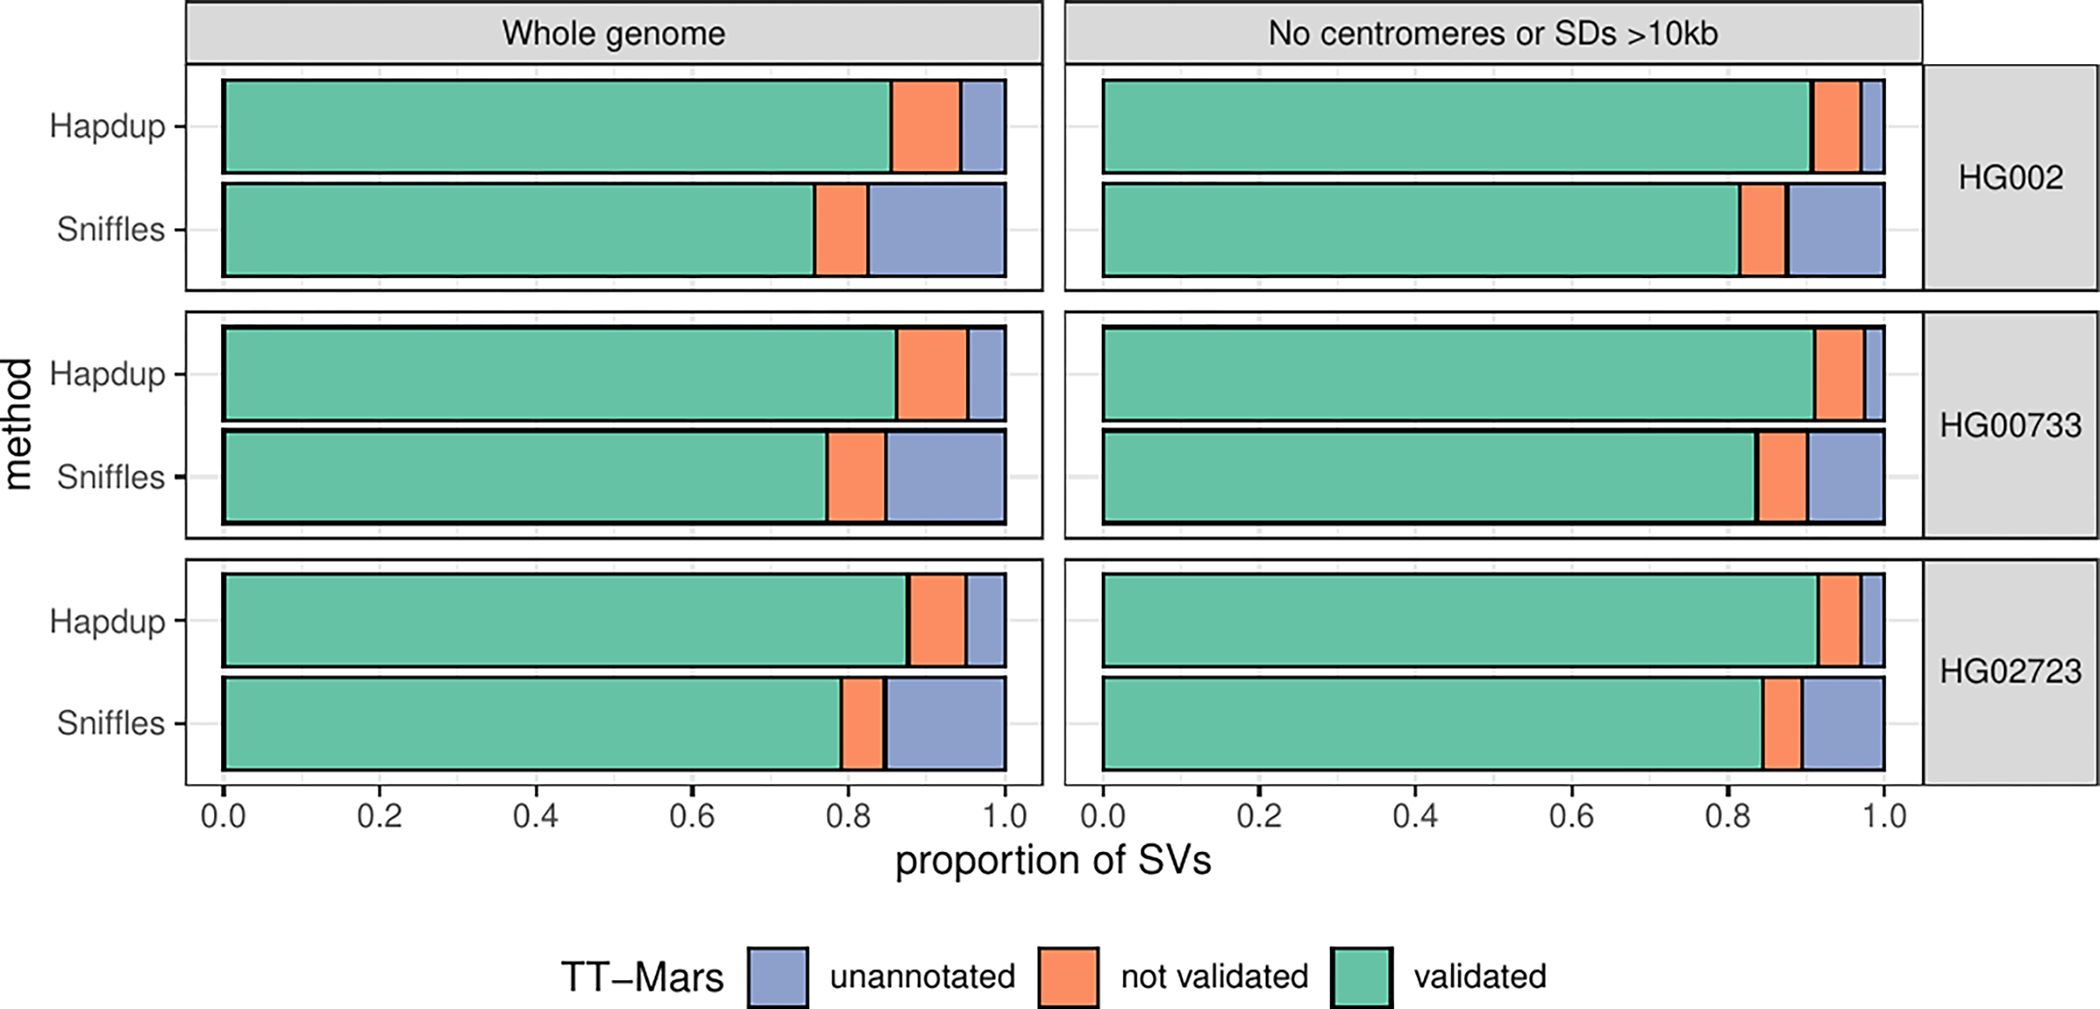
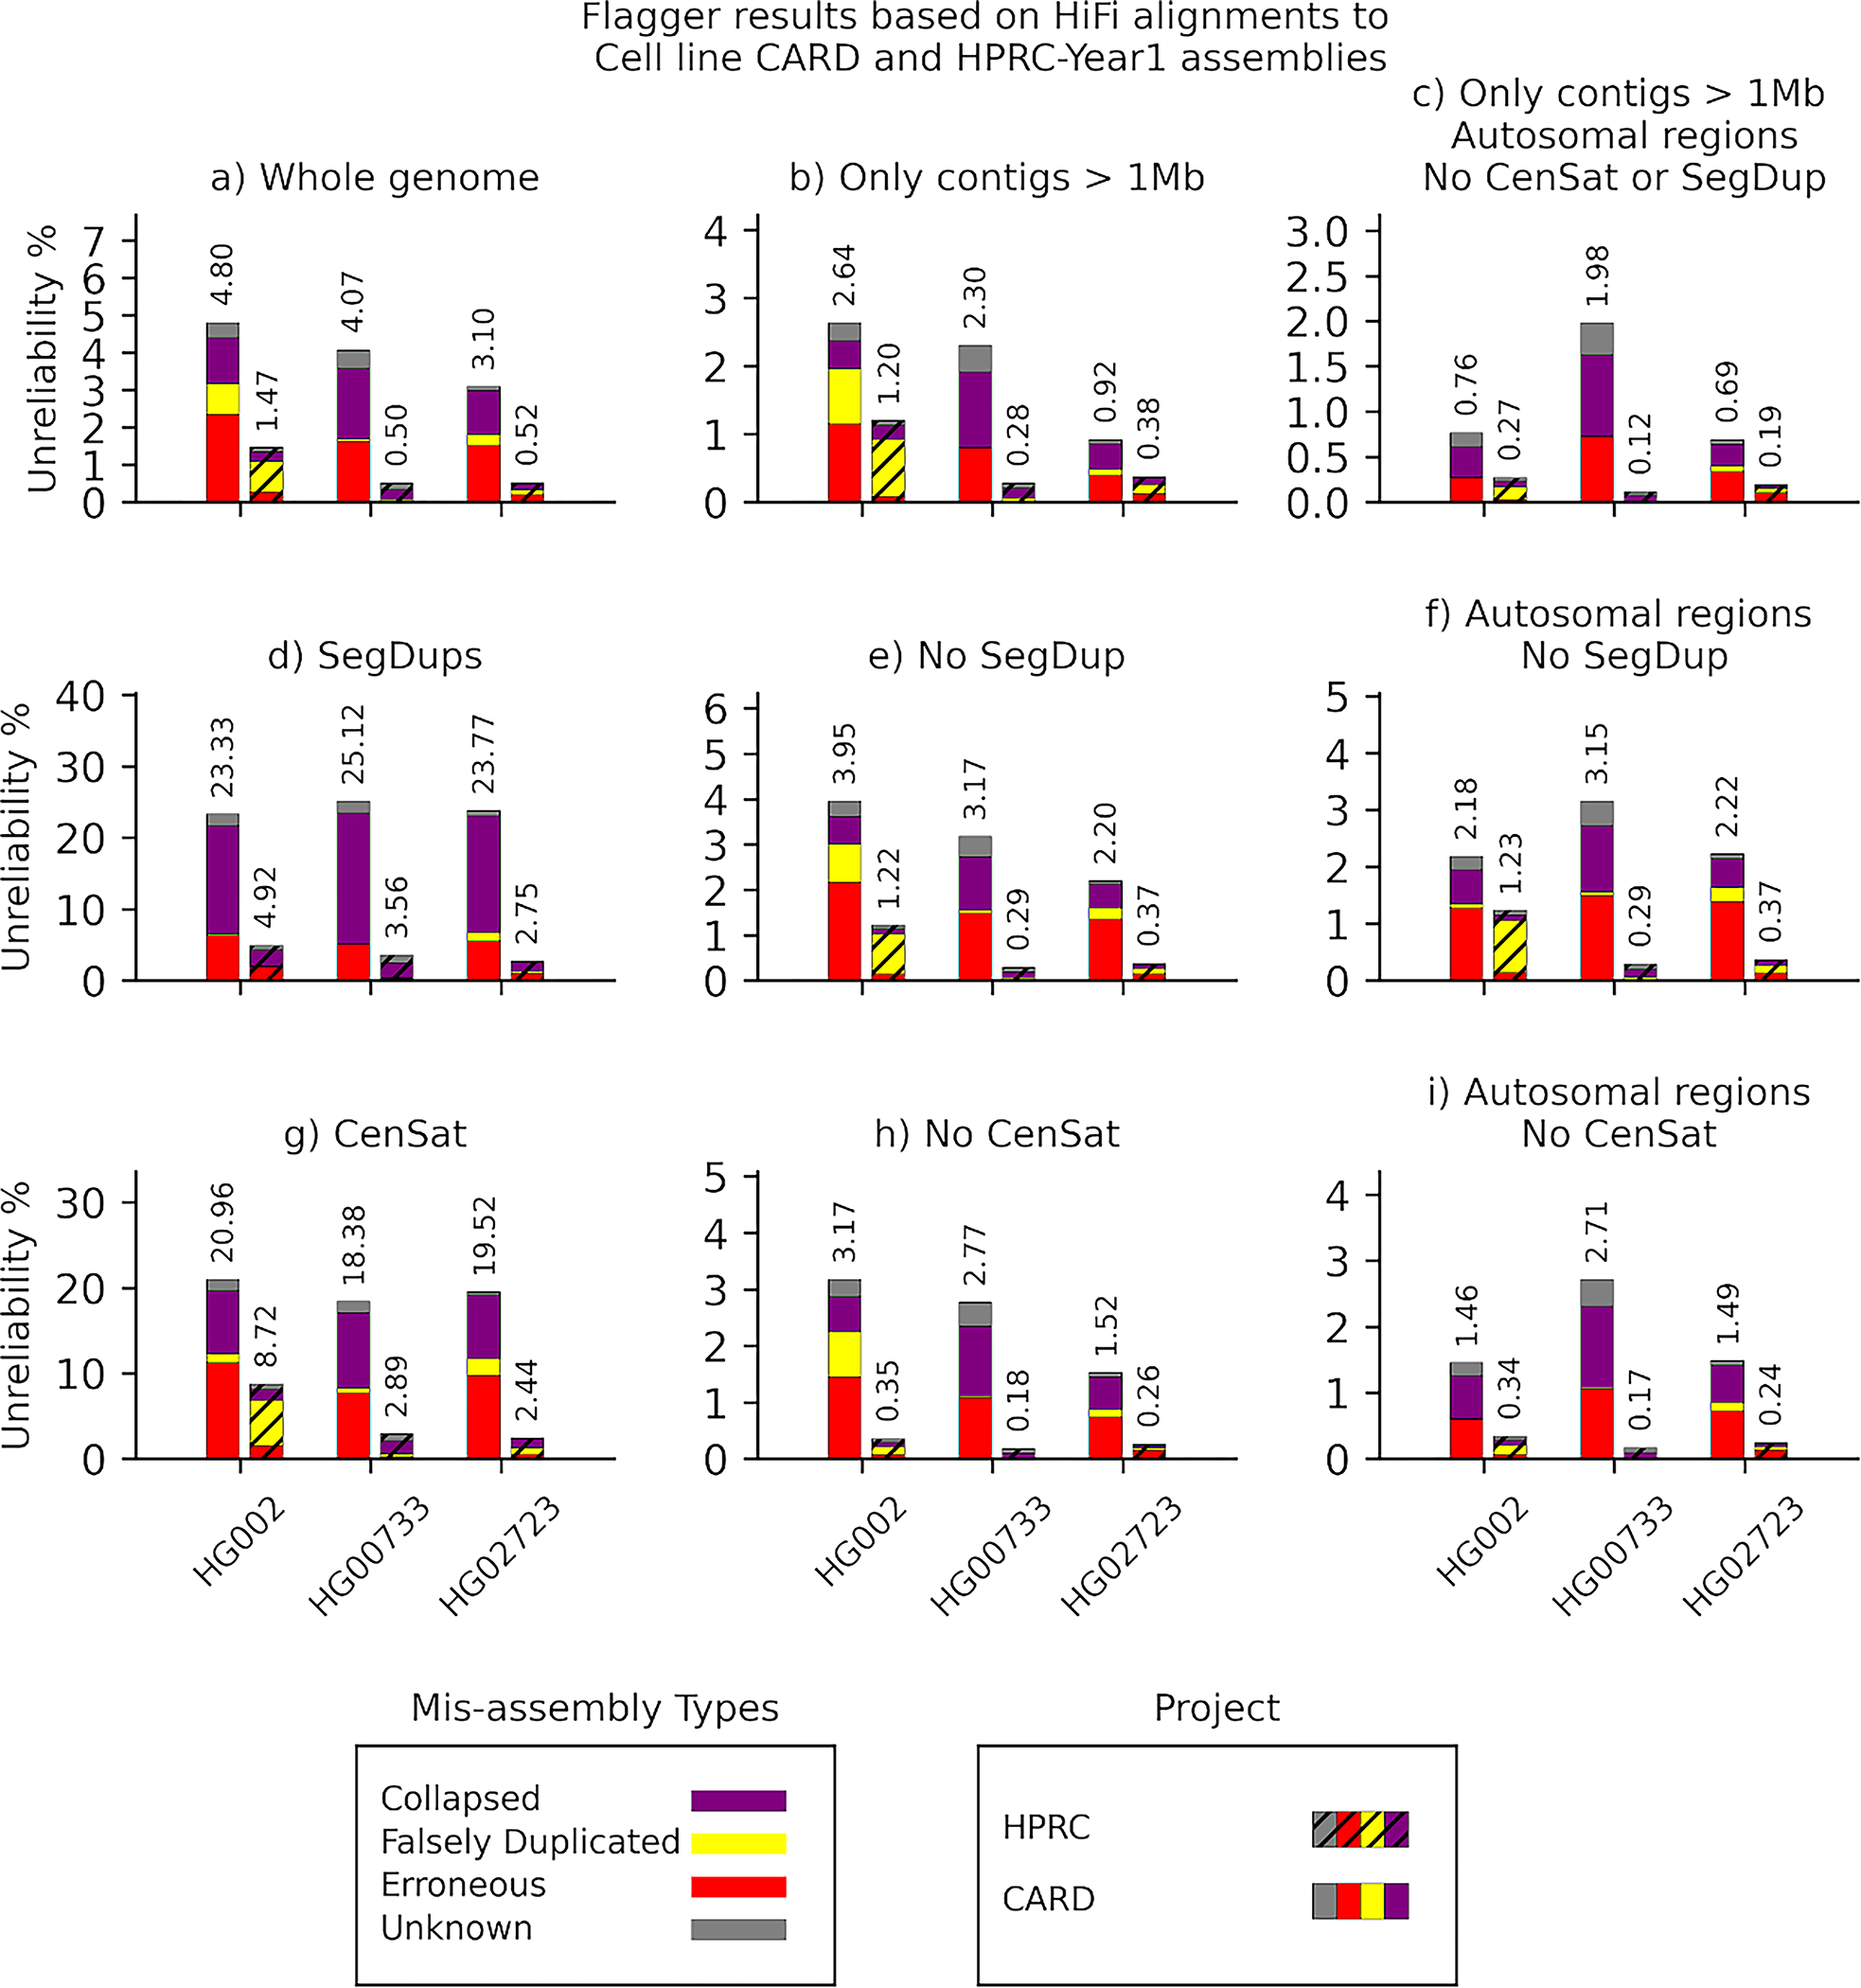
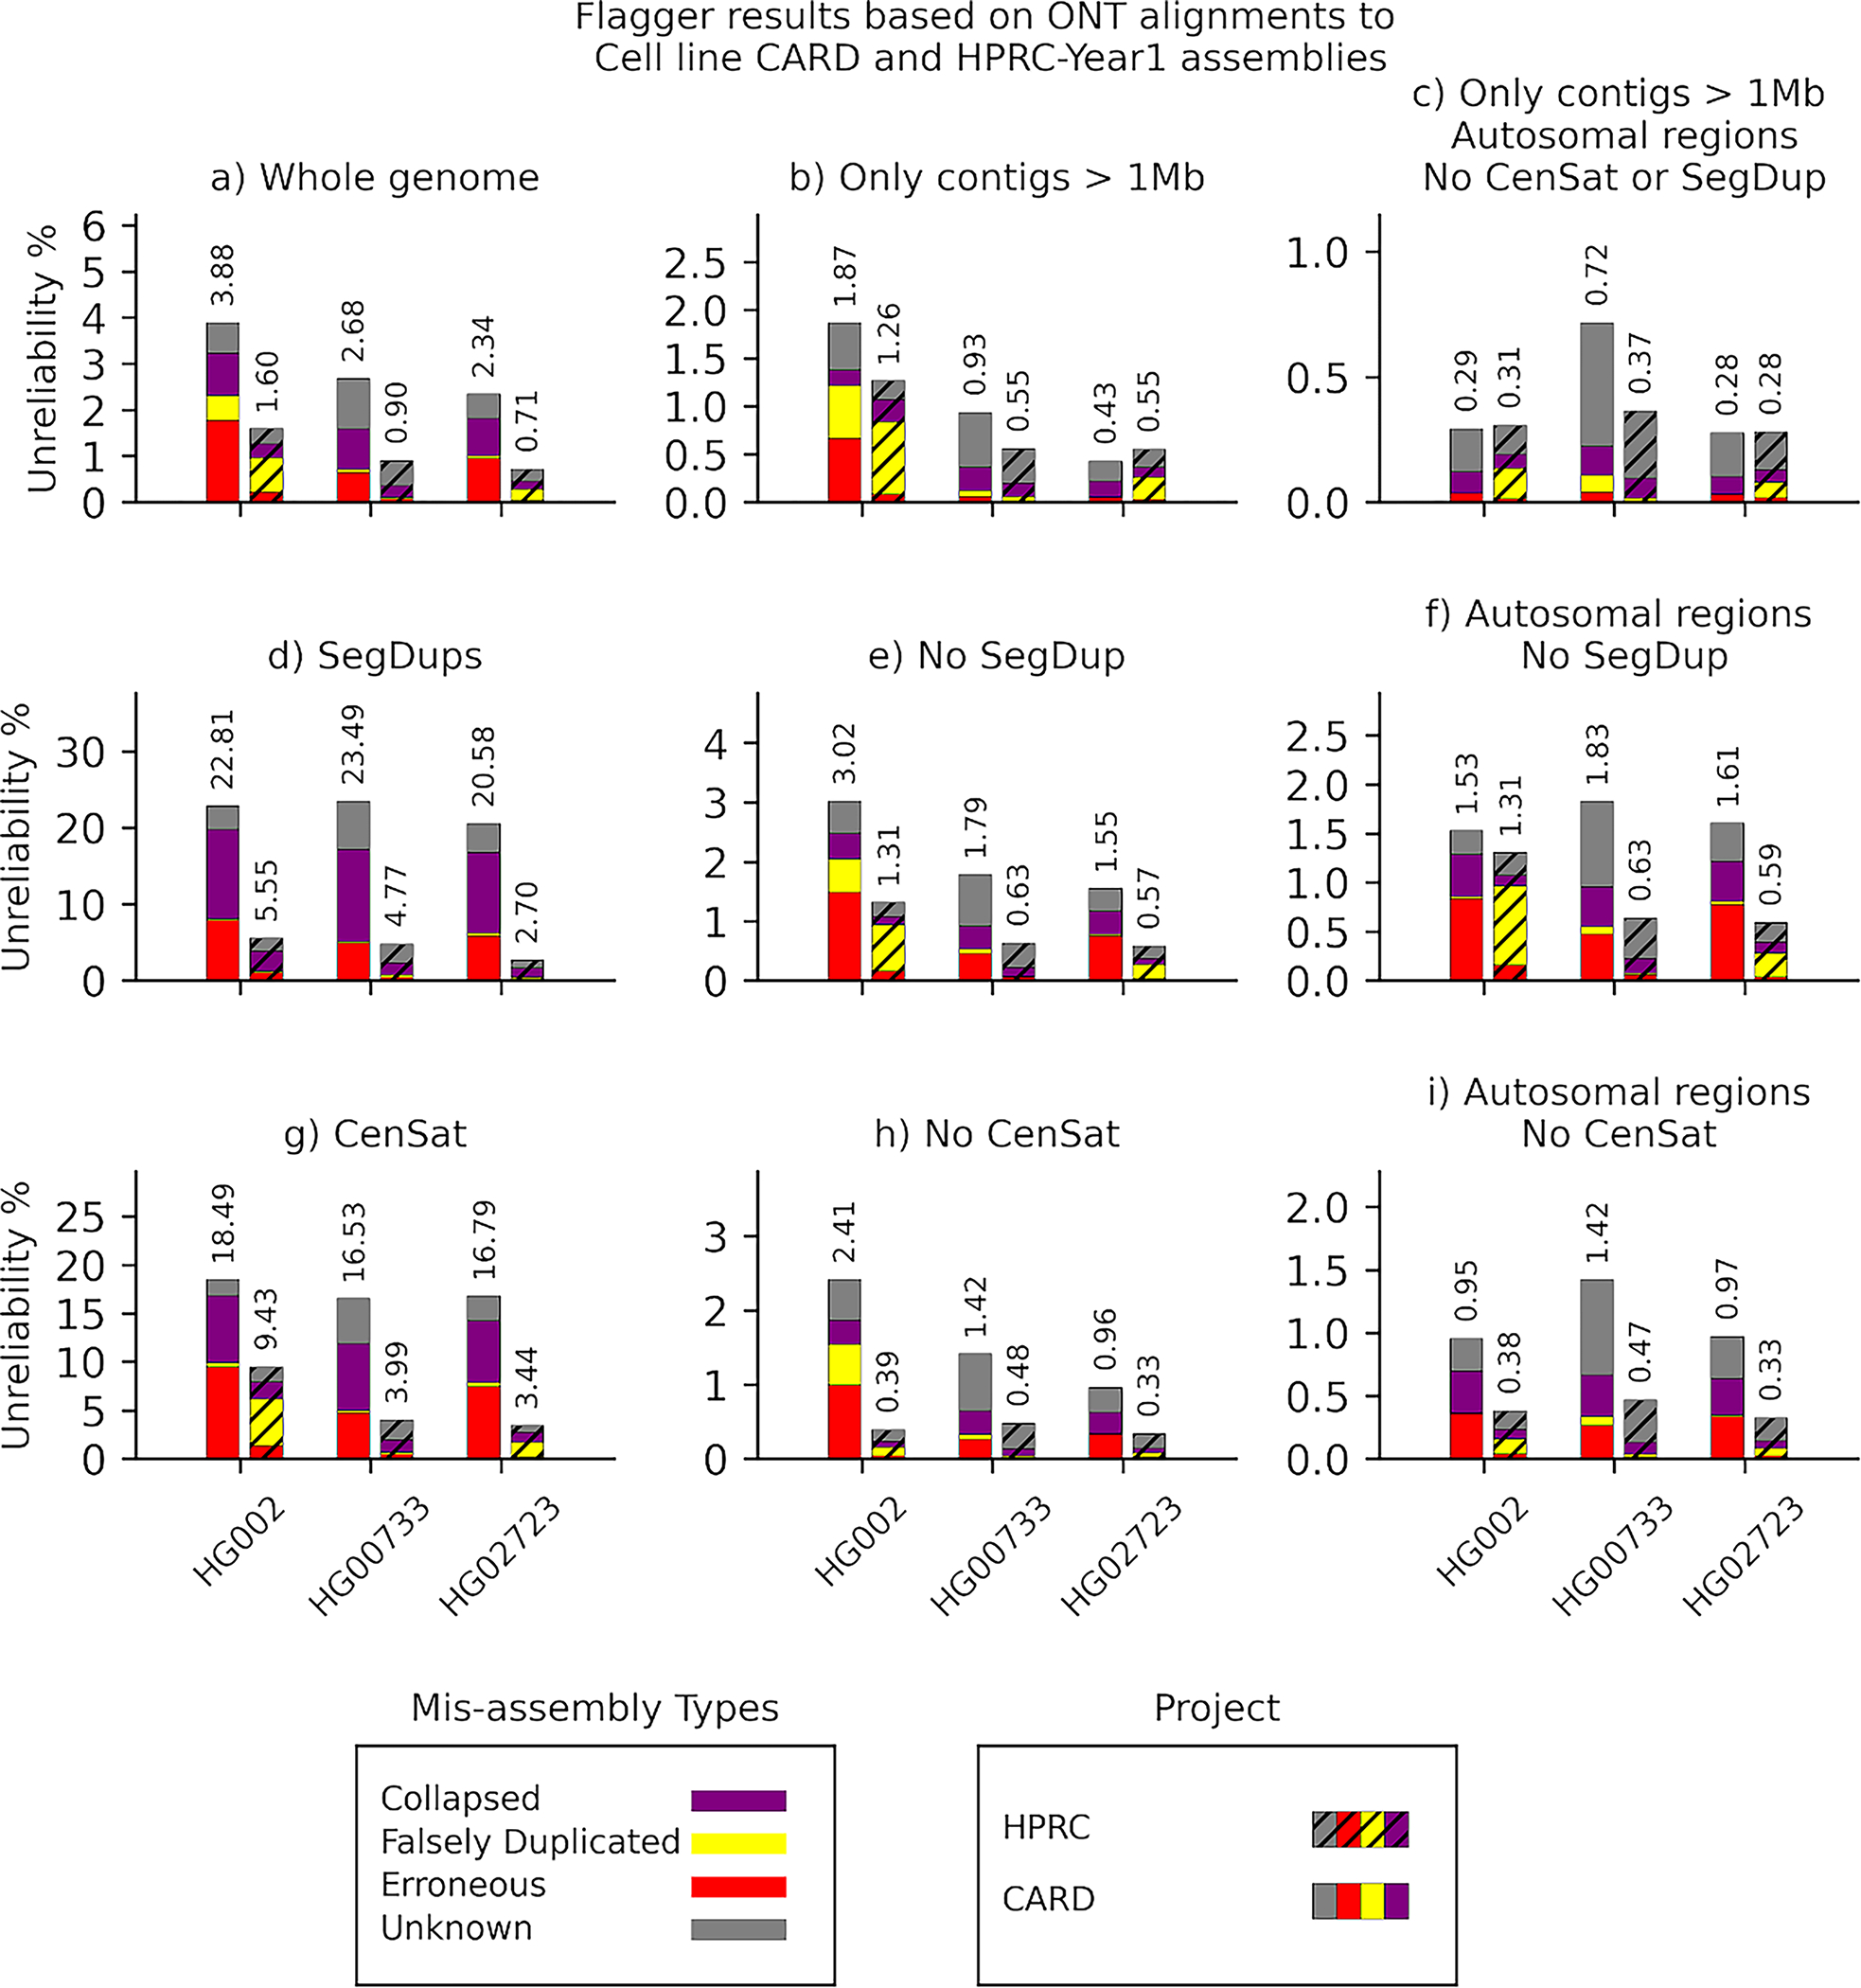
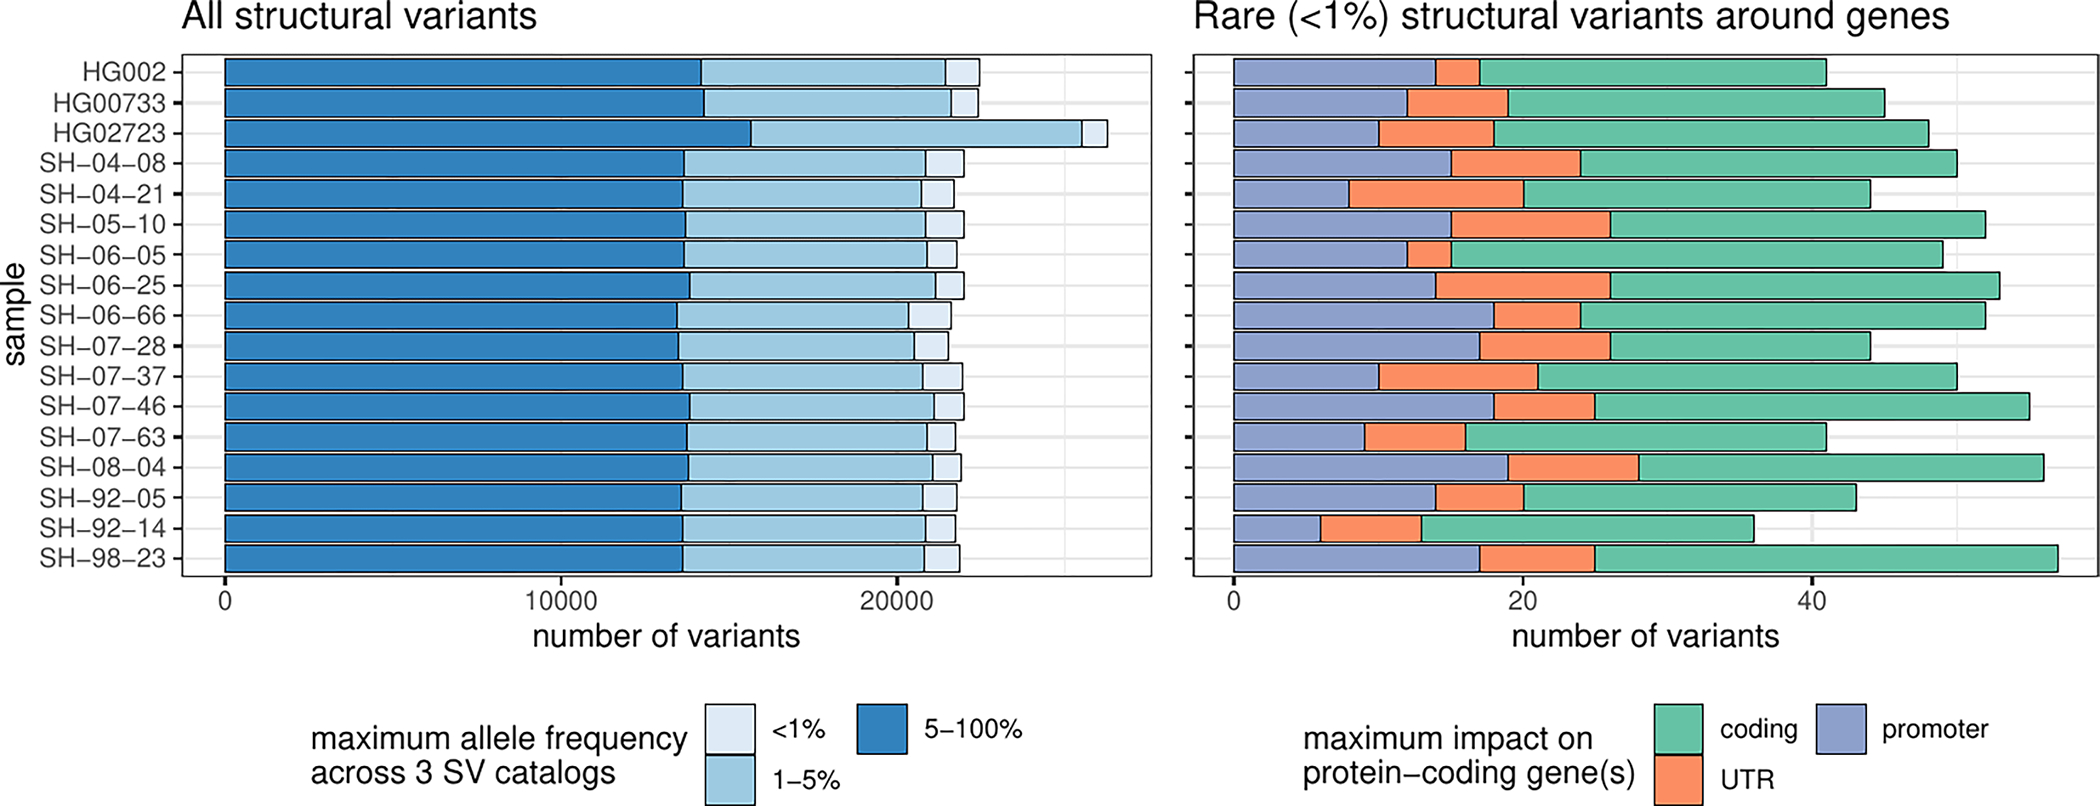
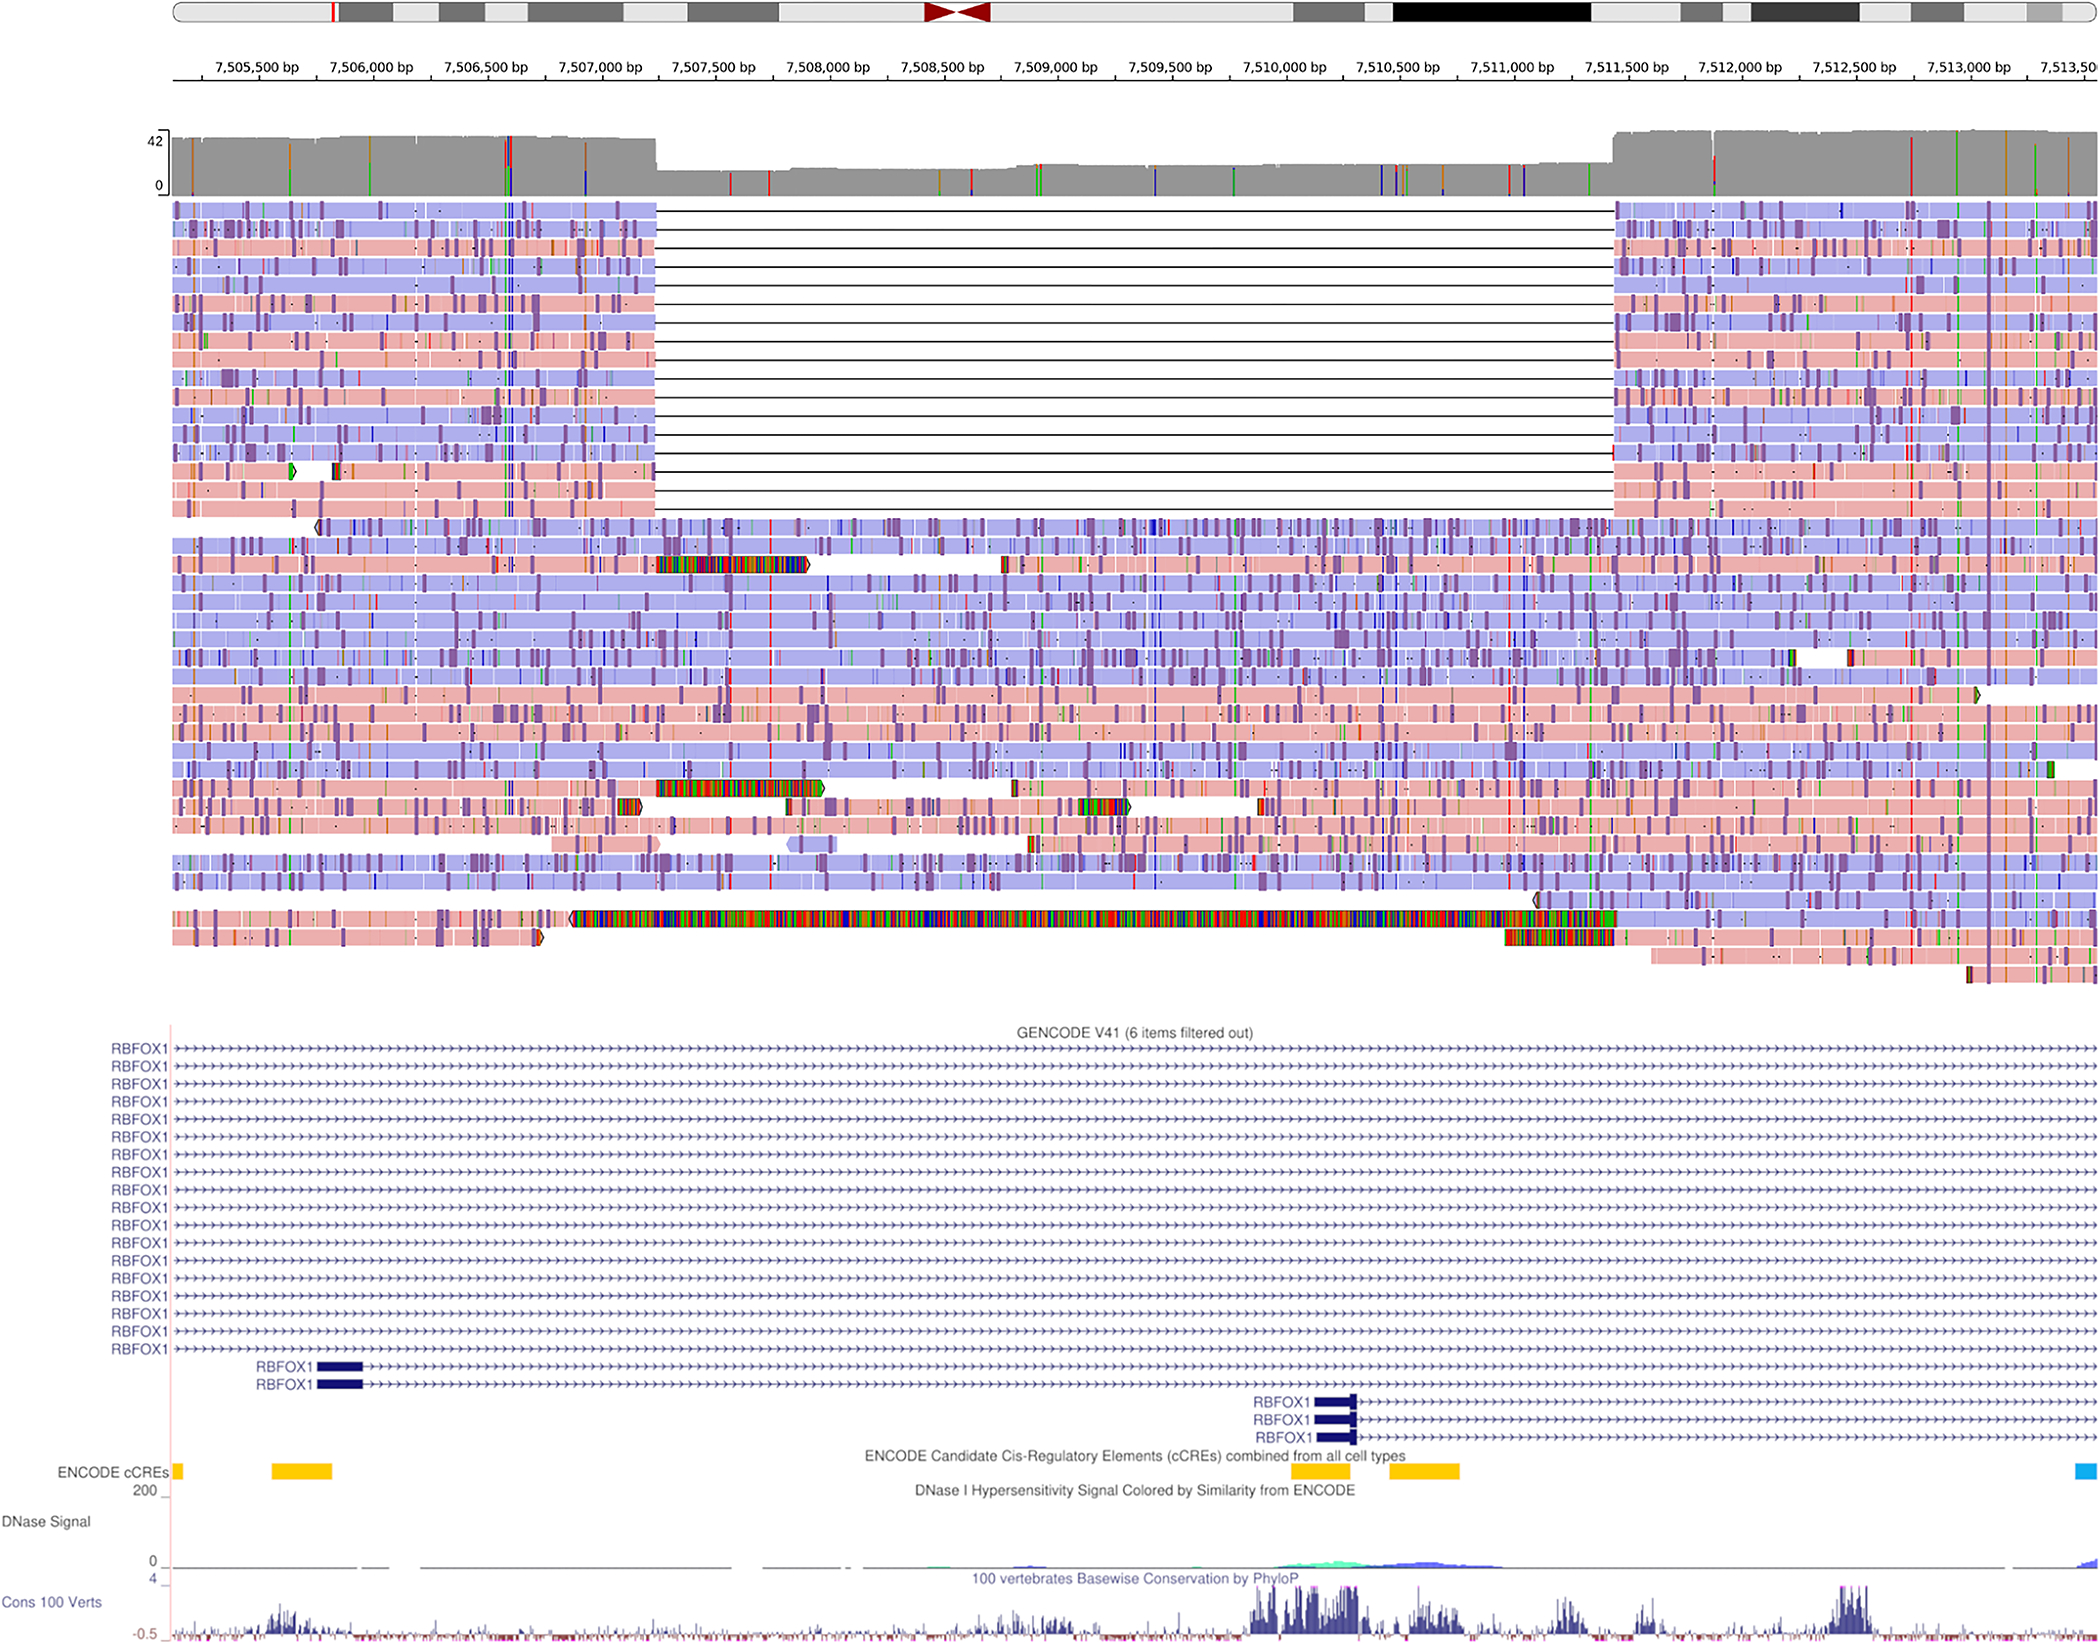
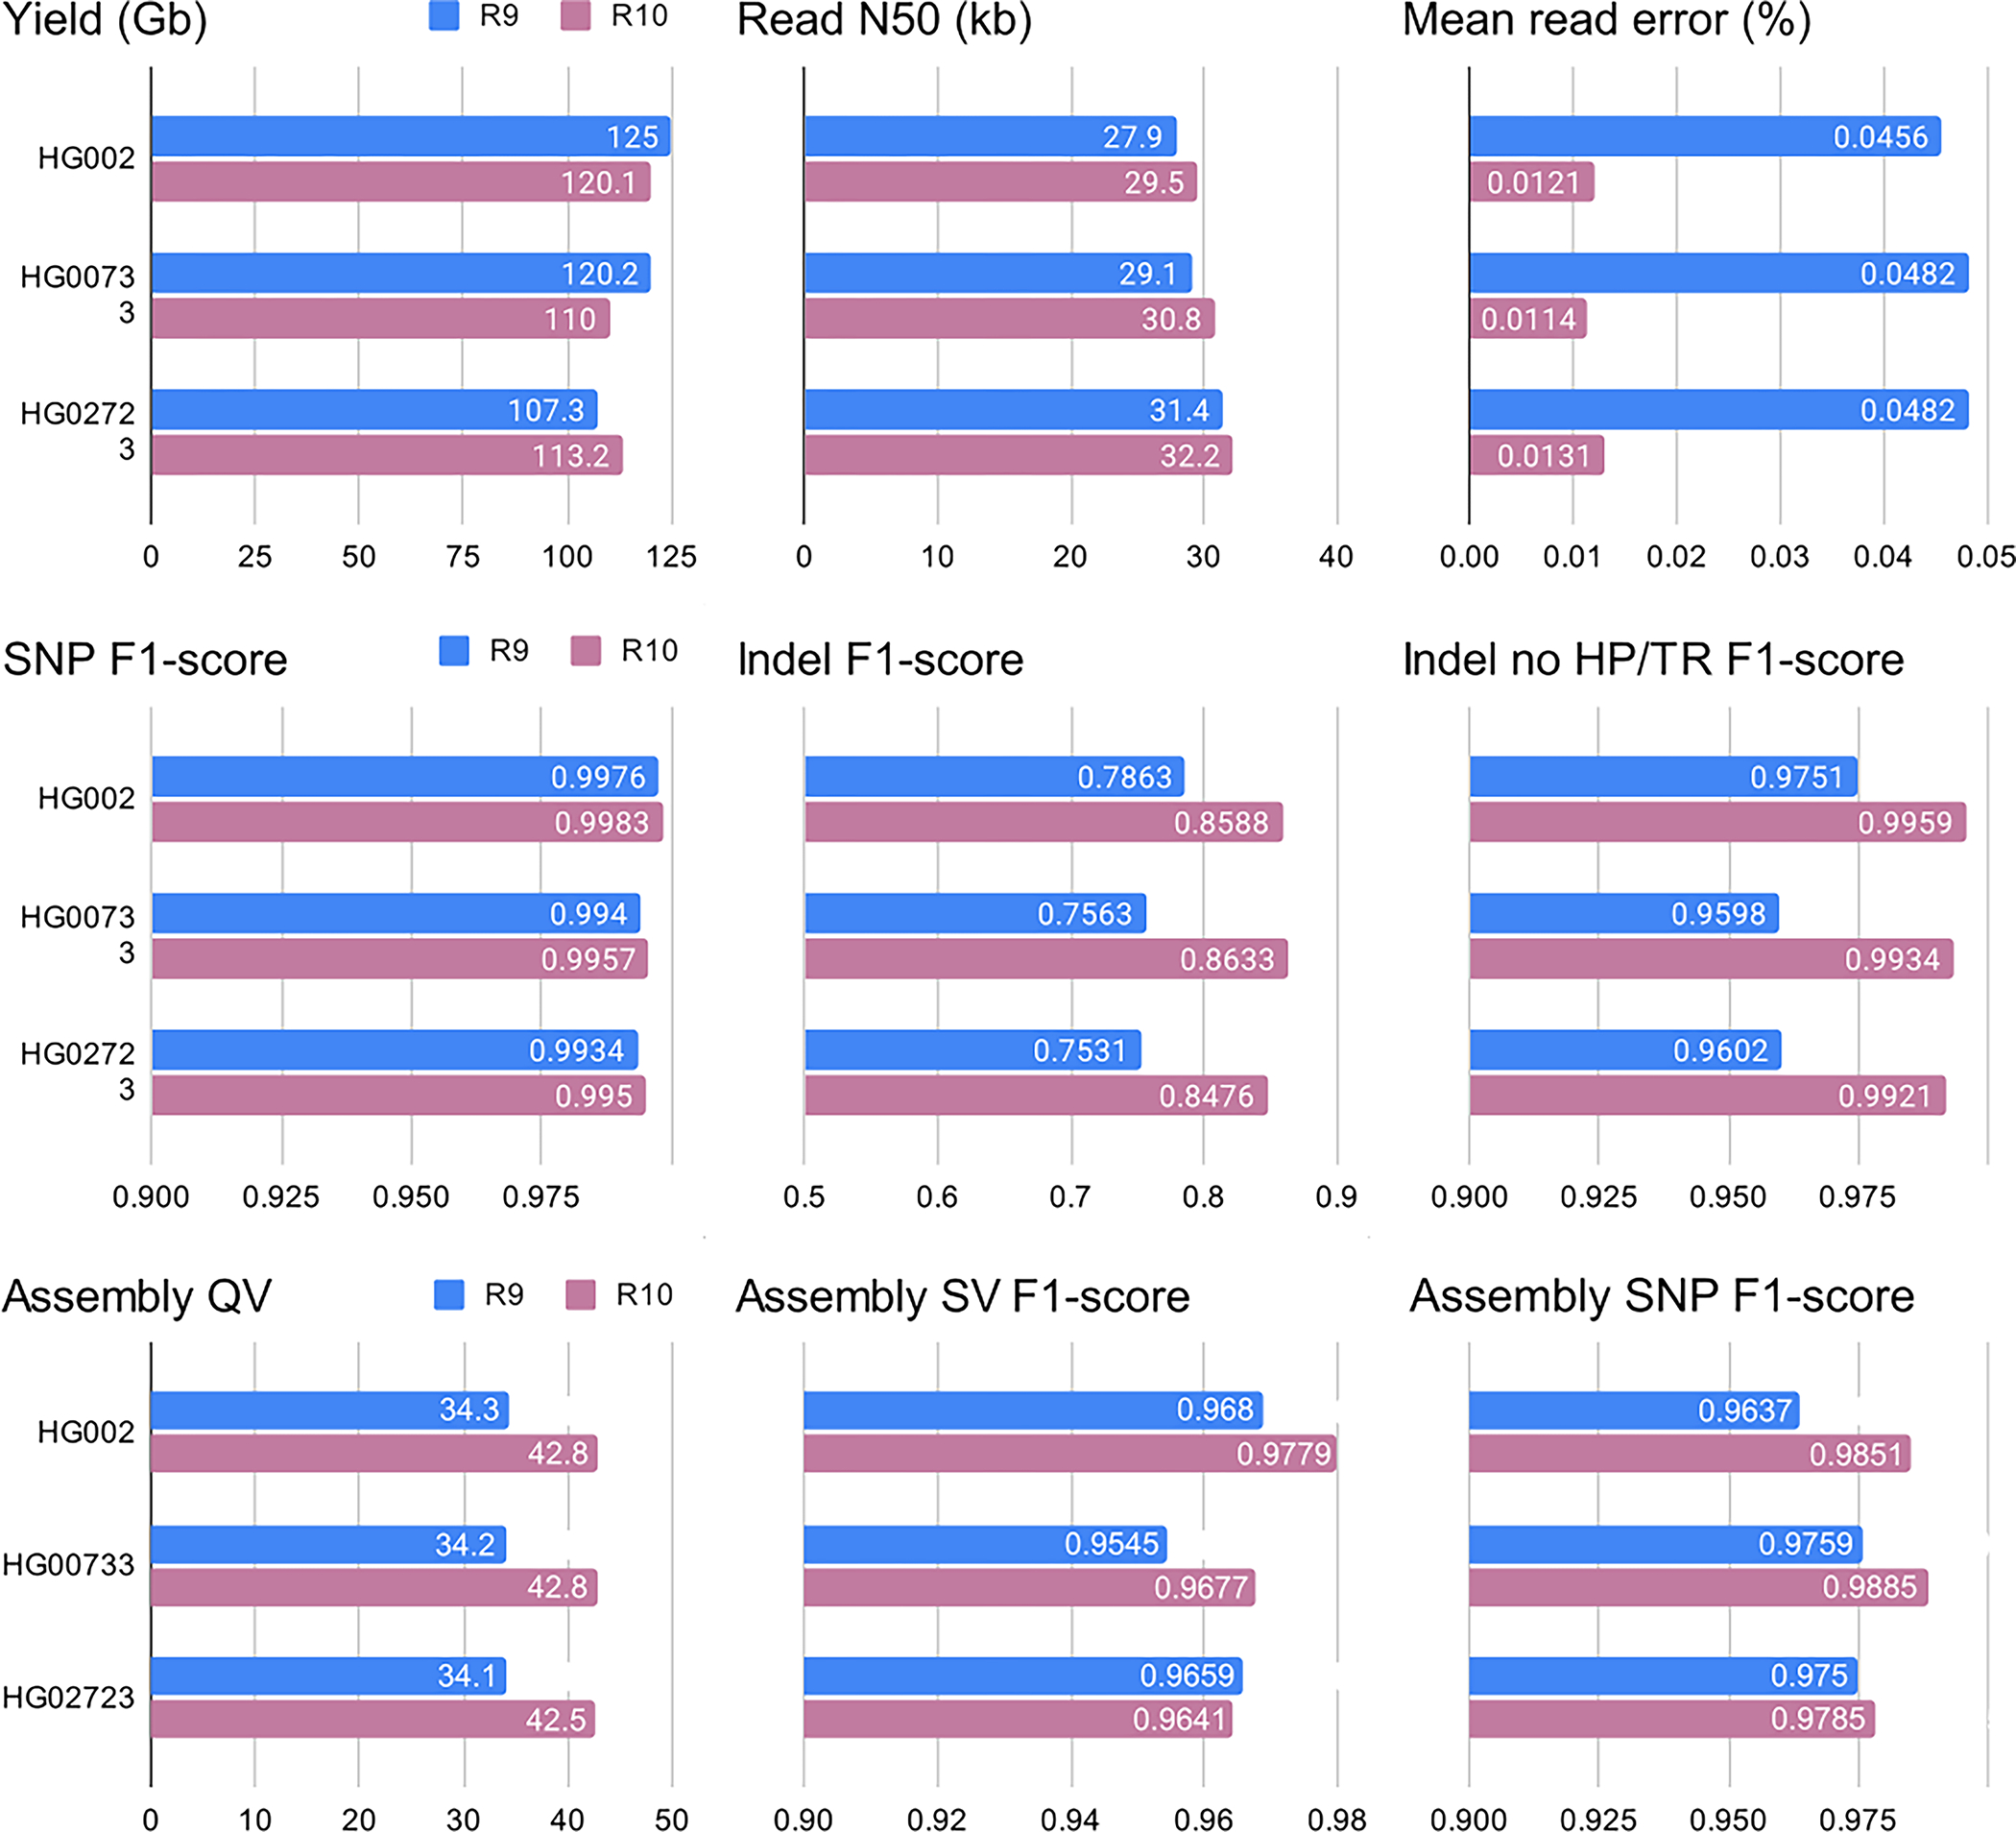
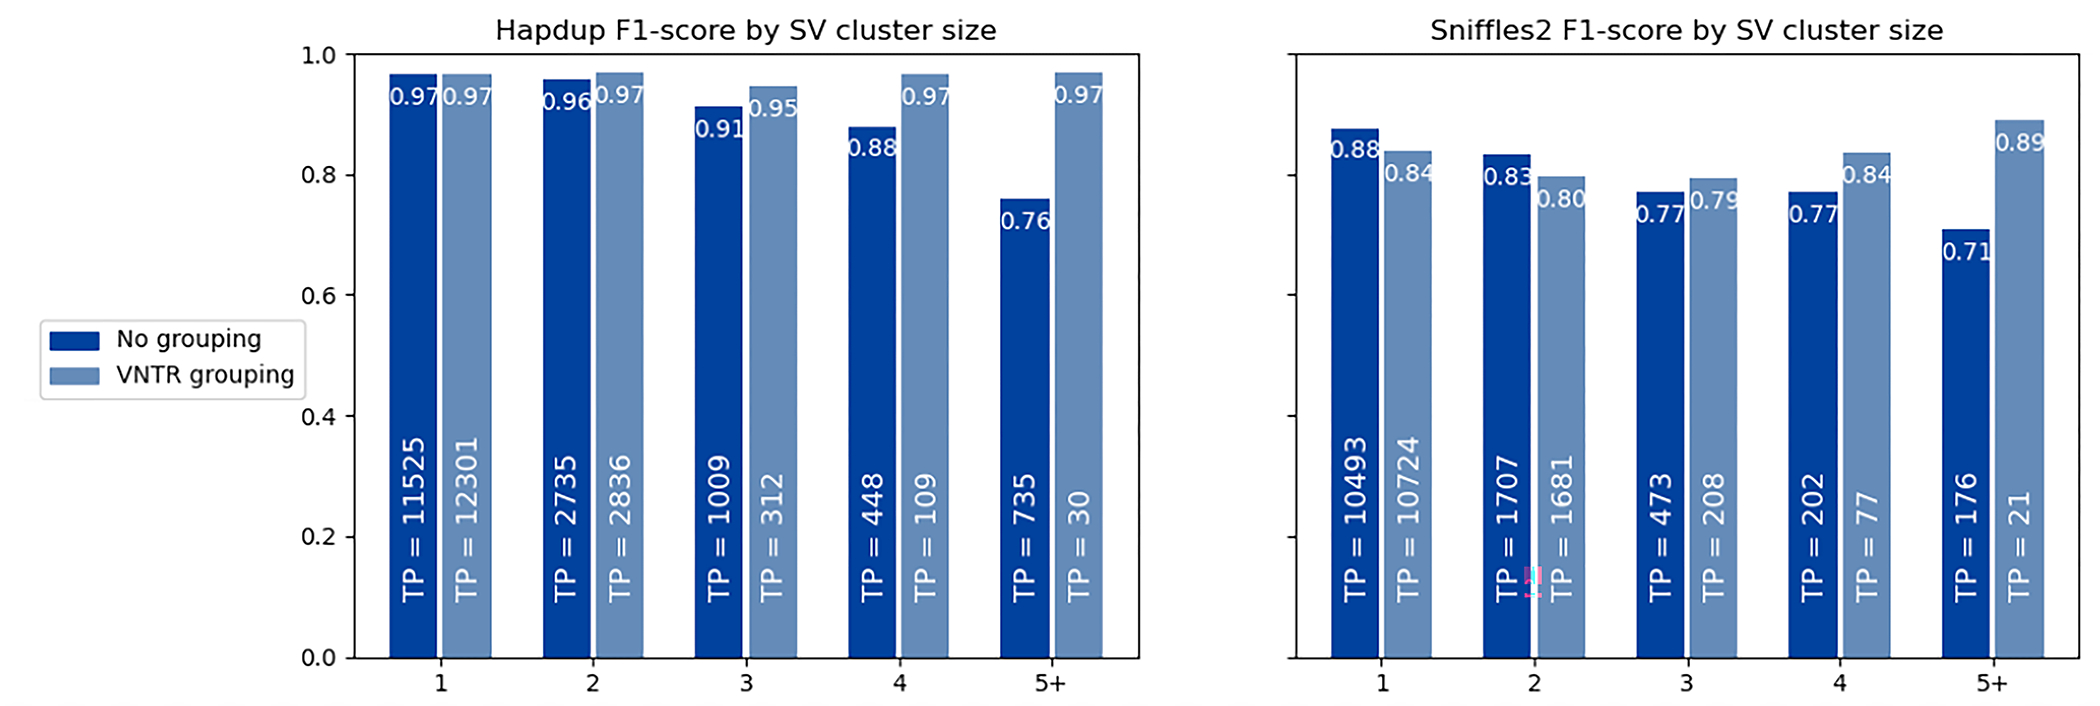
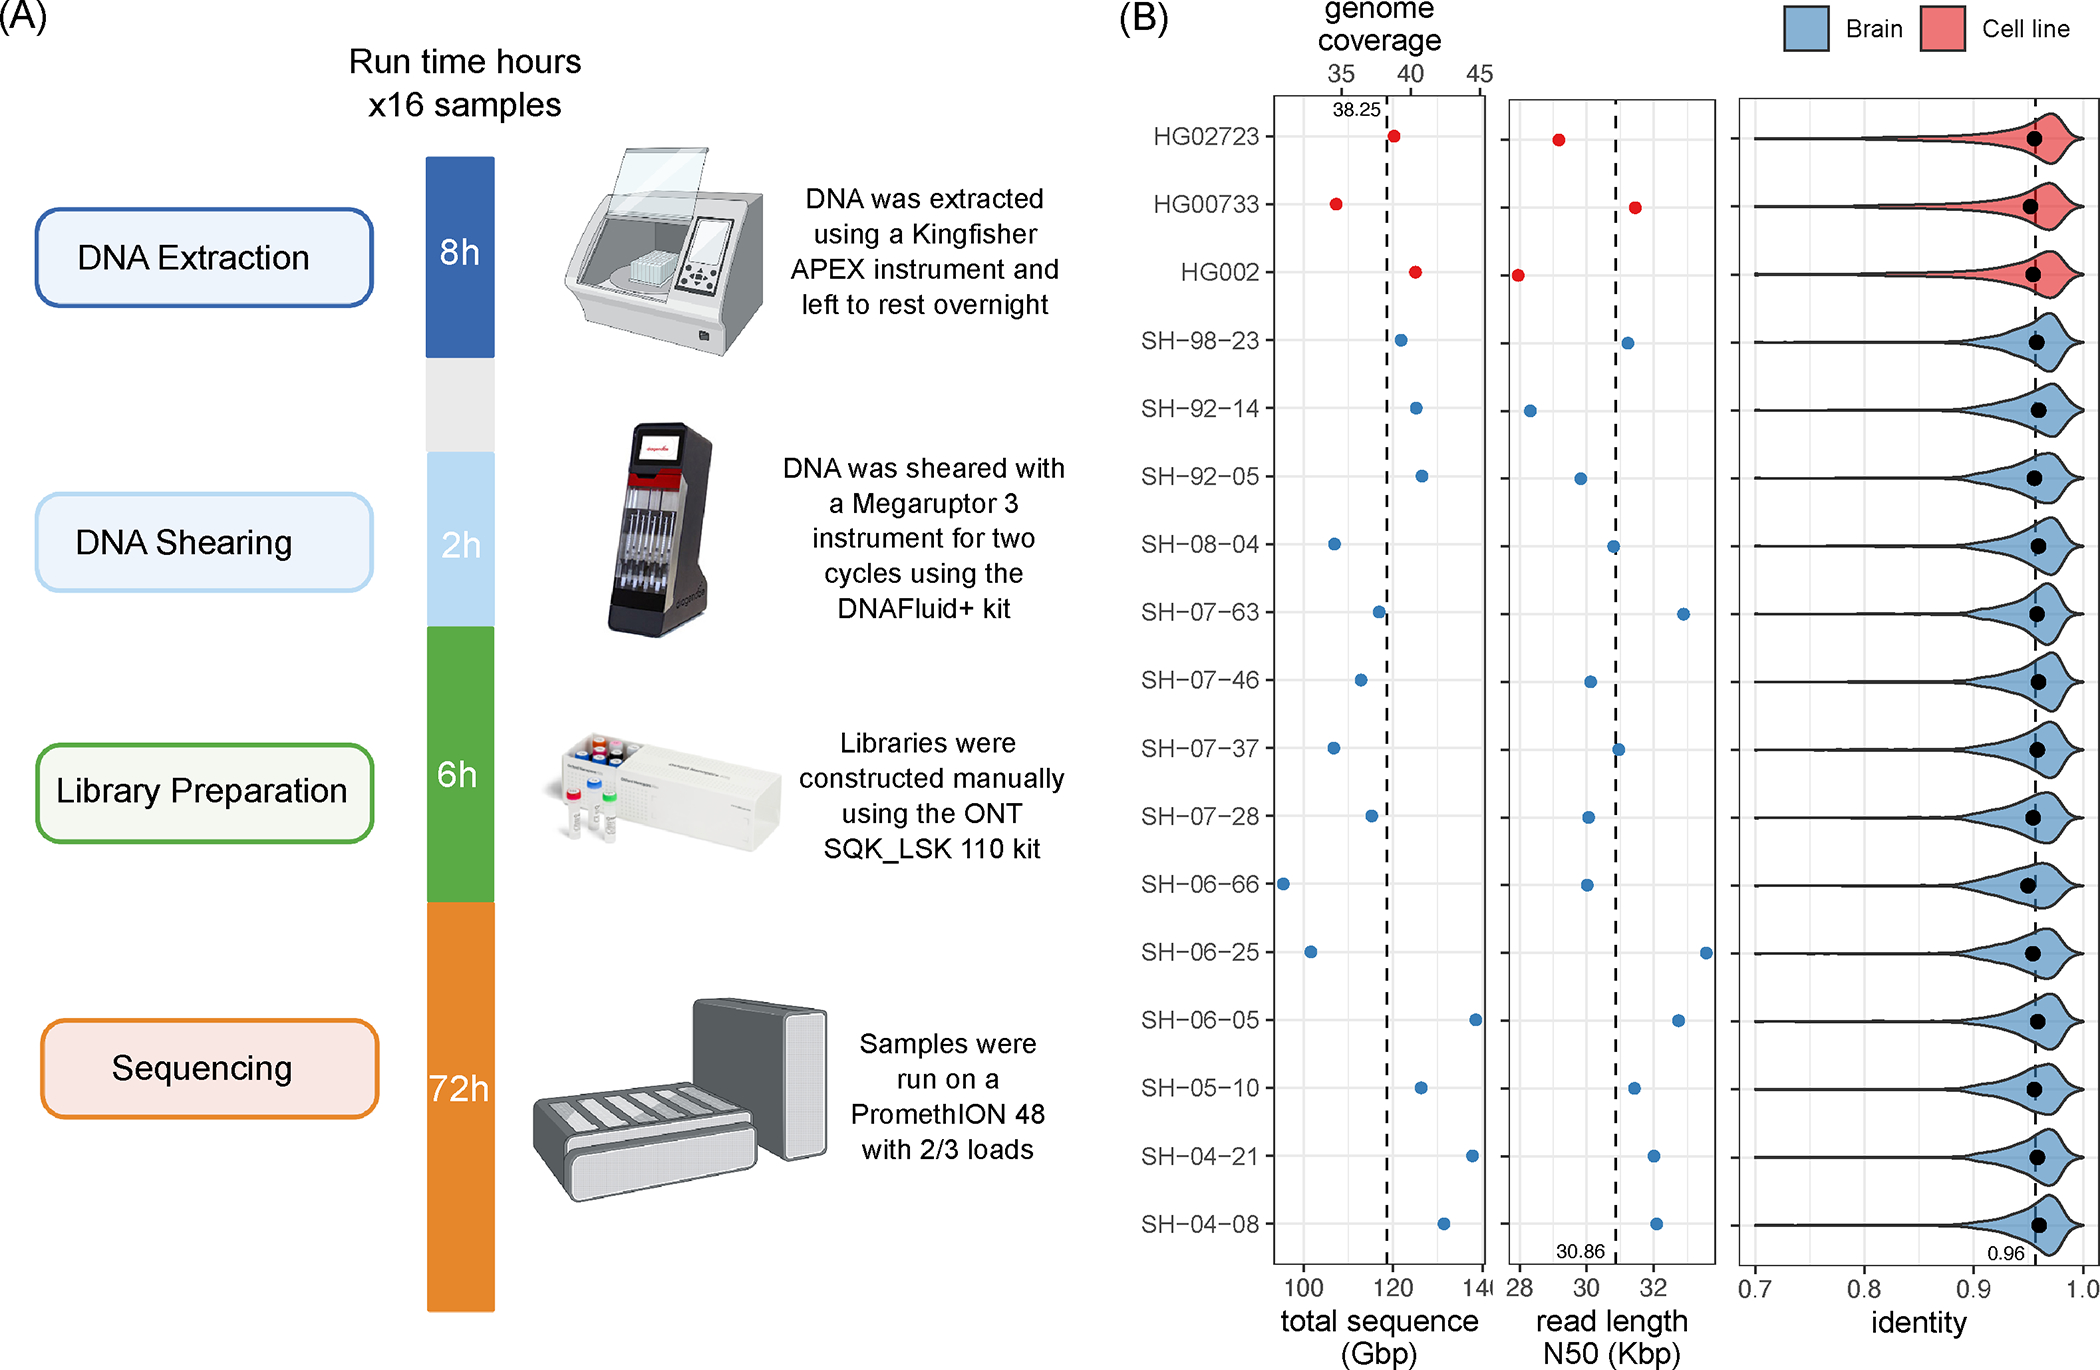
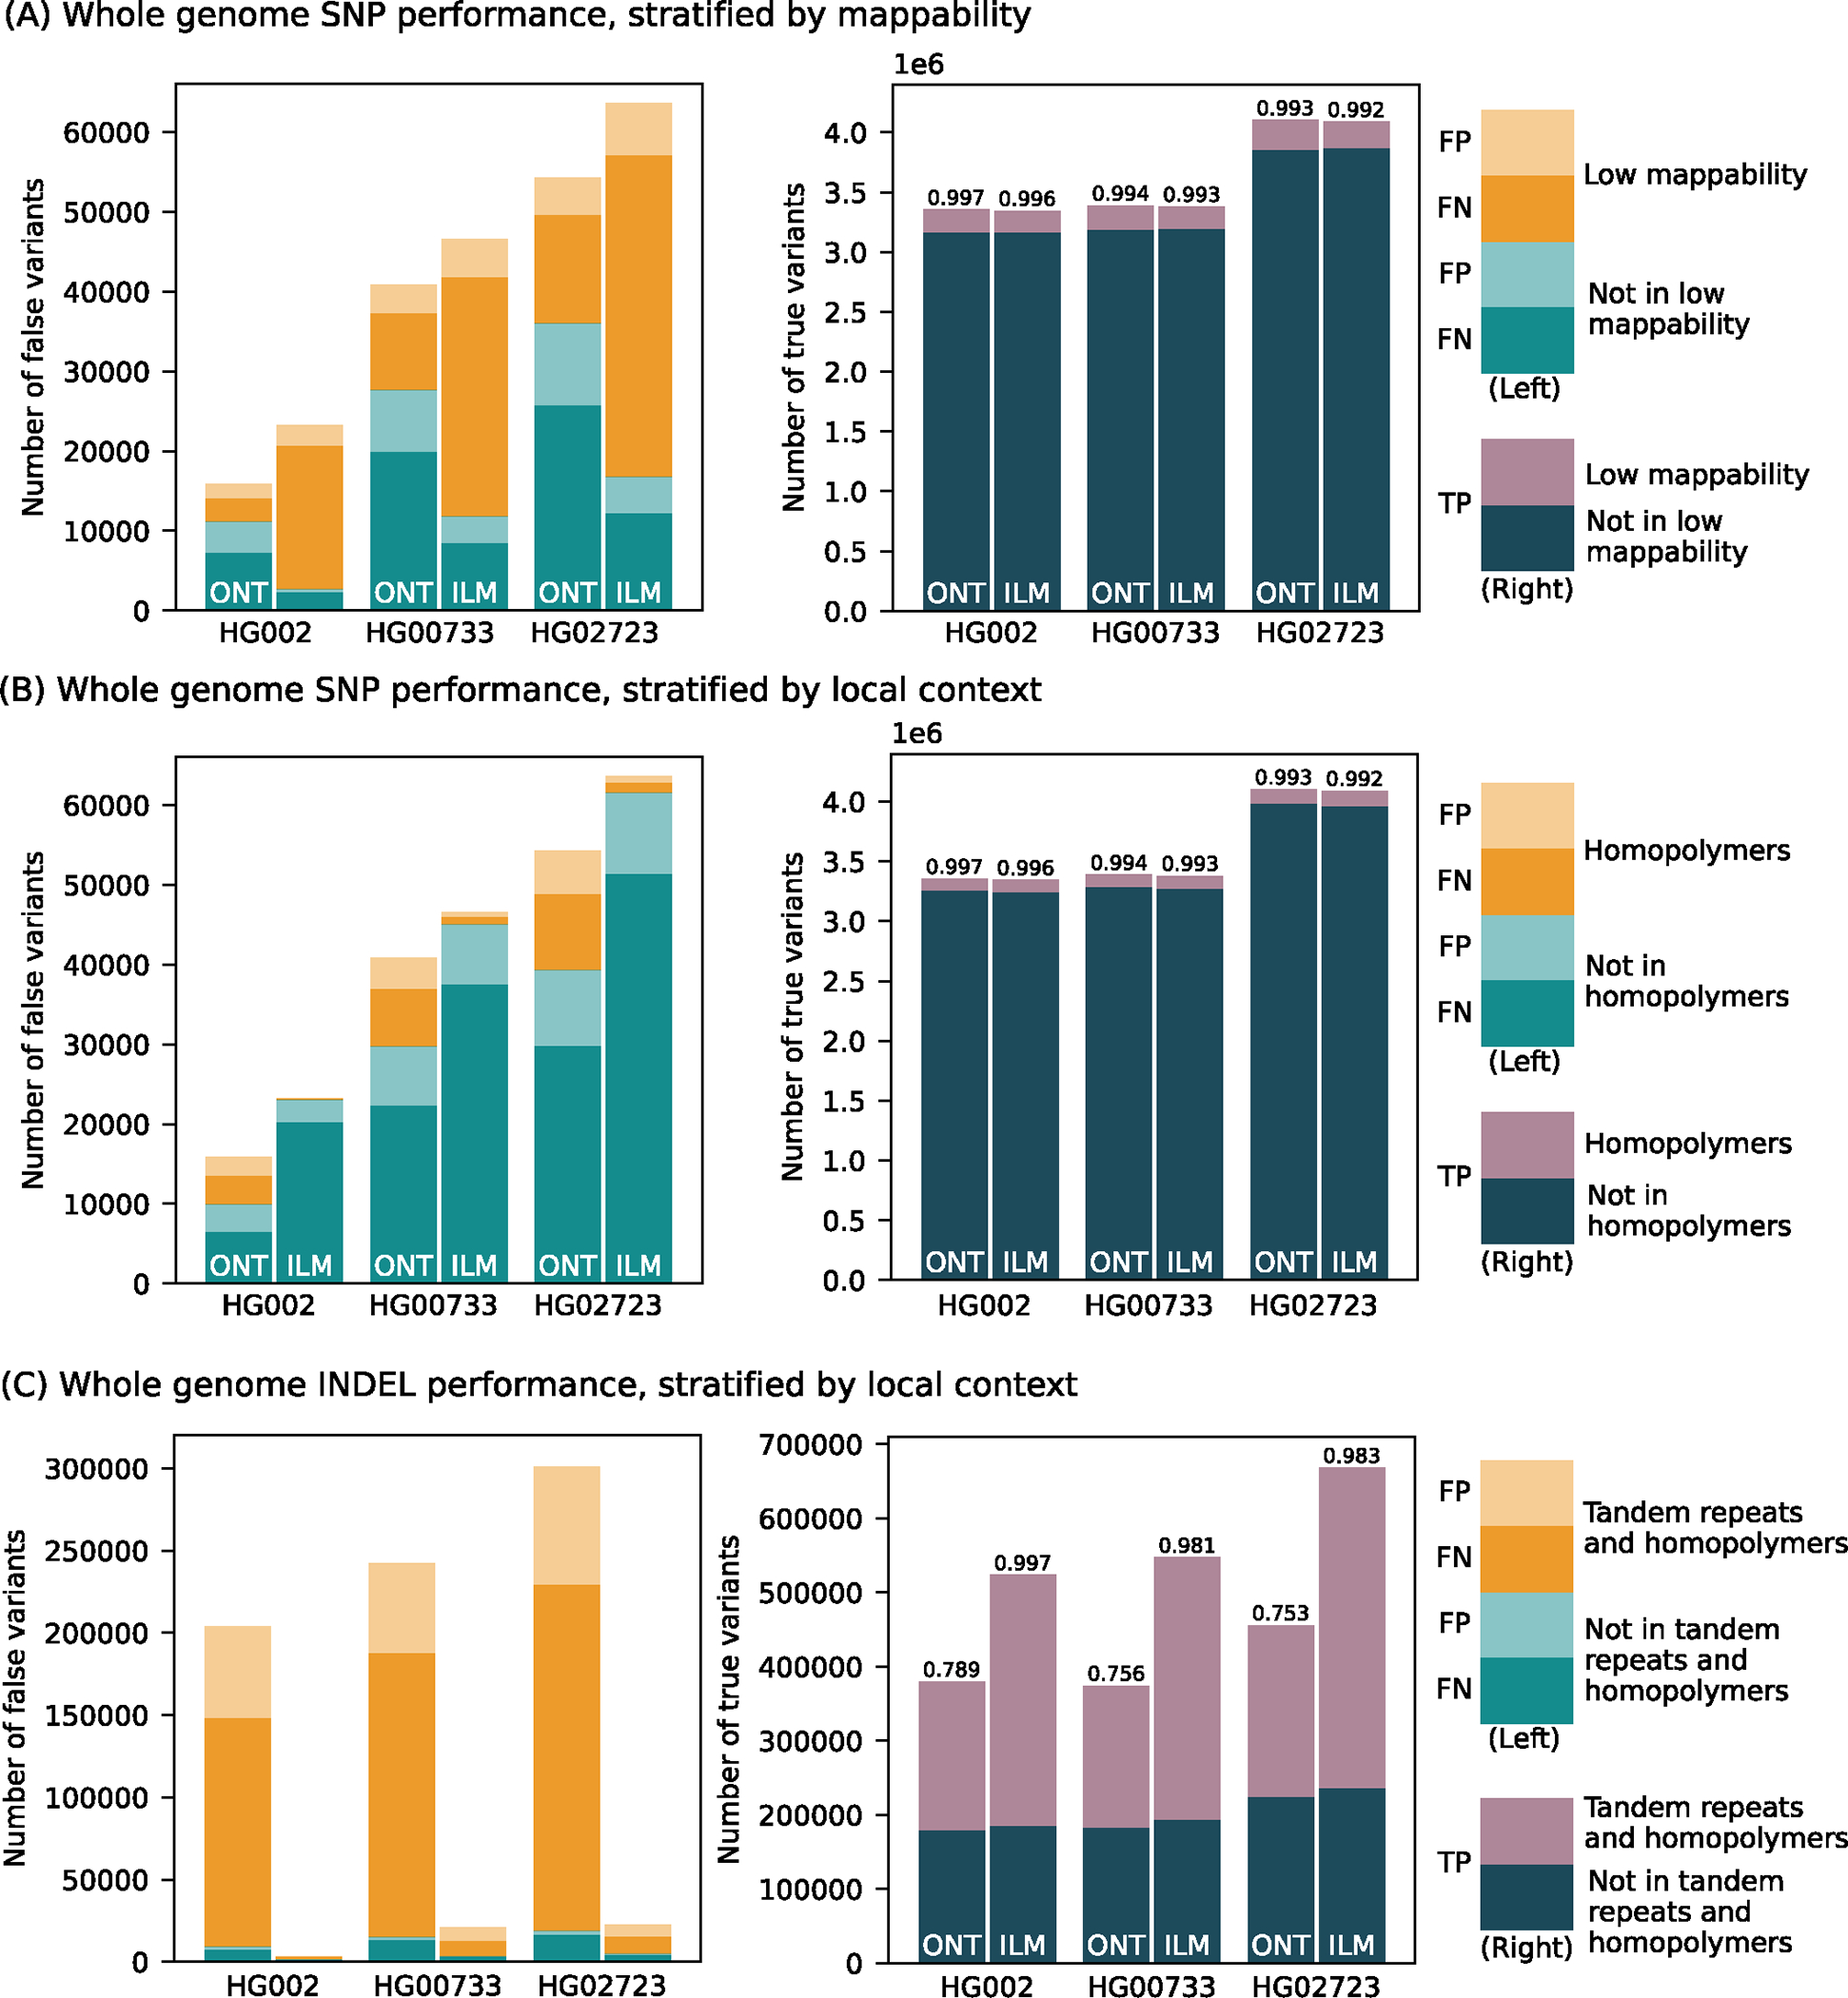
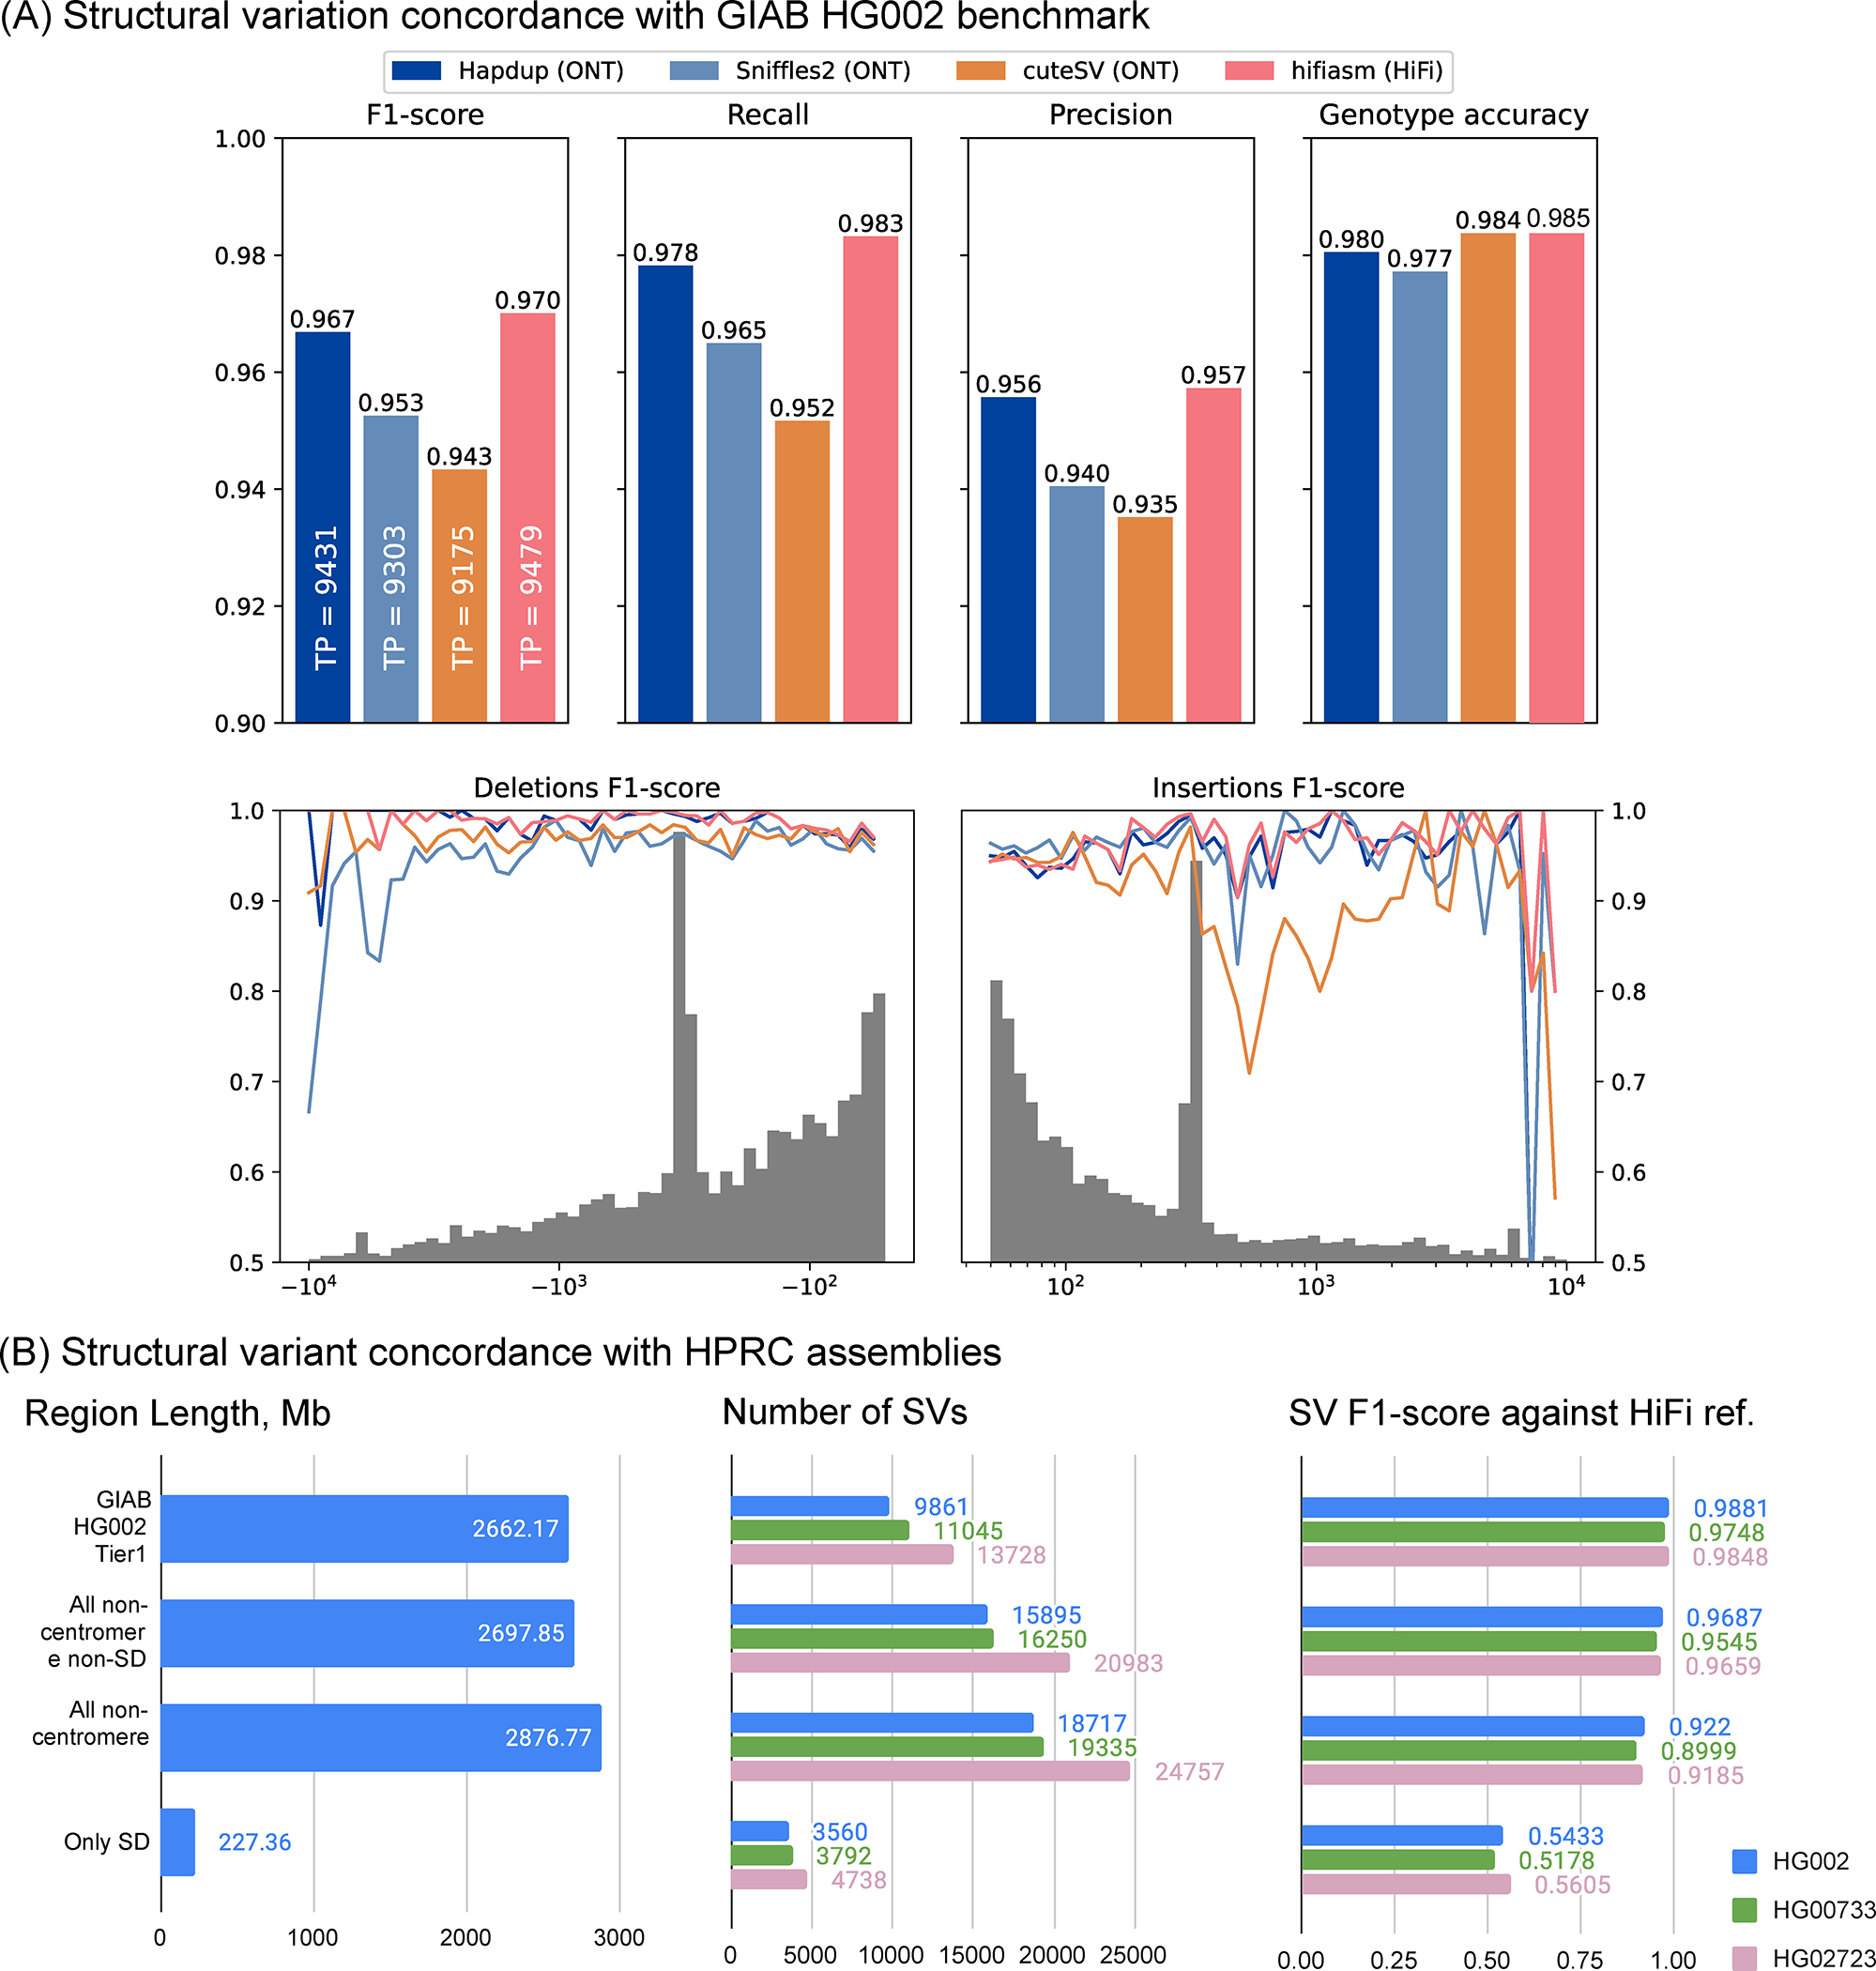
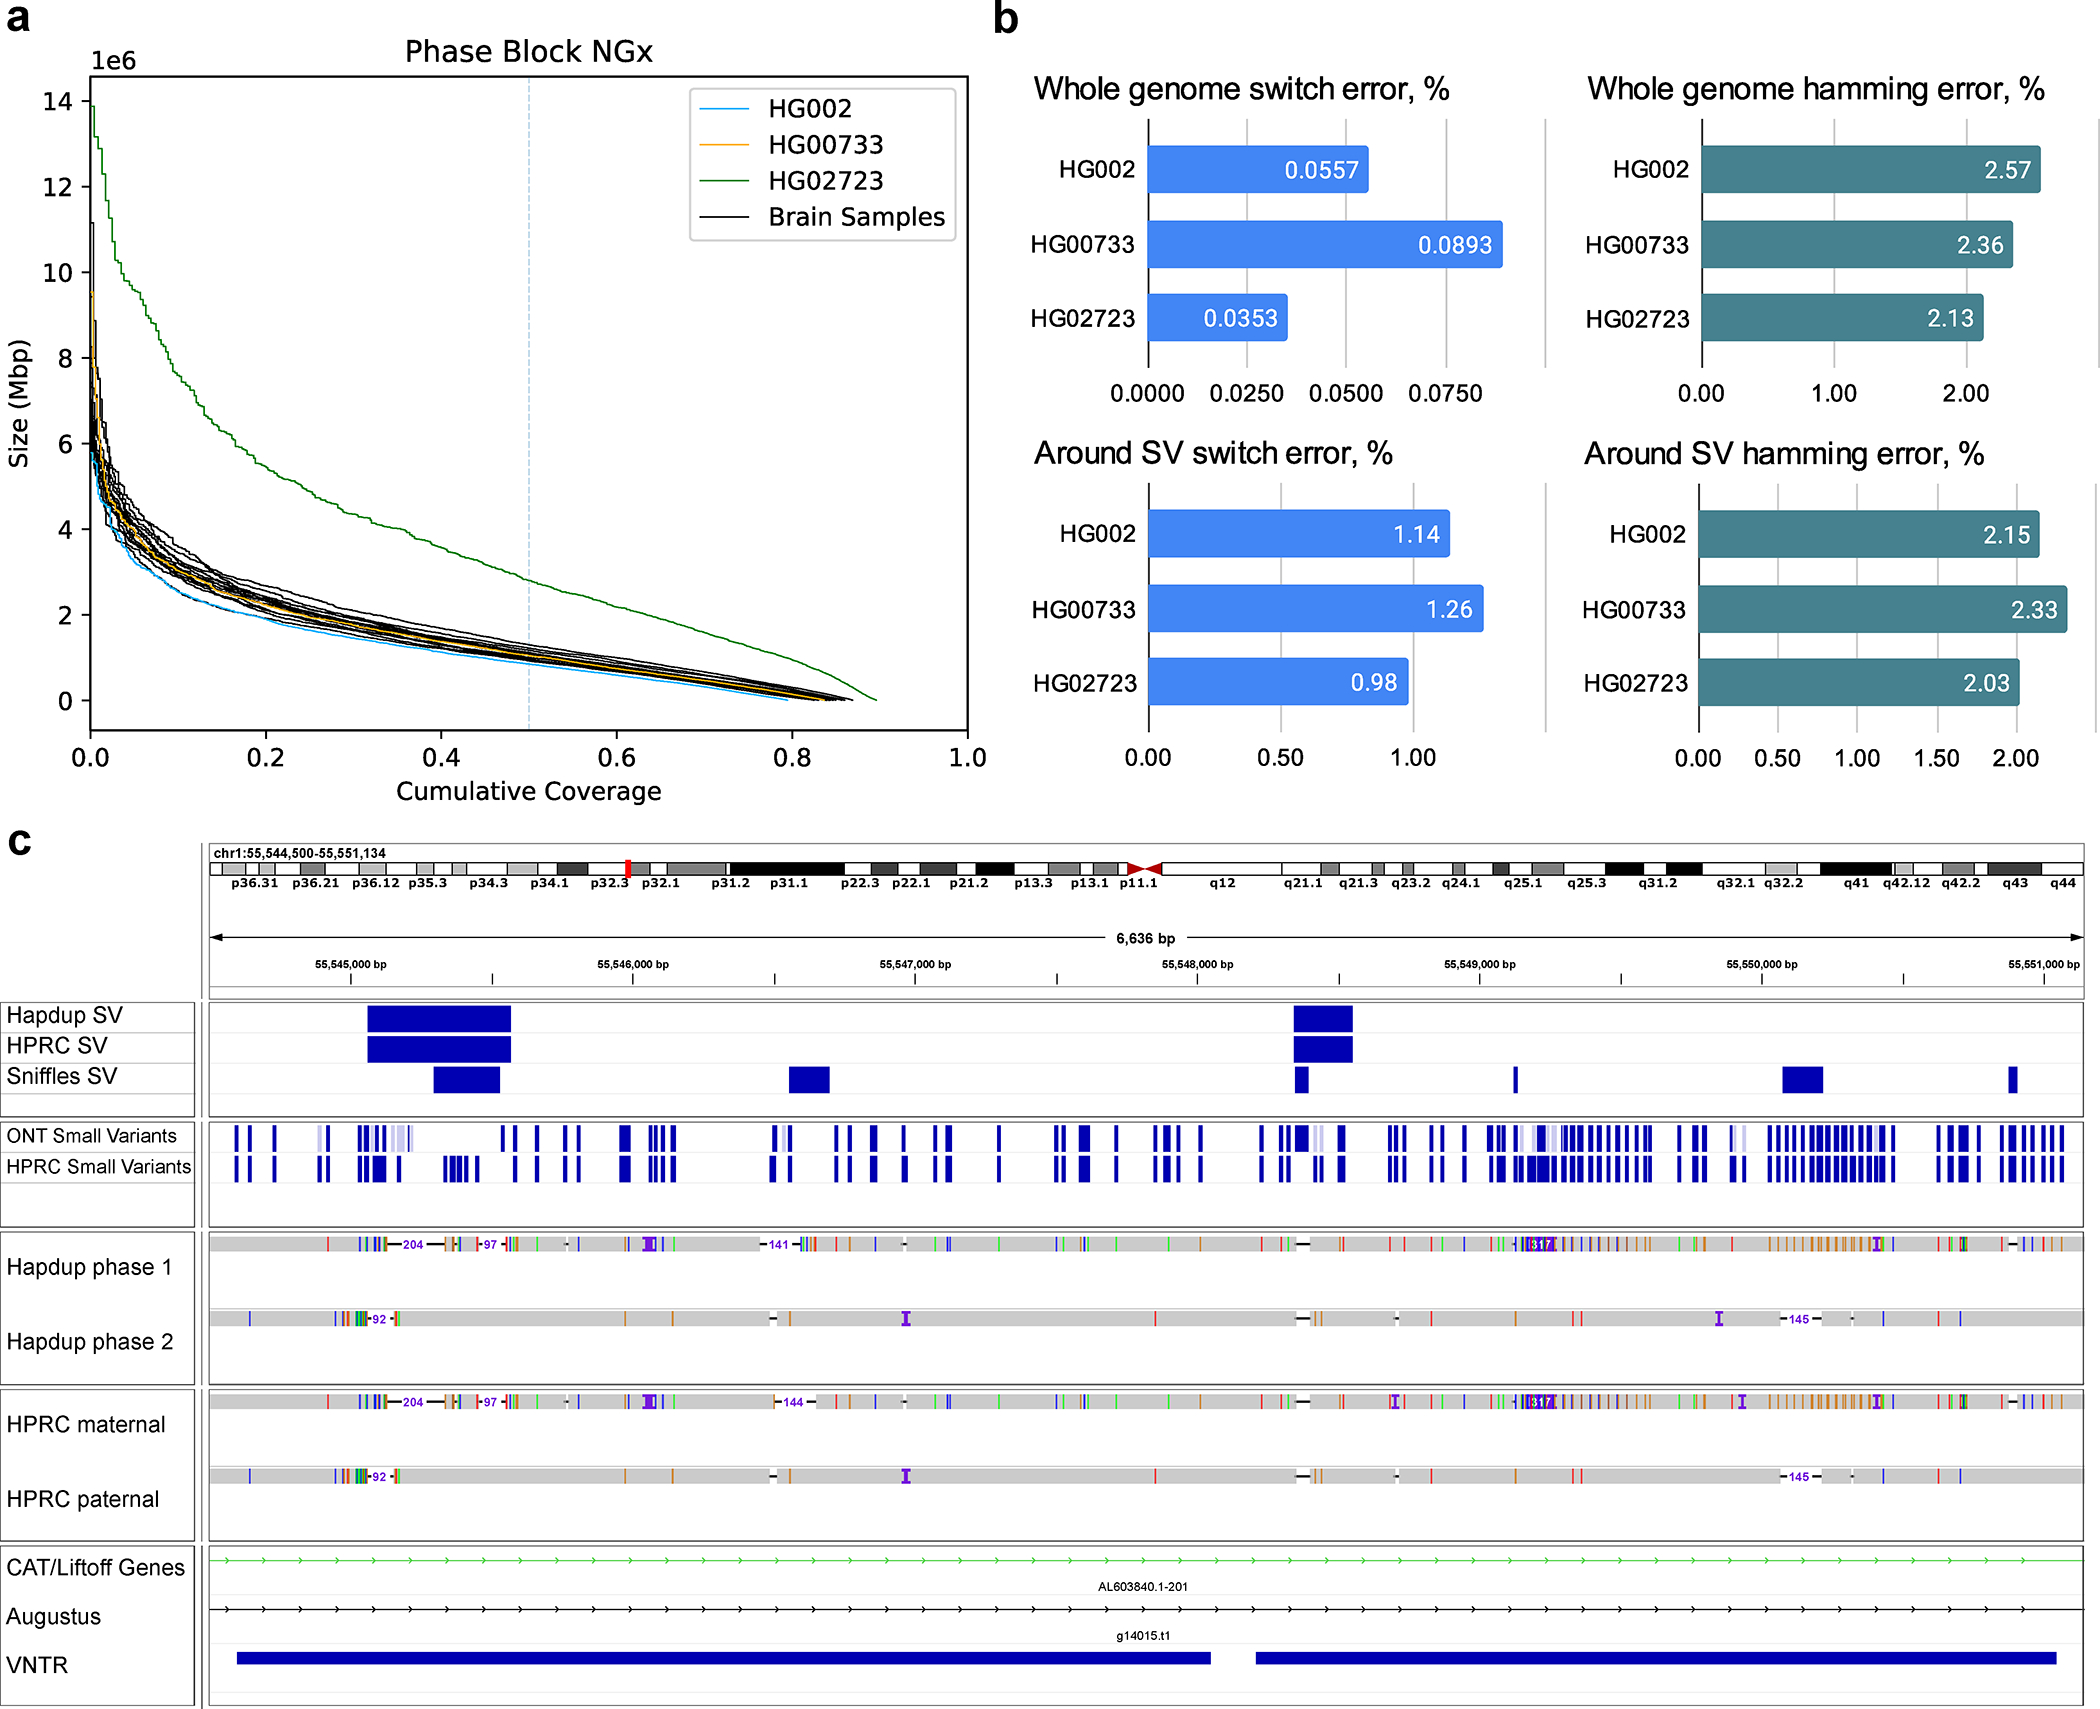
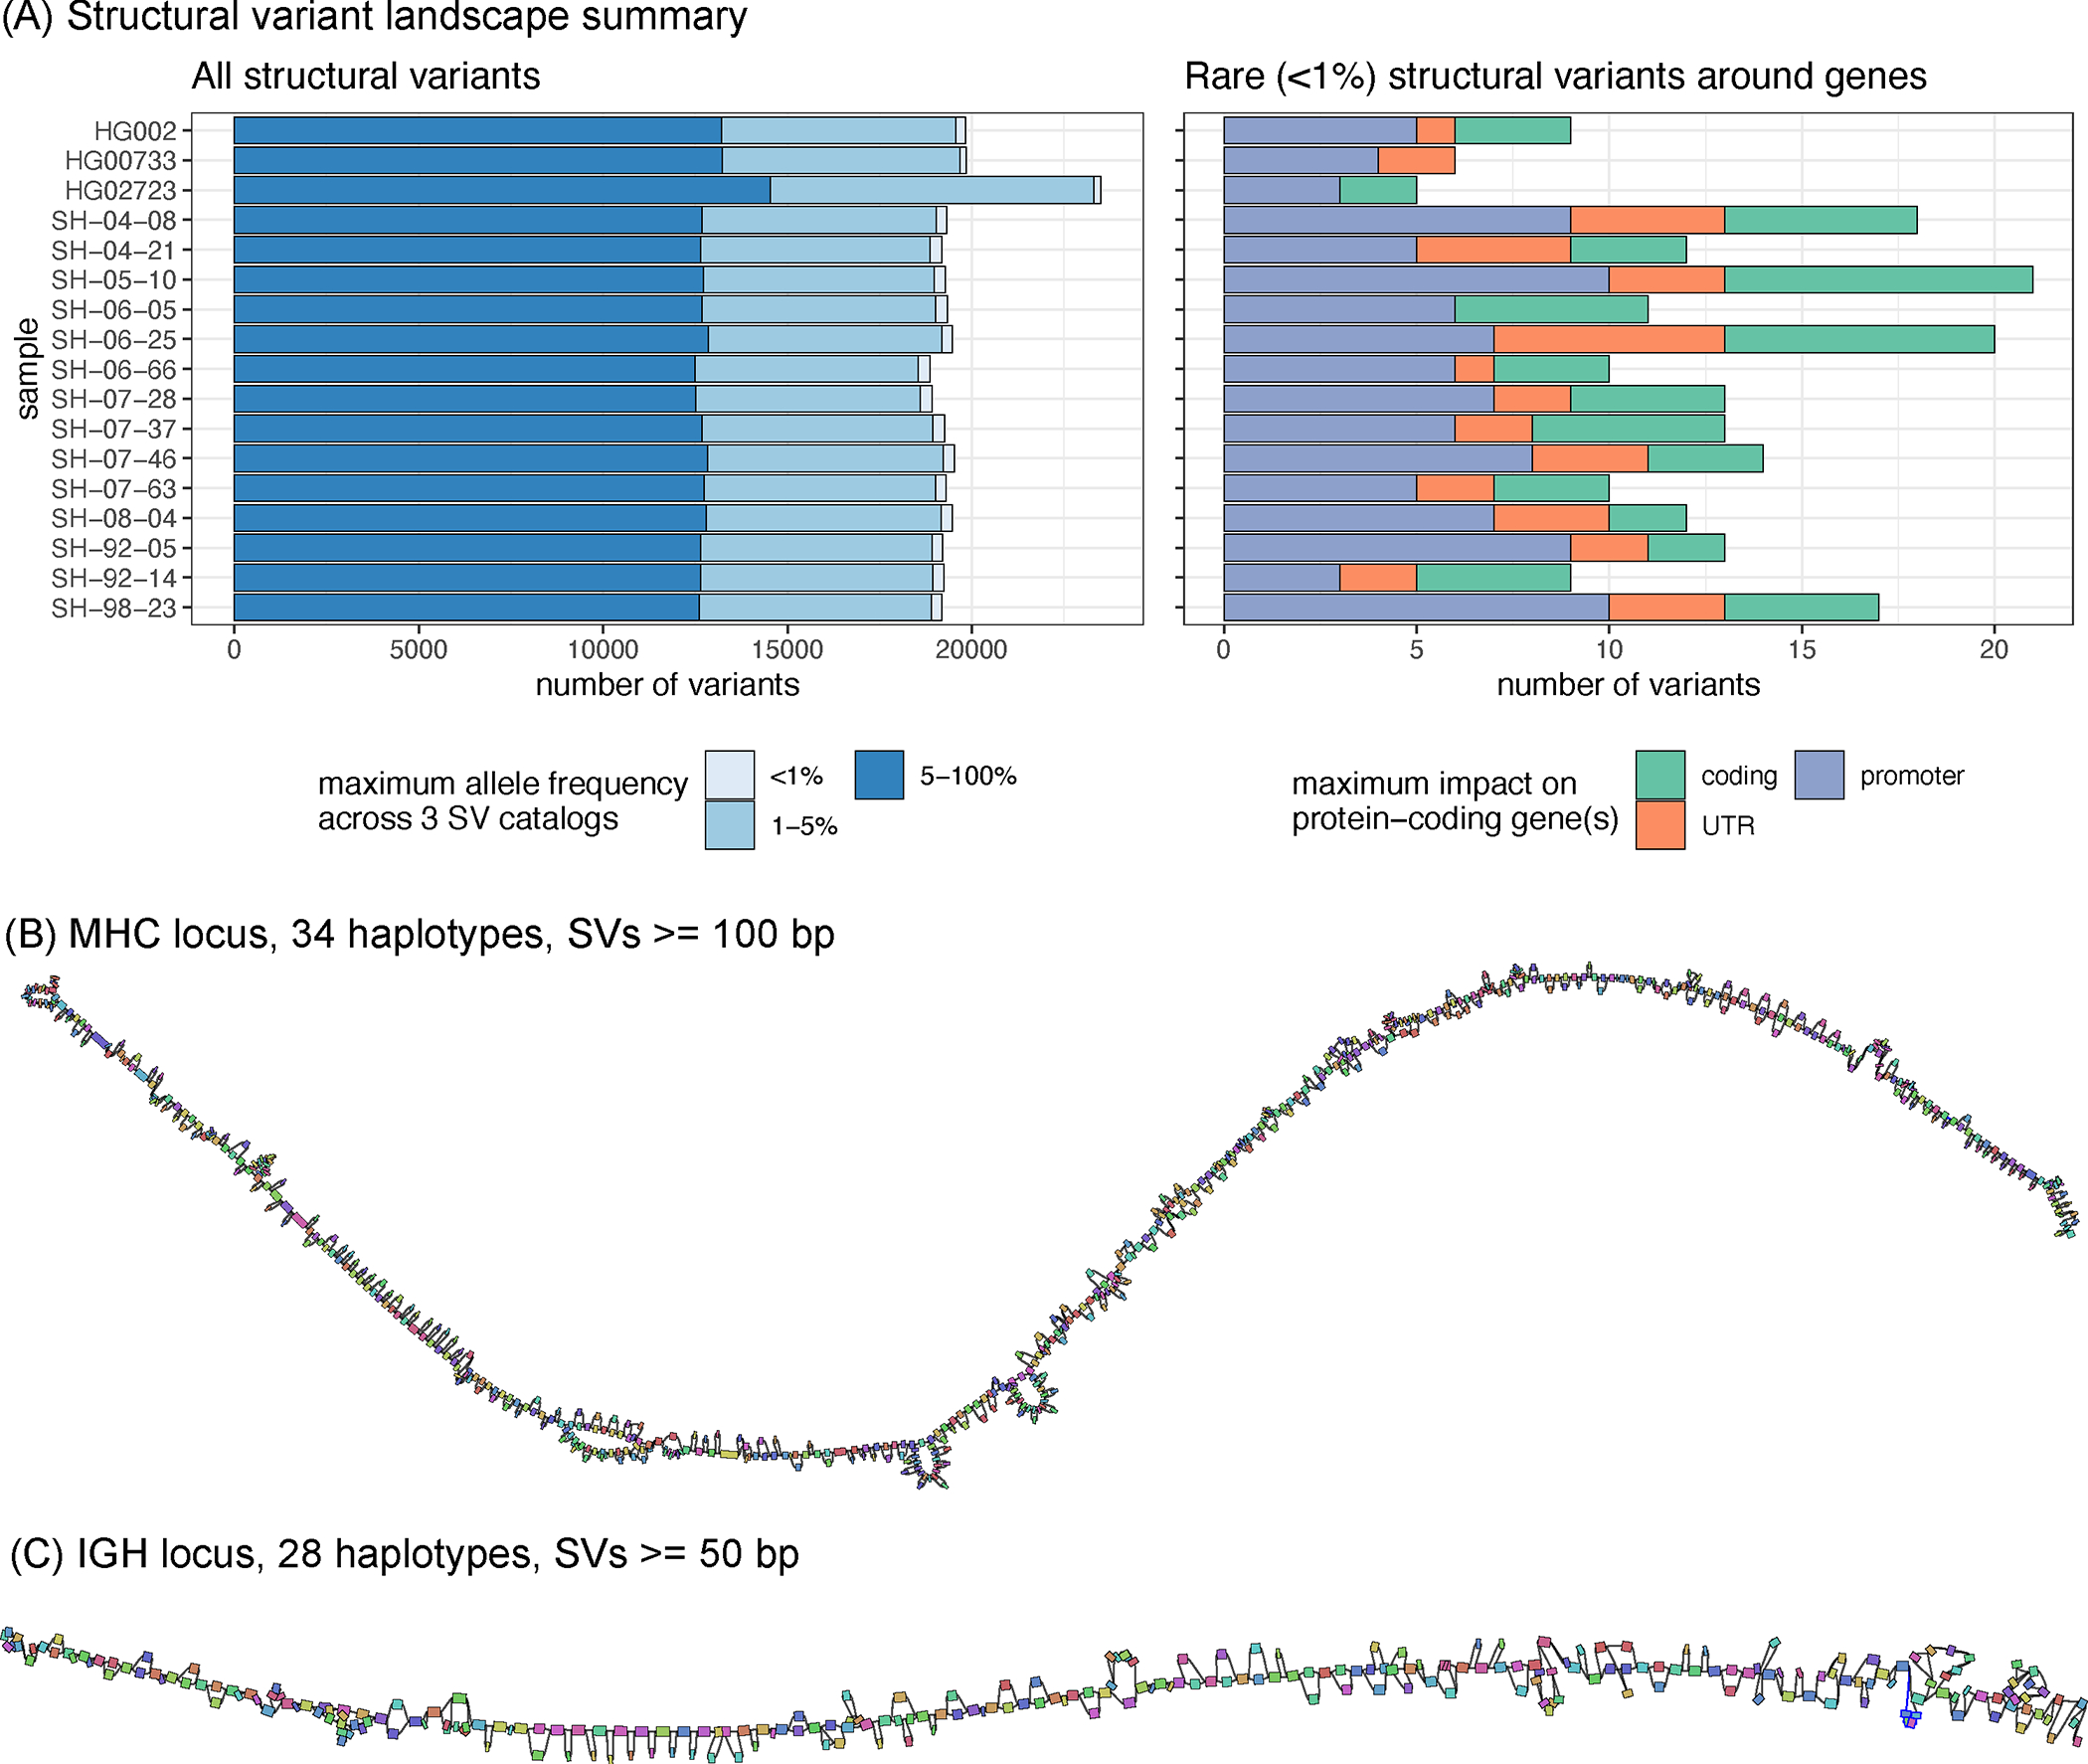
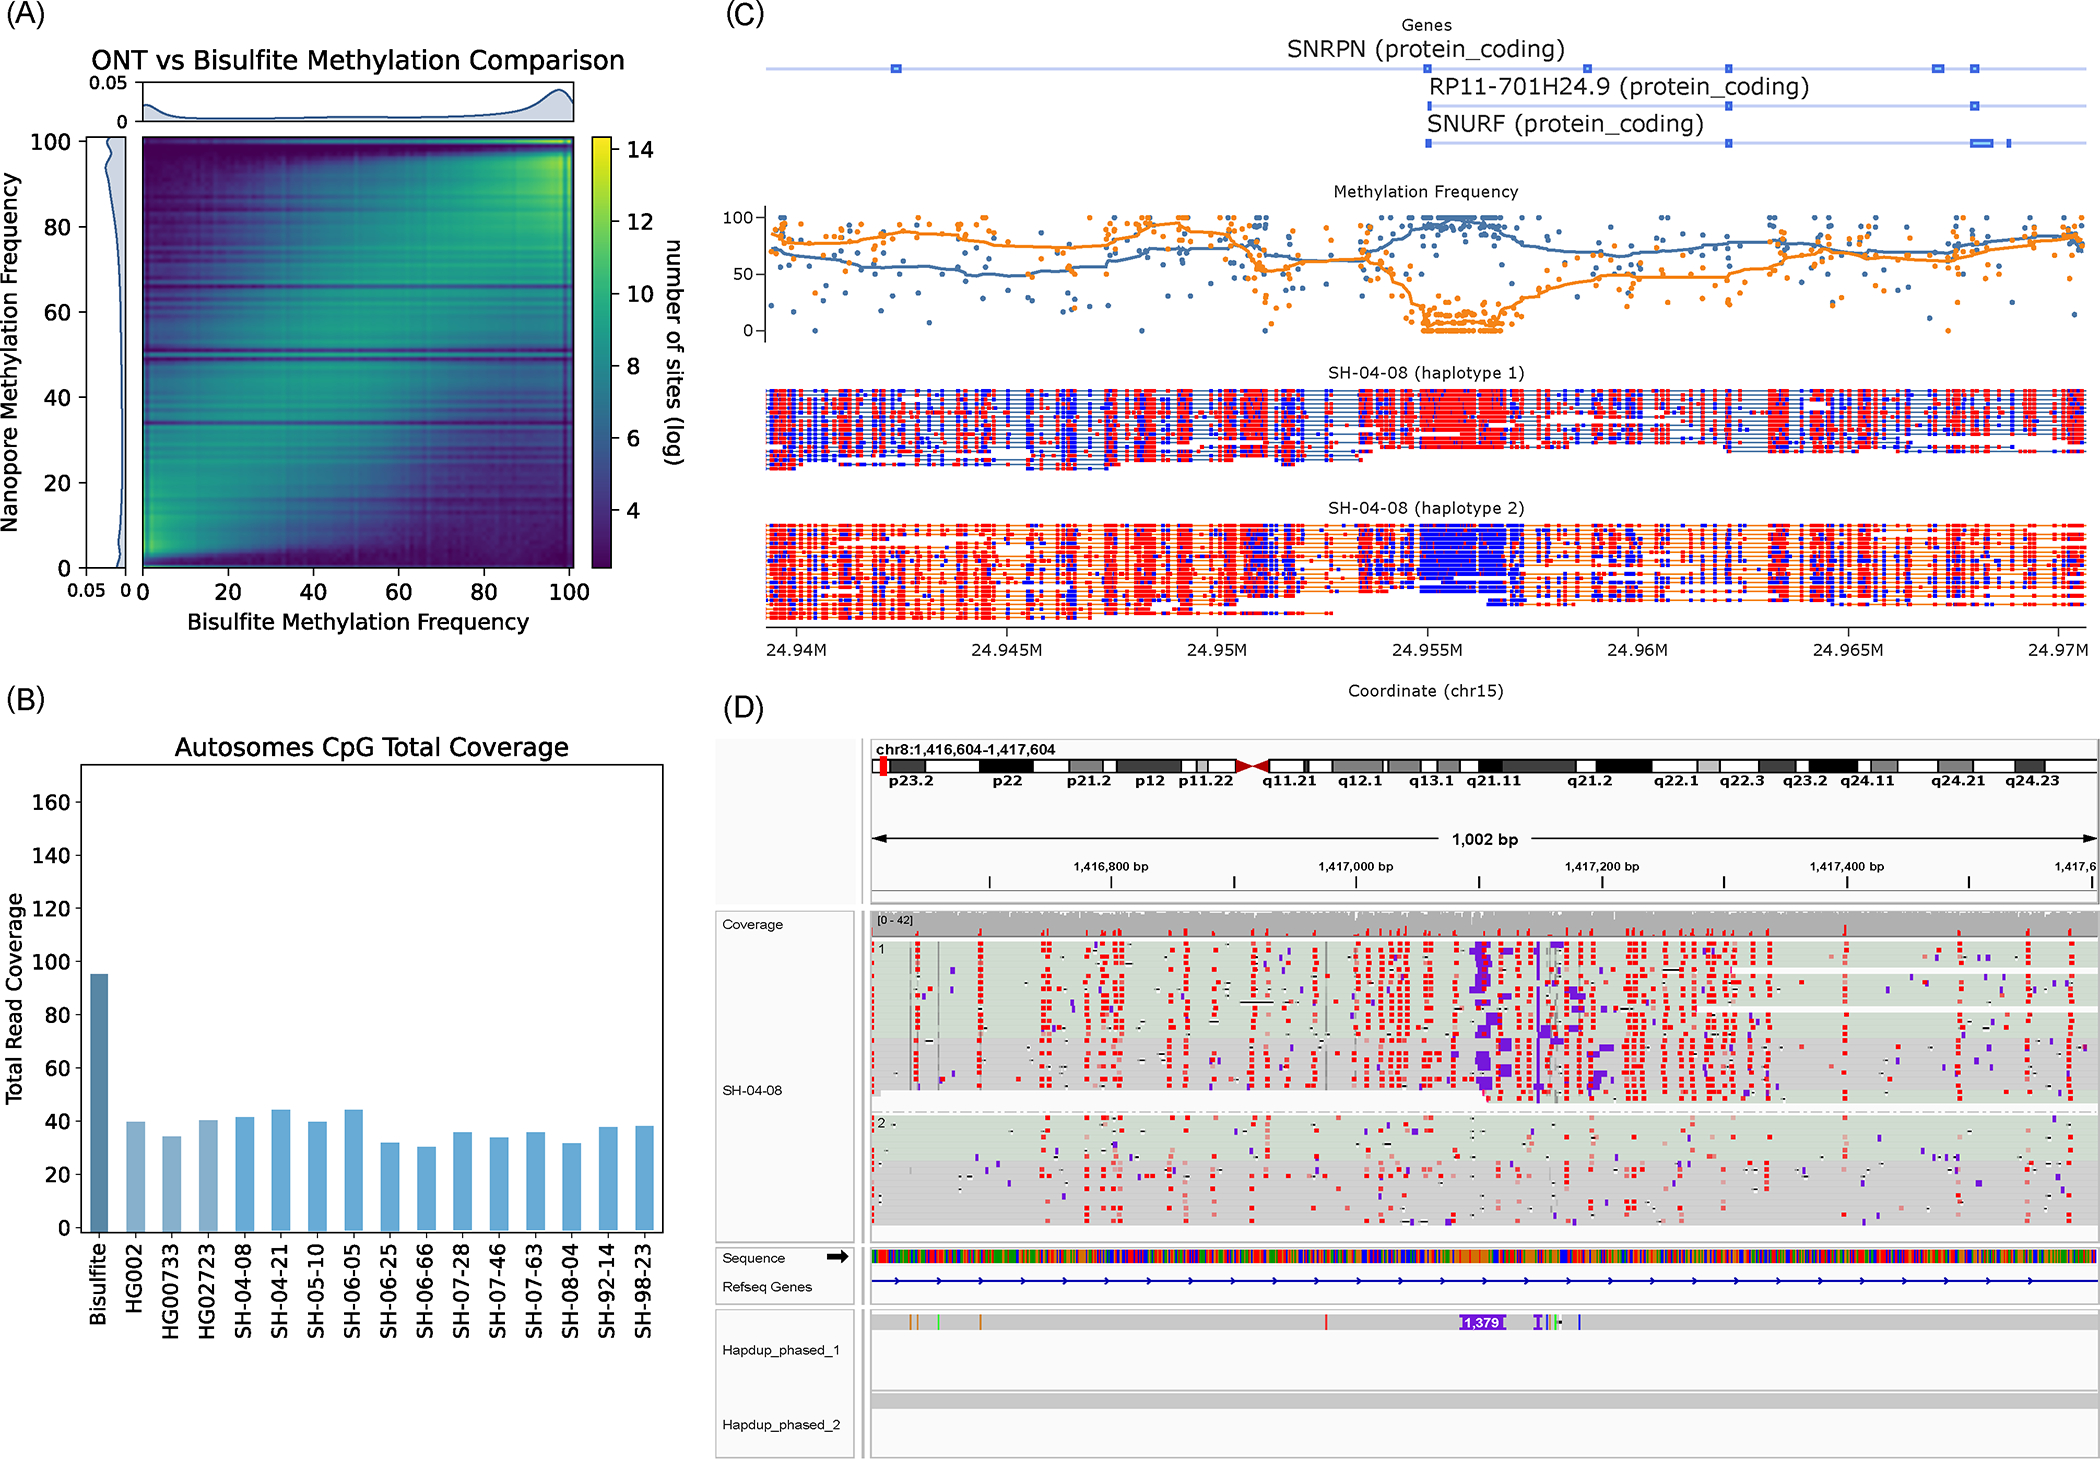
Long-read sequencing technologies substantially overcome the limitations of short-reads but have not been considered as a feasible replacement for population-scale projects, being a combination of too expensive, not scalable enough or too error-prone. Here we develop an efficient and scalable wet lab and computational protocol, Napu, for Oxford Nanopore Technologies long-read sequencing that seeks to address those limitations. We applied our protocol to cell lines and brain tissue samples as part of a pilot project for the National Institutes of Health Center for Alzheimer's and Related Dementias. Using a single PromethION flow cell, we can detect single nucleotide polymorphisms with F1-score comparable to Illumina short-read sequencing. Small indel calling remains difficult within homopolymers and tandem repeats, but achieves good concordance to Illumina indel calls elsewhere. Further, we can discover structural variants with F1-score on par with state-of-the-art de novo assembly methods. Our protocol phases small and structural variants at megabase scales and produces highly accurate, haplotype-specific methylation calls.


Conflict of interest statement

Competing interests. K.S. is an employee of Google LLC and owns Alphabet stock as part of the standard compensation package; authors from Google LLC did not have access to the cell line and brain tissue sample data. WT has two patents (8,748,091 and 8,394,584) licensed to Oxford Nanopore Technologies. F.J.S. received research support from Illumina, Pacific Biosciences and Oxford Nanopore Technologies. S.W.S. serves on the Scientific Advisory Council of the Lewy Body Dementia Association and the Multiple System Atrophy Coalition. S.W.S. and B.J.T. receive research support from Cerevel Therapeutics. B.J.T. holds patents on the clinical testing and therapeutic implications of the C9orf72 repeat expansion. The remaining authors declare no competing interests.

Figures

Extended Data Fig. 1
Extended Data Fig. 1. Variant calling and methylation analysis using Napu.
Raw ONT sequencing reads are basecalled by Guppy 6.1.2, which simultaneously produces methylation tags. A diploid, de-novo phased assembly is produced using a combination of Shasta and Hapdup. These assemblies are used to call SVs with Hapdiff. Small variants are called against a reference genome with Pepper-Margin-DeepVariant. The phased alignment file generated by Margin is used to produce haplotype-resolved methylation calls. Small variants and SVs are jointly phased by Margin, producing a single harmonized vcf.
Extended Data Fig. 2
Extended Data Fig. 2. Assemblies of 14 brain tissues and 3 cell lines generated by Shasta+Hapdup.
(A) NG50 and NGA50 contiguity measured using QUAST. Sample 06_66 had the lowest contiguity due to the decreased sequencing yield. (B) Assembly length. (C) Mean assemblies QV computed using yak. (D) Contiguity of phased blocks, broken at phase switches. An increased value for HG02723 suggests an increased heterozygosity rate. Cell lines marked with asterisks.
Extended Data Fig. 3
Extended Data Fig. 3. Assembly metrics comparison against HG002 assemblies produced in Jarvis et. al (2022).
Our assemblies are highlighted in green. Flye (ONT+trio) were produced using standard ONT reads at 60x coverage and Illumina parental information; Flye (ONT UL + trio) is similar, but using ultra-long ONT extraction. HiCanu and hifiasm used 34x HiFi reads and Illumina parental sequencing. DipAsm used 34x HiFi reads and 60x Hi-C reads. Original evaluations from Jarvis et al. are shown. See Supplementary Table 5 for more detail.
Extended Data Fig. 4
Extended Data Fig. 4. TT-Mars evaluation of Hapdup and Sniffles2 calls.
SV calls from Hapdup and Sniffles2 were compared to the assemblies from the HPRC for HG002 (top), HG00733 (middle), and HG02723 (bottom) with TT-Mars. The calls were either validated by the alignment (green), not validated (orange), or couldn’t be annotated by TT-Mars (blue). We evaluated all SVs across the genome (left), as well as the subset of SVs that don’t overlap centromeres or segmental duplications larger than 10 Kbp (right)
Extended Data Fig. 5
Extended Data Fig. 5. Flagger results based on HiFi alignments to cell line CARD and HPRC-Y1 assemblies.
The y-axis of each panel indicates the unreliability percentages which are the total number of bases flagged as misassembly divided by the total assembly length and multiplied by one hundred.
Extended Data Fig. 6
Extended Data Fig. 6. Flagger results based on ONT alignments to cell line CARD and HPRC-Y1 assemblies.
The y-axis of each panel indicates the unreliability percentages which are the total number of bases flagged as misassembly divided by the total assembly length and multiplied by one hundred.
Extended Data Fig. 7
Extended Data Fig. 7. Lenient SV catalog.
Similar to Fig. 5a but including SVs close to centromeres, telomeres, or within segmental duplications were removed. Number of SVs across samples. In the left panel, SVs were annotated with three SV catalogs (the gnomAD-SV database, a long-read-based SV catalog, and the HPRC v1.0 SV catalog). SVs are matched if they have at least 10% genomic overlap. The colors highlight the maximum frequency across these catalogs, the lighter blue showing ‘rare’ SVs (with an allele frequency below 1%) in the catalogs, or unmatched. SVs may be unmatched, either because they are novel or due to the difficulties in the database comparison. The right panel shows the number of rare SVs in protein-coding genes, grouped by their impact on the gene structure.
Extended Data Fig. 8
Extended Data Fig. 8. IGV view of a 4.2 Kbp heterozygous deletion of a transcription start site and exon of RBFOX1.
The coverage histogram (dark grey) shows the drop in read coverage. The alignment of about half of the reads, labelled by strand (red/blue), support the deletion. The GENCODE track, ENCODE candidate cis-regulatory elements, and conservation tracks are shown at the bottom.
Extended Data Fig. 9
Extended Data Fig. 9. Comparison of R9 and R10 sequencing runs using three cell lines.
Benchmarks were performed similarly to those described in Figs. 2–4. ‘Indel no HP/TD’ corresponds to indels outside of homopolymers and tandem repeats. Assembly SV F1 scores were computed outside of centromeres and segmental duplications. Additional statistics are given in Supplementary Table 13.
Extended Data Fig. 10
Extended Data Fig. 10. F1-score for SV inside clusters of different sizes.
The HiFi calls for HG002 genome were used as reference, and calls within 2 kbp were clustered using single linkage clustering. The number of true positive calls in each category is shown as text. When VNTR grouping is enabled, all insertions and deletions within the same haplotype in a single VNTR are combined into a single call. A substantial portion of the reduced Sniffles2 concordance is explained by the differences in representation of SV clusters by the assembly-based and mapping-based approaches.
Figure 1.
Figure 1.. Single flow cell Oxford Nanopore Technologies (ONT) sequencing protocol.
(Left) Overview of the sequencing protocol, indicating all processes from DNA extraction to sequencing. In brief, the DNA is extracted using a Kingfisher Apex instrument using the Nanobind Tissue Big DNA kit. The DNA is then sheared on a Megaruptor3 instrument, and libraries are constructed using an SQK-LSK 110 kit and sequenced on a PromethION for 72 hours. Panel was created using BioRender.com. (Right) from left-to-right: total sequenced bases / haploid human genome coverage (assuming a 3.1GB genome) from PASS reads (with estimated QV>=10) for each sample. The vertical dotted line marks the average yield across samples. Read length N50 of PASS reads, i.e., the read length (y-axis) such that reads of this length or longer represent 50% of the total sequence. The vertical dotted line marks the average N50 across samples. Distribution of PASS read identities when aligned to T2T-CHM13 v2.0. The dots mark the median identity in each sample, and the vertical dotted line is the average across samples. Source data is available at Supplementary Table 1.
Figure 2.
Figure 2.. Small variant calling performance evaluation.
Number of false positive, false negative, and true positive small variant calls made by PEPPER-Margin-DeepVariant (PMDV) using either ONT reads or DeepVariant using Illumina reads. (A) SNP performance, stratified by genomic regions mappability. (B) SNP performance, stratified by homopolymer context. (C) INDEL performance stratified by homopolymers and tandem repeats context. F1-scores are reported on top of the true positive bars. Statistics computed against the Genome in a Bottle v4.2.1 benchmark for HG002; for other cell lines (HG00733, HG02723) small variant calls generated by DeepVariant with HiFi reads are used. Source data is available at Supplementary Table 3.
Figure 3.
Figure 3.. Structural variant evaluations.
(A) Recall, precision and F1-scores computed for various tools and sequencing technologies with Genome in a Bottle Tier1 v0.6 benchmark as reference (defined on HG002). The gray histogram shows the distribution of SV sizes in the reference set. F1-scores computed for various SV size bins. (B) Structural variation call concordance with HiFi-based assemblies for various regions of the genome. Source data is available at Supplementary Tables 6–7.
Figure 4.
Figure 4.. Combined, phased small and structural variants improve the profiling of complex genomic regions.
(A) Variant phasing evaluation. Left plot shows the phased block NGx, reported by Margin. HG02723 has an increased phase block length due to higher heterozygosity. (B) SNP hamming and switch error computed against the small variants in HiFi-based assemblies. Evaluations are also shown for a subset of SNPs that are within 100 bp of structural variants (C) An example of a Hapdup and hifiasm representations of complex clusters with small and structural variants at chr1:55,544,500–55,551,000 (in CHM13 reference), visualized using IGV. Top tracks show phased SNPs and SVs produced by Napu and derived from HPRC assemblies (using dipcall). A few inconsistencies between SNP positions are explained by ambiguities between read and contig alignments around SV sites. Source data is available at Supplementary Table 10.
Figure 5.
Figure 5.. Structural variant landscape summary.
(A) The number of structural variants across samples. In the left panel, structural variants were annotated with three SV catalogs (the gnomAD-SV database, a long-read-based SV catalog, and the HPRC v1.0 SV catalog). SVs are matched if they have at least 10% genomic overlap. SVs close to centromeres, telomeres, or within segmental duplications were removed. The colors highlight the maximum frequency across these catalogs, the lighter blue showing “rare” SVs (with an allele frequency below 1%) in the catalogs, or unmatched. SVs may be unmatched, either because they are novel or due to the difficulties in the database comparison. The right panel shows the number of rare structural variants in protein-coding genes, grouped by their impact on the gene structure. (B) MHC pangenome built from 28 brain and 6 cell line haplotypes, containing 640 nodes, SVs over 100bp are shown. (C) IGH pangenome built from 28 brain haplotypes containing 268 nodes. Pangenome graphs were visualized using Bandage. Each graph node represents an allele, and two nodes are connected if the corresponding alleles are linked in at least one of the haplotypes. Colors are assigned at random. Nodes are randomly laid out along the reference coordinates. Source data is available at Supplementary Table 11.
Figure 6.
Figure 6.. Haplotype-specific methylation profiling.
(A) Heatmap of concordance between Bisulfite whole genome sequencing and ONT Remora Methylation calls in HG002 at sites shared by both technologies covered by at least 5 reads. The lower coverage of ONT data causes striping in the heatmap at specific frequencies. (B) Read depth of Bisulfite and ONT samples. CpG sites are one position apart in the sense and antisense DNA strands due to C-G base pairing. Since this read coverage is counted per CpG location the actual coverage was doubled to account for the neighboring strand locations and estimate actual genome wide coverage. (C) An example of differential methylation pattern in the SNRPN locus in the brain sample SH-04–08. Red CpG sites are methylated and blue sites are unmethylated. Above the reads is a plot of methylation frequency and gene locations, visualized using modbamtools (D) IGV visualization of phased methylated ONT reads and the phased assemblies of brain sample SH-04–08 at the DLGAP2 gene locus that shows a 1,379 base pair insertion that is differentially methylated across haplotypes. Source data is available at Supplementary Table 12.

Update of

References

    1. DePristo MA et al. A framework for variation discovery and genotyping using next-generation DNA sequencing data. Nat. Genet. 43, 491–498 (2011). - PMC - PubMed
    1. 1000 Genomes Project Consortium et al. An integrated map of genetic variation from 1,092 human genomes. Nature 491, 56–65 (2012). - PMC - PubMed
    1. 100,000 Genomes Project Pilot Investigators et al. 100,000 Genomes Pilot on Rare-Disease Diagnosis in Health Care - Preliminary Report. N. Engl. J. Med. 385, 1868–1880 (2021). - PMC - PubMed
    1. Karczewski KJ et al. The mutational constraint spectrum quantified from variation in 141,456 humans. Nature 581, 434–443 (2020). - PMC - PubMed
    1. Huang K-L et al. Pathogenic Germline Variants in 10,389 Adult Cancers. Cell 173, 355–370.e14 (2018). - PMC - PubMed

Publication types