. 2023 Dec;15(12):1754-1764.
doi: 10.1038/s41557-023-01319-6. Epub 2023 Sep 14.

Protein-lipid charge interactions control the folding of outer membrane proteins into asymmetric membranes

Affiliations

Protein-lipid charge interactions control the folding of outer membrane proteins into asymmetric membranes

Jonathan M Machin et al. Nat Chem. 2023 Dec.

Abstract

Biological membranes consist of two leaflets of phospholipid molecules that form a bilayer, each leaflet comprising a distinct lipid composition. This asymmetry is created and maintained in vivo by dedicated biochemical pathways, but difficulties in creating stable asymmetric membranes in vitro have restricted our understanding of how bilayer asymmetry modulates the folding, stability and function of membrane proteins. In this study, we used cyclodextrin-mediated lipid exchange to generate liposomes with asymmetric bilayers and characterize the stability and folding kinetics of two bacterial outer membrane proteins (OMPs), OmpA and BamA. We found that excess negative charge in the outer leaflet of a liposome impedes their insertion and folding, while excess negative charge in the inner leaflet accelerates their folding relative to symmetric liposomes with the same membrane composition. Using molecular dynamics, mutational analysis and bioinformatics, we identified a positively charged patch critical for folding and stability. These results rationalize the well-known 'positive-outside' rule of OMPs and suggest insights into the mechanisms that drive OMP folding and assembly in vitro and in vivo.


Conflict of interest statement

The authors declare no competing interests.

Figures
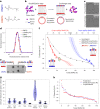
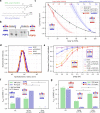
Fig. 1
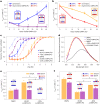
Fig. 1. Generating and validating asymmetric LUVs.
a, Head group structures of the DMPC and DMPG lipids. The same colour code is used throughout. b, Overview of asymmetric liposome generation by MβCD-mediated exchange. c, Pre- and post-exchange liposomes imaged by cryoEM. The liposomes are smaller than observed using DLS as small liposomes preferentially move into the ice. d, Pre- and post-exchange liposome size by DLS. e, Sample TLC plate showing the introduction of the DMPC lipid into DMPG liposomes by CD-mediated exchange, and vice versa. Outer two lanes, DMPC (left) and DMPG (right) liposomes before exchange; inner two lanes, exchanging DMPC into DMPG liposomes (left) and DMPG into DMPC liposomes (right). f, ζ-Potential by lipid content for symmetric (black line) and asymmetric liposomes DMPC/PG and DMPG/PC. The theoretical asymmetry lines are shown with an error margin of 10% (shaded region). The generated asymmetric liposome samples (DMPC/PG, blue; DMPG/PC, red) show range bars from repeat ζ-potential measurements (the centre is the mean average, n ≥ 3). The green-circled measurement is discussed in the text. g, Feature importance (gain per feature per split) in the liposome ζ-potential model. The bars represent the data minima, median and maxima (n = 50). h, Agreement between predicted and experimental ζ-potential values (errors are shown as range bars, with n ≥ 3) for DMPC/PG LUVs in buffer solution (100 mM NaCl, 20 mM Tris-Cl, pH 8.5). Source data
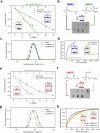
Fig. 2
Fig. 2. DMPC-DMPG lipid asymmetry significantly affects OMP folding rates.
a, Folding rate constants (s−1) of OmpA into a-DMPG/PC asymmetric liposomes compared with symmetric liposomes with the same outer leaflet composition. The bars represent data ranges (n ≥ 3); the asterisks indicate that the folding had not reached completion after 15 h (<75% folded). b, Folding rate constants (s−1) of OmpA into a-DMPC/PG asymmetric liposomes compared with symmetric liposomes with the same outer leaflet composition. The bars represent data ranges (n ≥ 3). c, Urea dependence of OmpA folding into DMPC-DMPG symmetric and asymmetric liposomes. The lines are fits to the average of at least two repeats; the bars represent the data range. d, Tryptophan fluorescence emission spectra of OmpA folded into LUVs of different composition show that the protein does not unfold after overnight incubation at 30 °C in 8 M urea in any liposome. The spectrum of OmpA unfolded in 7.5 M urea in the absence of lipid is shown for comparison. e,f, Observed folding rate constant (s−1) of OmpA and BamA into DMPC (e) and DMPG (f) and corresponding asymmetric and symmetric liposomes, demonstrating similar trends for the two proteins in each liposome type (individual data points shown as dots). For ~20% a-DMPG/PC, the folding was not complete (<75% folded) after 15 h and hence a rate constant could not be determined (Methods). Significance levels (left to right): *P = 0.029 and 0.015 in e and *P = 0.029 and 0.029 in f, determined by permutation testing (Supplementary Table 11). Source data
Fig. 3
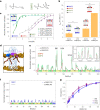
Fig. 3. OmpA–lipid charge interactions modulate OmpA folding kinetics and efficiency.
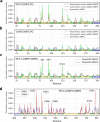
a, Structures of the DMPE and DMPS head groups, charge analogues of DMPC and DMPG. The same colour code is used throughout. b, OmpA folding rate constants (s−1) into a-DMPS/PC or a-DMPE/PG LUVs and the equivalent symmetric liposomes (with the same outer leaflet content). For ~20% a-DMPS/PC, the folding had not reached completion after 15 h (<75% folded). Significance levels: *P = 0.029, determined by permutation testing (Supplementary Table 11). c, Urea dependence of OmpA folding into DMPS/PC or DMPE/PG symmetric and asymmetric liposomes. The lines are fits to the average of at least two repeats; the bars represent the data range. For 20% a-DMPS/PC, the line has been added to guide the eye, but the amplitude change was too low to accurately fit. d, Final frame of a CG-MD simulation of native OmpA in s-DMPG:DMPC membranes, showing two DMPG molecules (red) in the outer leaflet interacting with OmpA at Arg81, Lys94 and Arg124. e, Normalized contact count (number of interactions between each type of lipid and each protein residue normalized by lipid concentration and simulation frame number) between residues in the transmembrane region of OmpA and the negatively charged lipids DMPG or DMPS. Inset: expanded views of the peaks around the three lipid-interacting residues Arg81, Lys94 and Arg124. f, Normalized contact count for interactions between the transmembrane region of OmpA and the zwitterionic lipids DMPC or DMPE. The contact numbers are averages of five replicates. In e and f, the secondary structure of the OmpA β-barrel is shown below the contact count (green, strands; yellow, extracellular loops; red, intracellular turns; blue, 14 residues of the periplasmic soluble domain). g, DMPG occupancy (fraction of time that DMPG interacts with Arg81, Lys94 or Arg124) at different ratios of DMPC:DMPG, determined from the lipid residence time. The data for five replicates are shown. Source data
Fig. 4
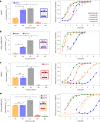
Fig. 4. Folding kinetics and stability of OmpA charge variants compared with OmpA-WT for symmetric and asymmetric lipid environments.
ad, The relative folding rate constants (normalized to WT) (left) and urea titration stability curves (right) measured using cold SDS–PAGE for OmpA variants in DMPC (significance levels: WT–NN, *P = 0.008; WT–NP, *P = 0.018) (a), ~10% a-DMPG/PC (the fits for OmpA-NP and OmpA-M3 in urea are included to guide the eye, but the stability was too low to accurately fit the data; significance levels: WT–NN, *P = 0.029; WT–NP, *P = 0.014) (b), DMPG (significance levels: WT–NN, nsP = 1.0; WT–NP, *P = 0.008) (c) and ~20% a-DMPC/PG (significance levels: WT–NN, nsP = 0.829; WT–NP, *P = 0.029) (d). In a and b, the folding of OmpA-M3 (a) and OmpA-NP and OmpA-M3 (b) had not reached completion after 2 h (<75% folded). The OmpA-NC fraction folded at 3.5 M urea was excluded from the fit in d. All P values were determined by permutation testing (see Supplementary Tables 2–8 for the P values of the comparisons described in the text, and Supplementary Tables 11 and 12 for all pairwise tests of significance); ns, no significant difference. Source data
Fig. 5
Fig. 5. Folding kinetics and stability of OmpA-NN and OmpA-NP.
a, Non-normalized folding rate constants for OmpA-NN (left) and OmpA-NP (right) into symmetric and asymmetric liposomes, demonstrating the different patterns of folding rate observed for the different OmpA charge variants. The folding of OmpA-NP had not reached completion after 2 h in the s-DMPC:PG 90:10 and a-DMPG/PC liposomes (<75% folded). Note the different y-axis scales in the two plots. Significance levels: *P = 0.029, determined by permutation testing (Supplementary Table 9). b, Pm values for the folding of OmpA-NN (left) and OmpA-NP (right) into symmetric and asymmetric liposomes in urea solutions. There was insufficient folding of OmpA-NP into 90:10 s-DMPC:PG to allow a fit. The error bars represent the goodness of fit to the data shown in Fig. 4 (the standard deviation of the Pm values was estimated from the covariance of fitted parameters); the bar heights are the fitted parameter values. Significance levels (from left to right): nsP = 0.423) and *P = 0.020 for OmpA-NN, and *P = 0.031 and 0.016, determined by a two-tailed paired t-test (Supplementary Table 10). Source data
Fig. 6
Fig. 6. Localised positive charge enrichment of OMP residues.
a,b, OMP residue enrichment perpendicular to the membrane plane shows conserved enrichment of positively charged residues in the extracellular loops ~8 Å from the membrane surface. a, Residue enrichments of aligned OMPs from the OPM database (experimentally solved structures) relative to the probability of finding an amino acid randomly, calculated over the whole protein sequence. The membrane thickness is the average of all OPM structures. b, Residue enrichments of Lys and Arg in the extracellular loops of OMPs relative to the probability of finding an amino acid from the soluble regions of the protein sequence, calculated from proteins in the OPM database (that is, transmembrane residues have been omitted from this analysis). Source data
Extended Data Fig. 1
Extended Data Fig. 1. Combining experiments, simulations and bioinformatics to reveal how charge patterning in OMP loops and membrane asymmetry synergise for productive folding and stability.
Following generation of charge asymmetric liposomes (depicted here by red and blue headgroups), OMP folding kinetics (top left, measured by Trp fluorescence) and stability (bottom left, measured by cold SDS PAGE) of two model OMPs, OmpA and BamA (green and yellow space fill structures) were measured and compared with the results for the same lipids in symmetric membranes (not shown). Molecular dynamics of OMPs pre-folded into different lipid systems (top right), as well as structural and sequence bioinformatics (bottom right) for 300 and 19000 OMPs, respectively (six are depicted) were then used to identify residues involved in the modulation of folding rates and stabilities upon interaction with the lipid head group.
Extended Data Fig. 2
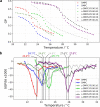
Extended Data Fig. 2. Global lipid phase transition behaviour for liposomes used in this study, measured using laurdan fluorescence.
(a) The GP (generalised polarisation) ratio of fluorescence at 440 and 490 nm (see Methods) against temperature for pure DMPC and pure DMPG liposomes, and symmetric DMPS-DMPC, DMPE-DMPG and DMPE-DMPC lipid mixes, as indicated, measured using 0.25 °C intervals. (b) The first derivative of the GP, with the implied Tms. Source data
Extended Data Fig. 3
Extended Data Fig. 3. Example kinetic data and fits with representative lipid environments for folding of OmpA and BamA.
Sample kinetic data shown for (a) OmpA and (b) BamA folding into DMPC, DMPG and 20% symmetric and asymmetric liposomes. Data are normalised for comparison, folding into ~20% a-DMPG/PC did not reach completion for either OmpA or BamA and these data were normalised to their respective DMPC traces. Source data
Extended Data Fig. 4
Extended Data Fig. 4. Generating and folding OmpA into POPG-POPC symmetric and asymmetric liposomes.
(a) Acyl-chain structure of DM- and PO-lipids. (b) Sample TLC plate showing the introduction of POPC lipid into POPG liposomes and vice versa, as indicated. Outer two lanes, POPC (left) or POPG (right) liposomes before exchange; inner two lanes, exchanging POPG into POPC liposomes (left) or POPC into POPG liposomes (right). (c) Experimentally measured ζ-potential calibration curve for asymmetric and symmetric POPC-PG lipid mixes, showing symmetric (black crosses) and asymmetric liposomes (red and blue crosses). Error bars are data range (n ≥ 3). (d) Liposome size measured by DLS. (e) Urea dependence of OmpA folding into POPC-PG symmetric and asymmetric liposomes. POPG and a-POPC/POPG are fitted to the average of two repeats, all other lines are to guide the eye only as there is insufficient amplitude to enable a fit (bars show the data range of two repeats). (f, g) Observed folding rate constant (s−1) of OmpA into asymmetric and symmetric liposomes made of DM- or PO-acyl chained lipids, as indicated, demonstrating similar trends to those using DM-lipids for all membrane types (compare with Fig. 2e,f). * Indicates the folding was not complete (<75% folded) in 15 hours and hence a rate constant could not be determined. Significance labels (*) p-values = 0.029, determined by permutation testing (see Supplementary Table 11). Source data
Extended Data Fig. 5
Extended Data Fig. 5. Generating asymmetric DMPS/DMPC and DMPE/DMPG liposomes.
(a) Experimentally measured ζ-potential calibration curve for symmetric (black) and asymmetric DMPS-DMPG lipid mixes (green) for DMPS concentrations in the outer leaflet of 0–25%. Error bars are data range (n ≥ 3). (b) TLC of duplicate ~20% a-DMPS/DMPC exchanged (central two samples) and DMPC (left) or DMPS (right) liposomes. (c) DLS of pre-exchange DMPC and duplicate post-exchange DMPS/DMPC liposomes. (d) Example OmpA folding kinetic traces, measured by tryptophan fluorescence into 20% s-DMPS:DMPC (double exponential kinetic fit, blue line) and ~20% a-DMPS/DMPC (note that the latter sample did not complete folding (<30% folded over >15 hours, not fitted). (e) Experimentally measured ζ-potential calibration curve for asymmetric DMPE-DMPG lipid mixes (grey) for DMPE fractions 0–30% in the outer leaflet. Data for symmetric liposomes are shown in black. Error bars are data range (n ≥ 3). (f) TLC of duplicate ~20% a-DMPE/DMPG exchanged liposomes (central two lanes), with DMPG (left) and DMPE (right) unexchanged liposomes. (g) DLS of pre-exchange DMPG and duplicate post-exchanged a-DMPE/DMPG liposomes. (h) Example OmpA folding kinetic traces, measured by tryptophan fluorescence into 20:80 s-DMPE:DMPG (kinetic fit: yellow line) and ~20% a-DMPE/DMPG liposomes (kinetic fit: grey line). Source data
Extended Data Fig. 6
Extended Data Fig. 6. Folding OmpA into symmetric and asymmetric DMPE/DMPC liposomes.
(a) Background subtracted FRET signal spectrum between BSA-ANS (bovine serum albumin (BSA) bound to the fluorescence donor aniline-naphthalene sulphonate (ANS)) and increasing concentrations of NBD-DPPE lipid (NBD: 7-nitro-2-1,3-benzoxadiazol-4-yl amino, a fluorescent acceptor) in DMPC liposomes (377 nm excitation). (b) Background subtracted FRET signal spectrum between BSA-ANS and NBD-DPPE asymmetrically incorporated into the outer leaflet of liposomes and control liposomes (no NBD-DPPE included), indicating clear FRET in the asymmetric liposomes. (c) Absolute differences between the fluorophore concentration normalised FRET signals of symmetric and asymmetric liposomes. The larger NBD signal in the asymmetric liposomes is consistent with more of the fluorophore being in the external leaflet and thus closer to the FRET donor ANS bound to BSA in solution. (d) DLS of symmetric and two repeats of asymmetric DMPE-PC liposomes with 20% DMPE incorporation. (e) TLC of duplicate ~20% a-DMPE/PC exchanged liposomes (central two lanes) with unexchanged DMPC (left) and DMPE (right) liposomes. (f) Observed rate constants (s−1) of OmpA folding into symmetric and asymmetric DMPC-PE membranes, showing there are no significant differences in symmetric and asymmetric membranes (labelled ns, see Supplementary Table 11). (g) Urea dependence of OmpA folding yield into DMPE-PC symmetric and asymmetric liposomes. The data are fitted to the average of two repeats (bars are the data range). Source data
Extended Data Fig. 7
Extended Data Fig. 7. Lipids in the outer leaflet interact with specific residues in OMP loops in simulations of symmetric and asymmetric membranes.
Normalised lipid-protein contact counts (number of interactions between each type of lipid and each residue in the transmembrane domain of OmpA normalised by lipid concentration and simulation frame number) for a total of 10% symmetrically or asymmetrically distributed lipid, as indicated in the legend for (a) DMPG (in DMPC base membranes) and (b) DMPC (in DMPG base membranes). The total lipid composition, indicated on each panel, was the same in both symmetric and asymmetric membranes, only protein-lipid interaction data for the 10% supplemented lipid is shown. The data show that DMPG interacts with OmpA’s R81, K94 and R124 in the outer leaflet of asymmetric and symmetric membranes. (c) Normalised contact number for the transmembrane region of OmpA-WT and OmpA-M3 in a 95:5 s-DMPC:PG membrane. Substitution of these three positive residues with Ser eliminates specific DMPG binding. (d) Full length BamA was simulated in a 95:5 s-DMPC:PG system. Only the transmembrane region is shown for clarity. Interactions with a normalised contact number >3σ are labelled, and indicated in main text. Structural features are shown at base of plot (strands (green), extracellular loops (yellow) intracellular turns (red) and 24 residues from POTRA5 (blue)). Source data
Extended Data Fig. 8
Extended Data Fig. 8. Conservation and location of Lys/Arg positively and Asp/Glu negatively charged residues in the extracellular loops of OmpA.
(a) Relative conservation of charged residues (green: well conserved (>99%), yellow: partially conserved (>90%), red: less conserved (<90%)) over 2750 OmpA β-barrel sequence homologs. Conservation is the retention of a K/R or D/E at a given position. Note that R81, K94 and R124 are highly conserved (but are not the only highly conserved residues in the loops). (b) Spatial distribution of positively (Lys/Arg) and negatively charged (Glu/Asp) residues in the extracellular loops of the NMR structure of OmpA (blue: positive, red: negative). R81, K94 and R124 that specifically interact with negatively charged lipids are labelled. (PDB: IG90, note that the z-axis locations of R81, K94 and R124 are highly consistent across all solved structures, including those solved by NMR and X-ray crystallography (Extended Data Fig. 10c). Source data
Extended Data Fig. 9
Extended Data Fig. 9. Folding kinetics and urea-titration of OmpA charge variants compared with WT OmpA in symmetric 90:10 or 20:80 s-DMPC:DMPG LUVs.
The difference in folding rate constants (normalised to WT OmpA) and apparent stability vs. urea concentration for OmpA-variants in symmetric LUVs of composition (a) 90:10 s-DMPC:PG (p-values: WT-NN: 0.086, WT-NP: 0.029) and (b) 20:80 s-DMPC:PG (p-values: WT-NN: 0.005, WT-NP: 0.005), as indicated in the key. (All p-values determined by significance testing, see Supplementary Tables 2–8 for p-values of comparisons described in the text, and Supplementary Table 11 and 12 for all pairwise tests of significance). Source data
Extended Data Fig. 10
Extended Data Fig. 10. Predicted structures from Alphafold2 and sequences from the OMPdb also show a positive region ~ 8 Å from the membrane that is observed in the charged residues in the extracellular loops of OmpA and BamA.
Residue enrichments of Lys/Arg residues in OMPs relative to the probability of finding an amino acid from the soluble regions of the protein randomly for (a) predicted structures from the Alphafold2 database, and (b) sequence data from the OMPdb (see Supplementary Fig. 19 for the residue count from the membrane centre to approximate distance calibration). The dashed green line in (b) indicates the approximate membrane hydrophobic-hydrophilic boundary. (c) OmpA and (d) BamA charge distribution matches the bioinformatic profile. Residues R81, K94 and R124 in OmpA, identified as lipid interacting by CG-MD (OmpA-M3 cluster), are shown in bold. OmpA distances are calculated as the average of the solved E. coli OmpA structures (PDB 1G90, 1QJP, 1BXW). Error bars indicate maximum and minimum values. Positive residues are shown as blue circles, negative residues as red circles and are labelled with residue number above-right of the marker. Source data

Similar articles

Cited by

References

    1. Sriram K, Insel PA. G protein-coupled receptors as targets for approved drugs: how many targets and how many drugs? Mol. Pharmacol. 2018;93:251–258. doi: 10.1124/mol.117.111062. - DOI - PMC - PubMed
    1. Gong J, et al. Understanding membrane protein drug targets in computational perspective. Curr. Drug Targets. 2019;20:551–564. doi: 10.2174/1389450120666181204164721. - DOI - PubMed
    1. Situ AJ, Ulmer TS. Universal principles of membrane protein assembly, composition and evolution. PLoS ONE. 2019;14:e0221372. doi: 10.1371/journal.pone.0221372. - DOI - PMC - PubMed
    1. Dowhan W, Vitrac H, Bogdanov M. Lipid-assisted membrane protein folding and topogenesis. Protein J. 2019;38:274–288. doi: 10.1007/s10930-019-09826-7. - DOI - PMC - PubMed
    1. Hong H, Choi H-K, Yoon T-Y. Untangling the complexity of membrane protein folding. Curr. Opin. Struct. Biol. 2022;72:237–247. doi: 10.1016/j.sbi.2021.11.013. - DOI - PMC - PubMed

Publication types

MeSH terms