. 2023 Oct;19(10):1256-1266.
doi: 10.1038/s41589-023-01413-3. Epub 2023 Sep 14.

Thiol-catalyzed formation of NO-ferroheme regulates intravascular NO signaling

Affiliations

Thiol-catalyzed formation of NO-ferroheme regulates intravascular NO signaling

Anthony W DeMartino et al. Nat Chem Biol. 2023 Oct.

Abstract

Nitric oxide (NO) is an endogenously produced signaling molecule that regulates blood flow and platelet activation. However, intracellular and intravascular diffusion of NO are limited by scavenging reactions with several hemoproteins, raising questions as to how free NO can signal in hemoprotein-rich environments. We explore the hypothesis that NO can be stabilized as a labile ferrous heme-nitrosyl complex (Fe2+-NO, NO-ferroheme). We observe a reaction between NO, labile ferric heme (Fe3+) and reduced thiols to yield NO-ferroheme and a thiyl radical. This thiol-catalyzed reductive nitrosylation occurs when heme is solubilized in lipophilic environments such as red blood cell membranes or bound to serum albumin. The resulting NO-ferroheme resists oxidative inactivation, is soluble in cell membranes and is transported intravascularly by albumin to promote potent vasodilation. We therefore provide an alternative route for NO delivery from erythrocytes and blood via transfer of NO-ferroheme and activation of apo-soluble guanylyl cyclase.


Conflict of interest statement

Competing interests

A.W.D., J.J.R., M.T.G., J.T., M.R.D., D.B.K.-S. and L.P. have a provisional patent filed at the University of Pittsburgh (application no. 63/420,030), related to the creation and use of NO-ferroheme. Though not related directly to NO-ferroheme, A.W.D., J.T., J.J.R., M.T.G., M.R.D. and Q.X. are co-inventors on patents and patent applications directed at the use of heme proteins as therapeutic agents. M.T.G., D.B.K.-S. and J.J.R. are co-inventors on patent and/or patent applications related to sodium nitrite as a therapeutic. Some of these patents are licensed to Globin Solutions, Inc. J.J.R., M.T.G. and J.T. are shareholders of Globin Solutions. J.J.R. and J.T. are officers and directors of Globin Solutions. A.W.D. is a consultant of Globin Solutions. M.T.G. is a consultant, director and scientific advisor to Globin Solutions. The other authors declare no competing interests.

Figures

Extended Data Fig. 1 |
Extended Data Fig. 1 |. Scheme depicting electron transfer to generate NO-ferroheme.
Ferric labile heme reacts with NO to generate a labile nitrosyl ferric heme, which readily is reduced by 1 electron by a small thiol like glutathione (GSH). The mechanism of transfer may follow an inner sphere mechanism (I.S.) where the GSH binds the nitrosyl ferric heme first then transfers the electron, or an outer sphere mechanism (O.S) where binding does not occur. In the presence of excess NO, the generated thiyl radical from either mechanism will react with NO to yield S-nitrosoglutathione (GSNO).
Fig. 1 |
Fig. 1 |. Basis spectra and reaction kinetics of GSH-assisted NO-ferroheme formation in anaerobic MeOH:PBS buffer.
a, Representative reductive nitrosylation of 12.5 μM ferric hemin by 1,250 μM NO showing spectral changes (top) with initial spectrum in light blue, and kinetics at 570 and 611 nm (bottom). b, GSH-catalyzed reductive nitrosylation of 12.5 μM ferric hemin with 125 μM GSH and 125 μM NO, showing same regions as a with initial spectrum in red. c, Addition of 250 μM NO to 12.5 μM ferrous heme (from ~100 μM sodium dithionite) results in a NO-ferroheme spectrum (dashed black line) that is identical to GSH-generated species (red line) observed in a and b, except with the characteristic dithionite peak at 315 nm. d, The spectra of 25 μM ferric heme (dashed black line) and 25 μM ferric heme with 250 μM GSH (green line) are identical. e, 12.5 μM ferric heme with 125 μM GSH (black line) reacted with ~100 μM dithionite, yielding ferrous heme (gold line). All reaction kinetics were completed at 23 °C. Dashed grey vertical lines in ce represent the wavelength where the absorbance begins to be magnified 10× (492–700 nm). f, Observed pseudo-first-order rate constants versus concentration of either GSH (open green circles, [NO] at 250 μM) or NO (open black squares, [GSH] at 250 μM) resulting in observed second-order rate constants of 7,000 and 2,300 M−1 s−1, respectively. Each kobs represents an average of at least four trials. g, Stoichiometry of the thiol-catalyzed reaction in MeOH:PBS buffer determined by NO quantification using a chemiluminescent NO analyzer, where 20 μM NO-ferroheme solution injections (based on heme) into ferricyanide solution (open orange squares, untreated) yielded 17.9 ± 1.9 μM NO and into Cu/Cys (2C assay) yielded 16.0 ± 2.0 μM NO (blue circles, untreated). Pretreatment with 50 mM DMPO results in 18.1 ± 1.5 μM NO and 0.1 ± 0.06 μM NO, respectively (‘+ DMPO’). Each ferricyanide assay point (open orange squares) represents an average of two or three injections examined over n = 11 (untreated) or n = 7 (‘+ DMPO’) NO-ferroheme preparations. Each 2C assay point (blue circles) represents an average of one or two injections examined over n = 7 (untreated) or n = 4 (‘+ DMPO’) NO-ferroheme preparations. The coloured bars present the data as mean ± s.d.
Fig. 2 |
Fig. 2 |. GSH accelerates the reaction of NO and ferric heme in suspended RBC membrane white ghosts under anaerobic conditions.
a, DIC image of red cell ghost preparation (10% by volume) used to mimic biological conditions for this reaction. Bar represents 32 μm. The image is representative of multiple DIC images (n = 3) taken from the RBC membrane preparation, with similar results. b, Over time, 50 μM NO with 25 μM ferric heme solubilized in the RBC membranes results in reductive nitrosylation in the membranes, with the initial spectrum indicated by the teal trace. The time course follows the formation of NO-ferroheme at 570 nm. c, The same reaction as b, except with 250 μM added GSH, results in an increased rate of NO-ferroheme formation, with the initial spectrum indicated by the red trace. d, EPR measurements of the final NO-ferroheme product made using RBC membranes: without GSH (black line, 5.2 μM NO-ferroheme) and with GSH added (blue line, 13.5 μM NO-ferroheme). The dashed grey horizontal line represents the signal background. e, Top: EPR spectra of 25 μM ferric heme, 50 μM GSH and 50 μM NO reacted in RBC membranes at three different powers: 0.1 (blue line), 1 (red line) and 10 mW (black line). The spectra overlap after normalization (dividing the raw intensity by the square root of the power). Bottom: the same reaction and power measurements in the presence of 50 mM DMPO. As organic radicals saturate at higher powers, this demonstrates the formation of a DMPO-glutathionyl radical. EPR spectra were collected at 110 K. f, Chemiluminescent measurements of GSNO using the tri-iodide method show blunting of S-nitrosothiol formation in the presence of DMPO (12.3 ± 1.4 versus 5.3 ± 3.2 μM NO from GSNO measured, respectively; P = 0.0255). Statistics were completed using a two-tailed unpaired t test. Each point represents an average of three injections examined over n = 3 individual experiments. Data presented as mean ± s.d.
Fig. 3 |
Fig. 3 |. NO-ferroheme formation via GSH-catalyzed reductive nitrosylation of ferric heme in serum albumin.
a, Spectral changes of 25 μM ferric heme solubilized by 500 μM albumin in PBS with 250 μM NO and 250 μM GSH under anaerobic conditions at 22 °C. Initial spectrum is indicated by the red trace and the dashed grey vertical line represents the wavelength where the absorbance begins to be magnified 8× (492–700 nm). b, Rates of NO-ferroheme generation in albumin increase with GSH concentration. c, The EPR signature of NO-ferroheme in albumin is consistent with a pentacoordinate NO-ferroheme species. Experimental data are shown together with the theoretical simulation used to obtain g values and hyperfine tensors, as described in Methods. The dashed grey horizontal line represents the signal background. d, Transfer of NO-ferroheme from membranes to serum albumin. Under deaerated conditions, 25 μM ferric heme, 50 μM glutathione and 50 μM NO were added to RBC membrane ghosts. Addition of 75 μM serum albumin resulted in the dashed black spectrum, which exhibits typical light scattering due to turbidity from insoluble membranes. To confirm that the NO-ferroheme was transferred from membranes to albumin, the mixture was centrifuged at 30,000g for 2 h, resulting in complete membrane precipitation and pelleting, leaving behind NO-ferroheme in the albumin (red trace). The dashed grey vertical line represents the wavelength where the absorbance begins to be magnified 3× (492–700 nm). e, Transfer of NO-ferroheme from albumin to apo-myoglobin in 1:1 ratio of heme to apo-myoglobin. Peaks characteristic of nitrosyl-myoglobin (black traces) are observed rapidly following addition of apo-myoglobin to NO-ferroheme solubilized with albumin (red trace). Observation of isosbestic points indicates direct NO-ferroheme transfer. The dashed grey vertical line represents the wavelength where the absorbance begins to be magnified 4× (492–700 nm). Inset: formation of nitrosyl-myoglobin over time following the Soret formation at 421 nm with an estimated half-life of 5 s under these conditions. Transfer was performed at 37 °C.
Fig. 4 |
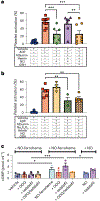
Fig. 4 |. Effects of NO-ferroheme albumin on platelet activation.
a, Activated platelets are inhibited by NO-ferroheme formed from ferric heme. Platelet-rich plasma was diluted seven-fold with anaerobic PBS (blue circles, n = 11). Addition of 2 μM ADP after 10 min of incubation stimulated activation (red squares, n = 11); ADP was added to all subsequent experiments after adding other components (for example, NO-ferroheme). NO alone (2 μM) inhibited platelet activation (green diamonds, n = 6, P = 0.0008). Moreover, 2.5 μM heme and 2 μM NO in 7.5 μM albumin (slow reductive nitrosylation) resulted in little abrogation of activation (purple triangles, n = 7). Addition of 25 μM GSH to this reaction resulted in significant platelet inhibition (orange hexagons, n = 9, P = 0.0002), more than without GSH (P = 0.0031). Each symbol within a bar represents an independent experiment from a different blood donor (n = 44 total). b, Activated platelets are inhibited by NO-ferroheme formed from ferrous heme. Vehicle (blue circles, n = 6) and ADP controls (red squares, n = 6) were as described in a. Using the concentrations in a, NO-ferroheme albumin was synthesized using sodium dithionite (Na2S2O4). Ferrous heme did not inhibit platelet activation (gold upside-down triangles, n = 4). This NO-ferroheme significantly inhibited platelets without and with GSH (green diamonds, n = 3, P = 0.004; orange hexagons, n = 5, P = 0.0082, respectively). Each symbol represents an independent experiment from a different donor (n = 24 total). c, Establishment of sGC activation by NO-ferroheme via cGMP detection. All controls (color-filled open shapes) without NO or NO-ferroheme exhibited basal cGMP production. Addition of NO-ferroheme (light-blue solid hexagons, P = 0.0177) and NO-ferroheme with the PDE inhibitor tadalafil (solid purple squares, P = 0.0005) resulted in significant increases in cGMP versus each respective control. sGC-oxidizing ODQ ablated NO-ferroheme response (solid red circles and solid orange diamonds). NO-ferroheme with tadalafil (solid purple squares) resulted in more cGMP than NO with tadalafil (gray-filled purple squares, P = 0.0456). Each symbol represents an independent experiment from a different donor (n = 3 for each, n = 30 total). All statistics were completed using ordinary one-way ANOVA tests and post hoc Fisher’s least-squares difference tests. Experiments were performed at 37 °C. The coloured bars present the data as mean ± s.e.m. Asterisks displayed represent P ≤ 0.05 (*), P ≤ 0.01 (**) and P ≤ 0.001 (***). All experiments were performed at least thrice, with comparable results.
Fig. 5 |
Fig. 5 |. Changes in murine MAP by NO-ferroheme in albumin from glutathione-catalyzed reductive nitrosylation.
a, NO-ferroheme induced vasodilation at different concentrations under 10% oxygenated breathing. Under administered L-NAME, mice were given normal saline (blue trace, n = 5) or one of three regimens at estimated blood concentrations of 7.5 nM, 75 nM, 0.75 μM and 7.5 μM (vertical dotted grey lines): freshly prepared NO-ferroheme solution in albumin (red trace, n = 9), a control of dissolved NO (dashed green trace, n = 5) or a control of GSNO (pink trace, n = 4). b, Normoxic MAP traces (normal saline, n = 4; NO-ferroheme, n = 8; dissolved NO, n = 4). The legend in a applies. c, Maximum changes in MAP under hypoxia. NO-ferroheme albumin (open red squares) triggered acute vasodilation in a concentration-dependent manner compared with controls: versus normal saline (blue circles; P < 0.0001 at 75 nM, 0.75 μM and 7.5 μM), versus dissolved NO (open green circles; P = 0.0002 at 75 nM, P < 0.0001 at 0.75 and 7.5 μM) and versus GSNO (open pink diamonds; P = 0.0014 at 75 nM, P < 0.0001 at 0.75 and 7.5 μM). The NO and GSNO controls exhibited no significant changes in MAP, except at 7.5 μM NO (P = 0.0209). d, Maximum changes in MAP under normoxia. NO-ferroheme solution (open red squares) triggered vasodilation versus saline (blue circles; P = 0.0002 at 75 nM, P < 0.0001 at 0.75 and 7.5 μM) and versus NO controls (open green circles; P = 0.0015 at 75 nM, P < 0.0001 at 0.75 and 7.5 μM). The NO control was significant versus saline at 7.5 μM (P = 0.0004). The legend in c applies. e, Comparison between maximum MAP responses toward NO-ferroheme at each concentration under hypoxia (10% oxygen, grey-filled circles) and normoxia (21% oxygen, open squares). There are no significant differences except at 0.75 μM, where NO-ferroheme exhibits a more potent hypoxic response (P = 0.0018). Statistical significance was analyzed using a two-way ANOVA and post hoc Tukey’s multiple comparisons test; only significant interactions are shown. MAP data in a and b are presented as mean ± s.e.m. Bars in c, d and e are presented as mean ± s.d., and a single point in each concentration represents n = 1 independent animal. Asterisks displayed represent P ≤ 0.05 (*), P ≤ 0.01 (**), P ≤ 0.001 (***) and P ≤ 0.0001 (****). All experiments were performed at least four times, with comparable results.
Fig. 6 |
Fig. 6 |. Changes in murine MAP by NO-ferroheme prepared via ferrous heme generation by sodium dithionite and NO addition in albumin.
a, Observed MAP changes from NO-ferroheme made from ferrous heme. Under hypoxia (10% oxygen) and administered L-NAME, mice were administered NO-ferroheme albumin doses at estimated blood concentrations of 7.5 nM, 75 nM, 0.75 μM and 7.5 μM (vertical dotted grey lines) prepared by hemin reduction by 10% excess dithionite (teal trace, n = 5). This preparation results in less robust vasodilatory responses to NO-ferroheme albumin than of those prepared via GSH-catalyzed reductive nitrosylation (red trace, n = 9), with all responses compared to normal saline controls (blue trace, n = 3). However, addition of 3 mM GSH to this solution restored such activity (black trace, n = 5). These regimens were administered in doses 10 min apart, giving estimated blood concentration in the mouse of 7.5 nM, 75 nM, 0.75 μM and 7.5 μM of each preparation. Data presented as mean ± s.e.m. b, ΔMAPmax quantification for each injected species described in a. NO-ferroheme prepared via GSH-catalyzed reductive nitrosylation (open red squares) triggered potent vasodilation versus normal saline (blue circles; n = 3, P < 0.0001 at 75 nM, 0.75 μM and 7.5 μM) and versus NO-ferroheme prepared with dithionite without GSH (open teal diamonds; P = 0.0004 at 75 nM, P < 0.0001 at 0.75 and 7.5 μM), though this solution does trigger some vasodilatory response at 7.5 μM versus normal saline (P = 0.0099). Addition of GSH to the dithionite preparation of NO-ferroheme increases vasodilation versus normal saline (open black circles; P = 0.0478 at 75 nM, P < 0.0001 at 0.75 and 7.5 μM) and versus the dithionite preparation without GSH (P < 0.0001 at 0.75 and 7.5 μM). Statistics completed using two-way ANOVA tests and post hoc Tukey’s multiple comparisons tests; only significant interactions are shown. The coloured bars present the data as mean ± s.d., and a single point in each concentration represents n = 1 independent animal. Asterisks displayed represent P ≤ 0.05 (*), P ≤ 0.01 (**), P ≤ 0.001 (***) and P ≤ 0.0001 (****). All experiments were performed at least thrice, with comparable results.

Update of

Similar articles

Cited by

References

    1. Chambers IG, Willoughby MM, Hamza I & Reddi AR One ring to bring them all and in the darkness bind them: the trafficking of heme without deliverers. Biochim. Biophys. Acta 1868, 118881 (2021). - PMC - PubMed
    1. Sun F et al. HRG-9 homologues regulate haem trafficking from haem-enriched compartments. Nature 610, 768–774 (2022). - PMC - PubMed
    1. Hanna DA et al. Heme dynamics and trafficking factors revealed by genetically encoded fluorescent heme sensors. Proc. Natl Acad. Sci. USA 113, 7539–7544 (2016). - PMC - PubMed
    1. Dai Y, Sweeny EA, Schlanger S, Ghosh A & Stuehr DJ GAPDH delivers heme to soluble guanylyl cyclase. J. Biol. Chem 295, 8145–8154 (2020). - PMC - PubMed
    1. Kharitonov VG, Sharma VS, Magde D & Koesling D Kinetics of nitric oxide dissociation from five- and six-coordinate nitrosyl hemes and heme proteins, including soluble guanylate cyclase. Biochemistry 36, 6814–6818 (1997). - PubMed

Publication types