Healthcare educational debt in the united states: unequal economic impact within interprofessional team members
- PMID: 37710228
- PMCID: PMC10503048
- DOI: 10.1186/s12909-023-04634-1
Healthcare educational debt in the united states: unequal economic impact within interprofessional team members
Abstract
Background: Advancing healthcare access and quality for underserved populations requires a diverse, culturally competent interprofessional workforce. However, high educational debt may influence career choice of healthcare professionals. In the United States, health professions lack insight into the maximum educational debt that can be supported by current entry-level salaries. The purpose of this interprofessional economic analysis was to examine whether average educational debt for US healthcare graduates is supportable by entry-level salaries. Additionally, the study explored whether trainees from minoritized backgrounds graduate with more educational debt than their peers in physical therapy.
Methods: The study modeled maximum educational debt service ratios for 12 healthcare professions and 6 physician specialties, incorporating profession-specific estimates of entry-level salary, salary growth, national average debt, and 4 loan repayment scenarios offered by the US Department of Education Office of Student Financial Aid. Net present value (NPV) provided an estimate for lifetime "economic power" for the modeled careers. The study used a unique data source available from a single profession (physical therapy, N = 4,954) to examine whether educational debt thresholds based on the repayment model varied between minoritized groups and non-minoritized peers.
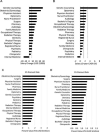
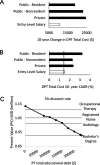
Results: High salary physician specialties (e.g. obstetrics/gynecology, surgery) and professions without graduate debt (e.g. registered nurse) met debt ratio targets under any repayment plan. Professions with strong salary growth and moderate debt (e.g. physician assistant) required extended repayment plans but had high career NPV. Careers with low salary growth and high debt relative to salary (e.g. physical therapy) had career NPV at the lowest range of modeled professions. 29% of physical therapy students graduated with more debt than could be supported by entry-level salaries. Physical therapy students from minoritized groups graduated with 10-30% more debt than their non-minoritized peers.
Conclusions: Graduates from most healthcare professions required extended repayment plans (higher interest) to meet debt ratio benchmarks. For several healthcare professions, low debt relative to salary protected career NPV. Students from minoritized groups incurred higher debt than their peers in physical therapy.
Keywords: Allied health occupations; Debt; Economics; Education; Ethnic and racial minorities; Health workforce; Interprofessional; Minority groups; Salary; Sexual and gender minorities.
© 2023. BioMed Central Ltd., part of Springer Nature.
Conflict of interest statement
The authors declare no competing interests.
Figures


Similar articles
-
Physiotherapy education is a good financial investment, up to a certain level of student debt: an inter-professional economic analysis.J Physiother. 2018 Jul;64(3):183-191. doi: 10.1016/j.jphys.2018.05.009. Epub 2018 Jun 15. J Physiother. 2018. PMID: 29914805
-
Can medical students afford to choose primary care? An economic analysis of physician education debt repayment.Acad Med. 2013 Jan;88(1):16-25. doi: 10.1097/ACM.0b013e318277a7df. Acad Med. 2013. PMID: 23165279
-
From Debt to Dollars: Assessing a General Surgeon's Career Value.J Surg Res. 2023 Nov;291:527-535. doi: 10.1016/j.jss.2023.07.007. Epub 2023 Aug 2. J Surg Res. 2023. PMID: 37540970
-
Impact of Service-Based Student Loan Repayment Program on the Primary Care Workforce.Ann Fam Med. 2023 Jul-Aug;21(4):327-331. doi: 10.1370/afm.3002. Ann Fam Med. 2023. PMID: 37487722 Free PMC article. Review.
-
The impact of student debt on neurological practice.J Neurol Sci. 2021 Aug 15;427:117536. doi: 10.1016/j.jns.2021.117536. Epub 2021 Jun 12. J Neurol Sci. 2021. PMID: 34139451 Review.
Cited by
-
The effect of education debt on PAs' specialty choice or preference.JAAPA. 2025 Jan 1;38(1):35-44. doi: 10.1097/01.JAA.0000000000000166. Epub 2024 Dec 19. JAAPA. 2025. PMID: 39652650 Free PMC article.
-
Student Debt Associated With Entry-Level Athletic Training Education.J Athl Train. 2024 Dec 1;59(12):1230-1238. doi: 10.4085/1062-6050-0044.24. J Athl Train. 2024. PMID: 38894677
-
Student loan debt and income among chiropractors: A description of consultancy data.J Chiropr Educ. 2024 Oct 23;38(2):137-141. doi: 10.7899/JCE-23-31. J Chiropr Educ. 2024. PMID: 39278826 Free PMC article.
References
-
- Institute of Medicine. Unequal Treatment: Confronting Racial and Ethnic Disparities in Health Care. 2003. https://www.ncbi.nlm.nih.gov/pubmed/25032386. Accessed 6 Jan 2023.
-
- Centers for Disease Control and Prevention. CDC Health Disparities and Inequalities Report - United States., 2013. 2013. https://www.ncbi.nlm.nih.gov/pubmed/24264483. Accessed 24 Jan 2023.
-
- Shen MJ, Peterson EB, Costas-Muniz R, Hernandez MH, Jewell ST, Matsoukas K, et al. The effects of race and racial concordance on patient-physician communication: a systematic review of the literature. J Racial Ethn Health Disparities. 2018;5:117–40. doi: 10.1007/s40615-017-0350-4. - DOI - PMC - PubMed
-
- Bogdan-Lovis E, Zhuang J, Goldbort J, Shareef S, Bresnahan M, Kelly-Blake K et al. Do Black birthing persons prefer a black health care provider during birth? Race concordance in birth birth. 2023;50:310–8. - PubMed
MeSH terms
LinkOut - more resources
Full Text Sources
Miscellaneous

