Association between dietary folate intake and bone mineral density in a diverse population: a cross-sectional study
- PMID: 37710267
- PMCID: PMC10503018
- DOI: 10.1186/s13018-023-04188-4
Association between dietary folate intake and bone mineral density in a diverse population: a cross-sectional study
Abstract
Background: Osteoporosis is a major public health problem, yet the association between dietary folate intake and bone health has been rarely studied. This study aimed to investigate the relationship between dietary folate intake and bone mineral density (BMD) in the general population of the USA.
Methods: Utilizing data from the National Health and Nutrition Examination Survey, dietary folate intake was gauged through 24-h dietary recall and BMD was determined via dual-energy X-ray absorptiometry. Multivariate linear regression models and generalized additive models were employed for correlation analysis.
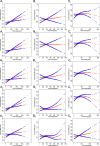
Results: The study incorporated 9839 participants (48.88% males, aged 20-85 years, mean age: 47.62 ± 16.22). The average dietary folate intake stood at 401.1 ± 207.9 μg/day. And the average total femur, femoral neck, trochanter, intertrochanter, and lumbar BMD were 0.98 ± 0.16 g/cm2, 0.84 ± 0.15 g/cm2, 0.73 ± 0.13 g/cm2, 1.16 ± 0.19 g/cm2, and 1.03 ± 0.15 g/cm2, respectively. The higher quartiles of dietary folate intake directly correlated with increased total femoral, femoral neck, intertrochanteric, and lumbar BMD (P for trend = 0.003, 0.016, < 0.001, and 0.033, respectively). A consistent positive association between folate intake and BMD across age groups was observed, with significant findings for individuals over 80 years and non-Hispanic whites. Physical activity level and serum 25-hydroxyvitamin D levels influenced the association, with an optimal daily folate intake of 528-569 µg recommended for postmenopausal women.
Conclusion: In summary, our study reveals a significant positive association between dietary folate intake and BMD, across different age groups and particularly among individuals over 80 years old. Non-Hispanic whites benefit the most from increased folate intake. Physical activity level and serum 25-hydroxyvitamin D levels interact with this association. Screening and early intervention for osteoporosis may be essential for individuals with low dietary folate intake.
Keywords: Bone mineral density; Cross-sectional; Dietary folate intake; Nonlinear relationship.
© 2023. BioMed Central Ltd., part of Springer Nature.
Conflict of interest statement
All authors (ZZ, HL, WX, QX) declare that they have no known competing financial interests or personal relationships that could have appeared to influence the work reported in this paper.
Figures


Similar articles
-
Association between RBC folate and lumbar bone mineral density in postmenopausal women, a cross-sectional study from NHANES 2009-2018.Front Endocrinol (Lausanne). 2025 Apr 28;16:1559043. doi: 10.3389/fendo.2025.1559043. eCollection 2025. Front Endocrinol (Lausanne). 2025. PMID: 40357211 Free PMC article.
-
Dietary riboflavin (vitamin B2) intake and osteoporosis in U.S. female adults: unveiling of association and exploration of potential molecular mechanisms.Nutr J. 2025 Apr 7;24(1):53. doi: 10.1186/s12937-025-01103-x. Nutr J. 2025. PMID: 40189526 Free PMC article.
-
Association of selenium intake with bone mineral density and osteoporosis: the national health and nutrition examination survey.Front Endocrinol (Lausanne). 2023 Sep 29;14:1251838. doi: 10.3389/fendo.2023.1251838. eCollection 2023. Front Endocrinol (Lausanne). 2023. PMID: 37842299 Free PMC article.
-
Association between Dietary Carotenoid Intake and Bone Mineral Density in Korean Adults Aged 30-75 Years Using Data from the Fourth and Fifth Korean National Health and Nutrition Examination Surveys (2008-2011).Nutrients. 2017 Sep 16;9(9):1025. doi: 10.3390/nu9091025. Nutrients. 2017. PMID: 28926945 Free PMC article.
-
Soy protein consumption and bone mass in early postmenopausal Chinese women.Osteoporos Int. 2003 Oct;14(10):835-42. doi: 10.1007/s00198-003-1453-9. Epub 2003 Aug 14. Osteoporos Int. 2003. PMID: 12920508 Review.
Cited by
-
Association between RBC folate and lumbar bone mineral density in postmenopausal women, a cross-sectional study from NHANES 2009-2018.Front Endocrinol (Lausanne). 2025 Apr 28;16:1559043. doi: 10.3389/fendo.2025.1559043. eCollection 2025. Front Endocrinol (Lausanne). 2025. PMID: 40357211 Free PMC article.
-
Nutrition-Based Support for Osteoporosis in Postmenopausal Women: A Review of Recent Evidence.Int J Womens Health. 2024 Apr 18;16:693-705. doi: 10.2147/IJWH.S409897. eCollection 2024. Int J Womens Health. 2024. PMID: 38650834 Free PMC article. Review.
-
Impact of Folate Intake on Bone Mineral Density in Patients with Inflammatory Bowel Disease.Nutrients. 2023 Dec 19;16(1):6. doi: 10.3390/nu16010006. Nutrients. 2023. PMID: 38201836 Free PMC article.
-
Association between dietary folate intake and the risk of osteoporosis in adults: a cross-sectional study.BMC Musculoskelet Disord. 2024 Jun 22;25(1):487. doi: 10.1186/s12891-024-07605-9. BMC Musculoskelet Disord. 2024. PMID: 38909178 Free PMC article.
-
Folate deficiency and total shoulder arthroplasty outcomes.Shoulder Elbow. 2025 Aug 18:17585732251362442. doi: 10.1177/17585732251362442. Online ahead of print. Shoulder Elbow. 2025. PMID: 40843037 Free PMC article.
References
-
- Johnston CB, Dagar M. Osteoporosis in older adults. Med Clin North Am. 2020;104(5):873–884. - PubMed
-
- Hernlund E, Svedbom A, Ivergård M, Compston J, Cooper C, Stenmark J, McCloskey EV, Jönsson B, Kanis JA. Osteoporosis in the European Union: medical management, epidemiology and economic burden. A report prepared in collaboration with the International Osteoporosis Foundation (IOF) and the European Federation of Pharmaceutical Industry Associations (EFPIA) Arch Osteoporos. 2013;8(1):136. - PMC - PubMed
-
- Office of the Surgeon G: Reports of the Surgeon General . Bone health and osteoporosis: a report of the surgeon general. Rockville: Office of the Surgeon General (US); 2004. - PubMed
MeSH terms
Substances
Grants and funding
LinkOut - more resources
Full Text Sources
Medical

