Quantitative analysis using intraoperative contrast-enhanced ultrasound in adult-type diffuse gliomas with isocitrate dehydrogenase mutations: association between hemodynamics and molecular features
- PMID: 37710388
- PMCID: PMC10555694
- DOI: 10.14366/usg.23031
Quantitative analysis using intraoperative contrast-enhanced ultrasound in adult-type diffuse gliomas with isocitrate dehydrogenase mutations: association between hemodynamics and molecular features
Abstract
Purpose: The relationship between contrast-enhanced ultrasound (CEUS) hemodynamics and the molecular biomarkers of adult-type diffuse gliomas, particularly isocitrate dehydrogenase (IDH), remains unclear. This study was conducted to provide a comprehensive description of the vascularization of adult-type diffuse gliomas using quantitative indicators. Additionally, it was designed to identify any variables with the potential to intraoperatively predict IDH mutation status.
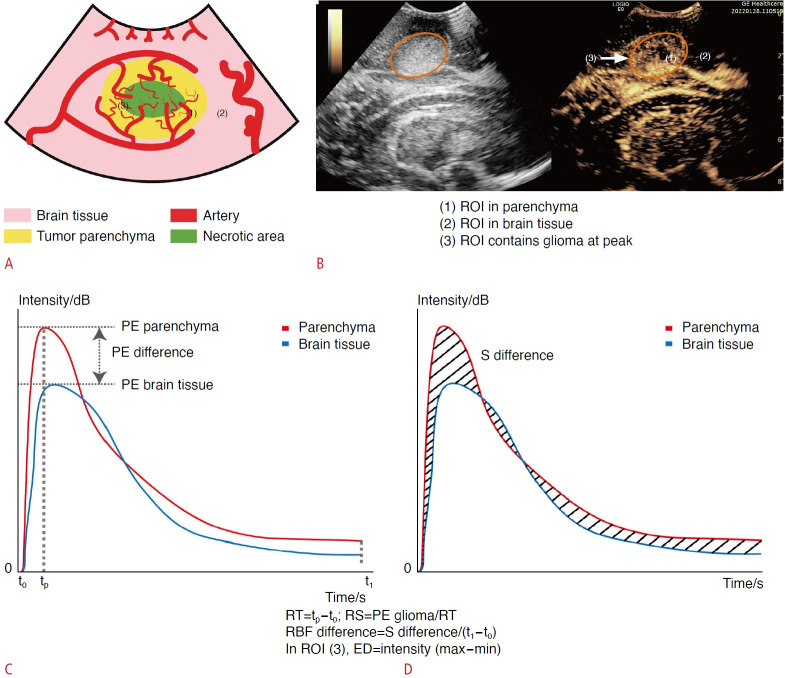
Methods: This prospective study enrolled patients with adult-type diffuse gliomas between November 2021 and September 2022. Intraoperative CEUS was performed, and CEUS videos were recorded for 90-second periods. Hemodynamic parameters, including the peak enhancement (PE) difference, were calculated based on the time-intensity curve of the region of interest. A differential analysis was performed on the CEUS parameters with respect to molecular biomarkers and grades. Receiver operating characteristic curves for various parameters were analyzed to evaluate the ability of those parameters to predict IDH mutation status.
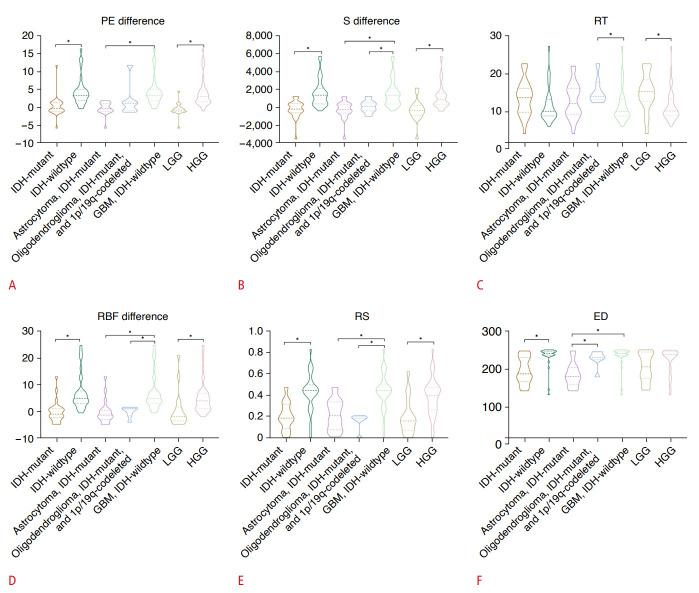
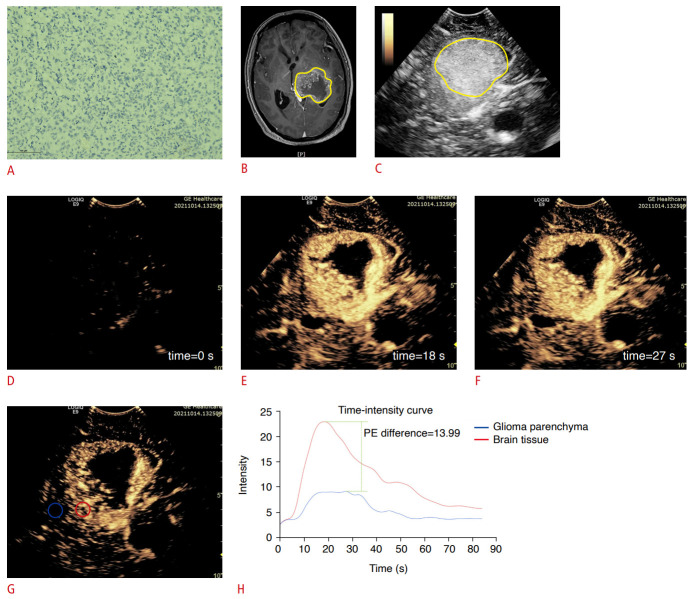
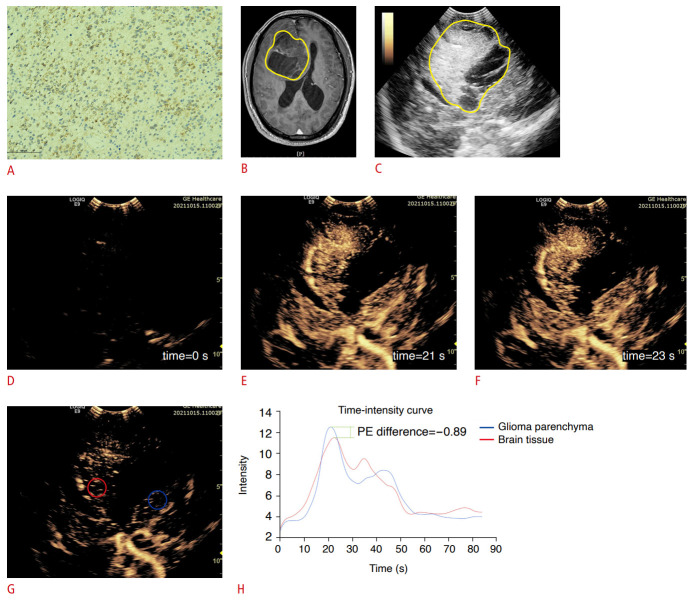
Results: Sixty patients with adult-type diffuse gliomas were evaluated. All hemodynamic parameters, apart from rising time, demonstrated significant differences between IDH-mutant and IDH-wildtype adult-type diffuse gliomas. The PE difference emerged as the optimal indicator for differentiating between IDH-wildtype and IDH-mutant gliomas, with an area under the curve of 0.958 (95% confidence interval, 0.406 to 0.785). Additionally, the hemodynamic parameters revealed significant differences across both grades and types of adult-type diffuse gliomas.
Conclusion: Hemodynamic parameters can be used intraoperatively to effectively distinguish between IDHwildtype and IDH-mutant adult-type diffuse gliomas. Additionally, quantitative CEUS equips neurosurgeons with dynamic perfusion information for various types and grades of adult-type diffuse gliomas.
Keywords: Adult-type diffuse gliomas; Hemodynamics; Isocitrate dehydrogenase; Ultrasonography, contrast agent.
Conflict of interest statement
This work was financially supported by the National Natural Science Foundation of China (No. 82272017). The authors report no conflict of interest concerning the materials or methods used in this study or the findings specified in this paper.
Figures
Similar articles
-
Tumor oxygenation imaging biomarkers using dynamic susceptibility contrast imaging for prediction of IDH mutation status in adult-type diffuse gliomas.Eur Radiol. 2025 May 24. doi: 10.1007/s00330-025-11704-z. Online ahead of print. Eur Radiol. 2025. PMID: 40411552
-
Preoperative Determination of Isocitrate Dehydrogenase Mutation in Gliomas Using Spectral Editing MRS: A Prospective Study.J Magn Reson Imaging. 2021 Feb;53(2):416-426. doi: 10.1002/jmri.27366. Epub 2020 Sep 17. J Magn Reson Imaging. 2021. PMID: 32940938
-
Combined texture analysis of dynamic contrast-enhanced MRI with histogram analysis of diffusion kurtosis imaging for predicting IDH mutational status in gliomas.Acta Radiol. 2023 Sep;64(9):2552-2560. doi: 10.1177/02841851231180291. Epub 2023 Jun 18. Acta Radiol. 2023. PMID: 37331987
-
Integrated diagnostics of diffuse astrocytic and oligodendroglial tumors.Pathologe. 2019 Jun;40(Suppl 1):9-17. doi: 10.1007/s00292-019-0581-8. Pathologe. 2019. PMID: 31025086 Review. English.
-
[Integrated diagnostics of diffuse astrocytic and oligodendroglial tumors. German version].Pathologe. 2019 Mar;40(2):131-139. doi: 10.1007/s00292-019-0575-6. Pathologe. 2019. PMID: 30790013 Review. German.
Cited by
-
Challenges with segmenting intraoperative ultrasound for brain tumours.Acta Neurochir (Wien). 2024 Aug 1;166(1):317. doi: 10.1007/s00701-024-06179-8. Acta Neurochir (Wien). 2024. PMID: 39090435 Free PMC article.
References
-
- Weller M, Wick W, Aldape K, Brada M, Berger M, Pfister SM, et al. Glioma. Nat Rev Dis Primers. 2015;1:15017. - PubMed
Grants and funding
LinkOut - more resources
Full Text Sources